 17
17peptides
spectra
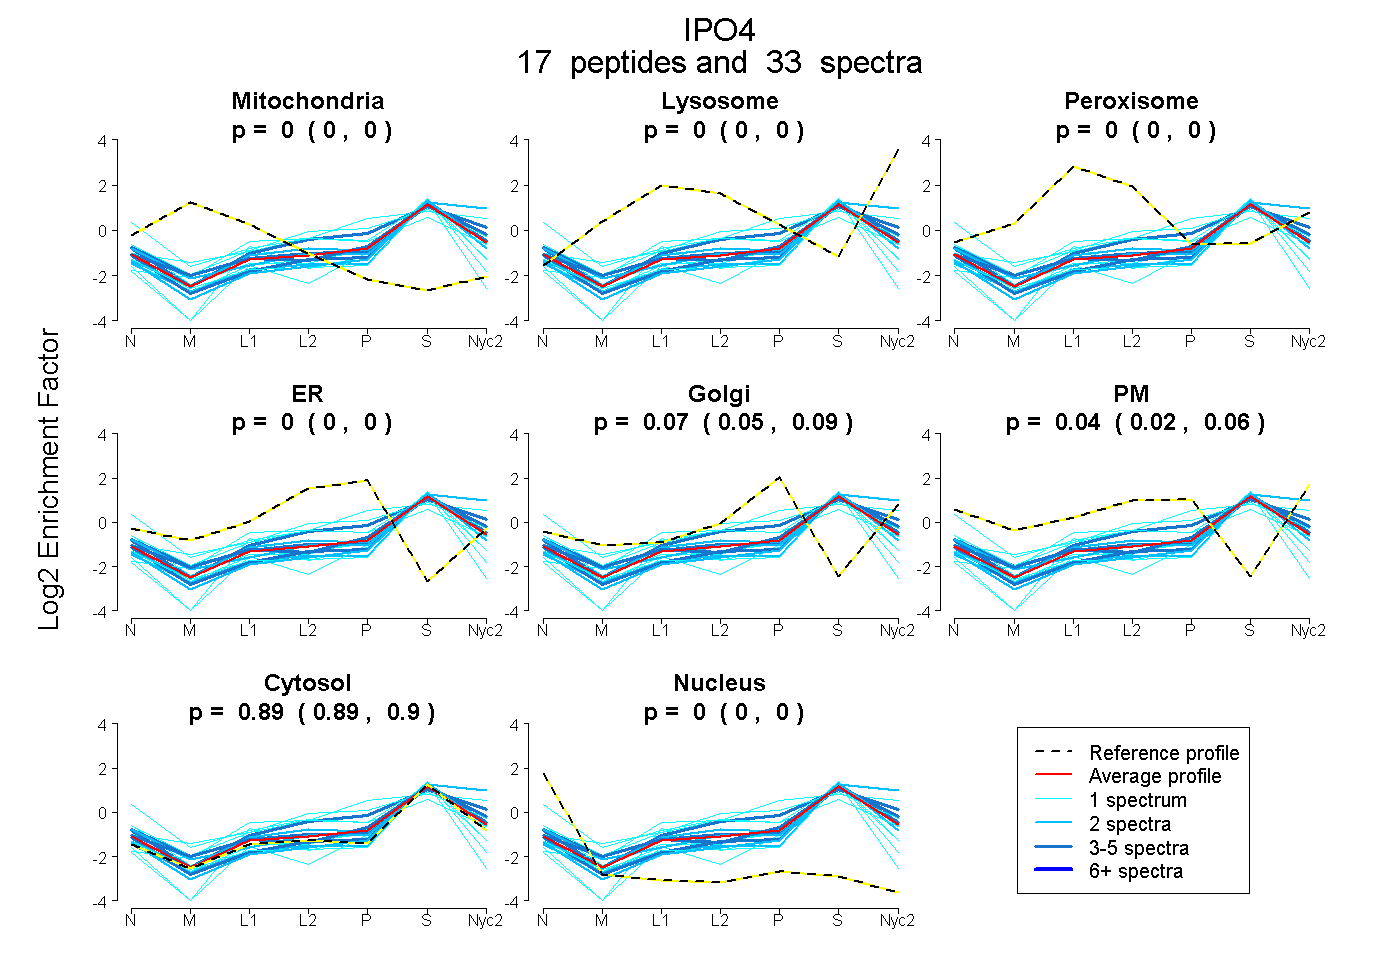
0.000 | 0.000
0.000 | 0.000
0.000 | 0.000
0.000 | 0.000
0.048 | 0.086
0.018 | 0.055
0.886 | 0.898
0.000 | 0.000
| Plot | Mito | Lyso | Perox | ER | Golgi | PM | Cytosol | Nucleus | |||||
| Expt A |
17 peptides |
33 spectra |
|
0.000 0.000 | 0.000 |
0.000 0.000 | 0.000 |
0.000 0.000 | 0.000 |
0.000 0.000 | 0.000 |
0.069 0.048 | 0.086 |
0.039 0.018 | 0.055 |
0.893 0.886 | 0.898 |
0.000 0.000 | 0.000 |
| 2 spectra, LLECPHMNVR | 0.000 | 0.000 | 0.000 | 0.000 | 0.000 | 0.123 | 0.877 | 0.000 | ||
| 1 spectrum, LSELCNVLK | 0.000 | 0.000 | 0.000 | 0.000 | 0.000 | 0.000 | 0.850 | 0.150 | ||
| 1 spectrum, AIPSYMQAVK | 0.000 | 0.000 | 0.000 | 0.000 | 0.000 | 0.000 | 0.969 | 0.031 | ||
| 3 spectra, LFPVLLNNAR | 0.000 | 0.000 | 0.000 | 0.000 | 0.023 | 0.000 | 0.970 | 0.007 | ||
| 1 spectrum, AGFLVLAVLSDGAGDHIR | 0.000 | 0.175 | 0.000 | 0.000 | 0.254 | 0.000 | 0.570 | 0.000 | ||
| 4 spectra, GLDDPSQVVR | 0.000 | 0.063 | 0.000 | 0.000 | 0.096 | 0.098 | 0.744 | 0.000 | ||
| 1 spectrum, LCPHVMPMLEEALR | 0.000 | 0.000 | 0.123 | 0.084 | 0.000 | 0.000 | 0.793 | 0.000 | ||
| 1 spectrum, GPSDPNNAALQSSLAR | 0.000 | 0.000 | 0.119 | 0.009 | 0.000 | 0.214 | 0.568 | 0.090 | ||
| 1 spectrum, NVALGEAIR | 0.000 | 0.006 | 0.047 | 0.178 | 0.000 | 0.094 | 0.676 | 0.000 | ||
| 4 spectra, SEAPYQR | 0.000 | 0.055 | 0.000 | 0.000 | 0.099 | 0.000 | 0.845 | 0.000 | ||
| 5 spectra, LAPEQR | 0.000 | 0.000 | 0.007 | 0.000 | 0.000 | 0.135 | 0.858 | 0.000 | ||
| 2 spectra, LLMASPAGK | 0.000 | 0.201 | 0.000 | 0.000 | 0.000 | 0.000 | 0.799 | 0.000 | ||
| 1 spectrum, LAEPGAR | 0.000 | 0.000 | 0.000 | 0.000 | 0.065 | 0.000 | 0.935 | 0.000 | ||
| 1 spectrum, ATEQLQTALR | 0.000 | 0.000 | 0.000 | 0.000 | 0.081 | 0.034 | 0.856 | 0.029 | ||
| 2 spectra, YLRPDDVSLAR | 0.000 | 0.000 | 0.000 | 0.000 | 0.000 | 0.000 | 0.982 | 0.018 | ||
| 1 spectrum, EPAGLEQILK | 0.000 | 0.000 | 0.000 | 0.000 | 0.000 | 0.000 | 0.965 | 0.035 | ||
| 2 spectra, EADPEVR | 0.000 | 0.000 | 0.000 | 0.000 | 0.000 | 0.000 | 0.983 | 0.017 |
| Plot | Mito | Lyso or Perox | ER | Golgi | PM | Cytosol | Nucleus | ||||||
| Expt B |
4 peptides |
7 spectra |
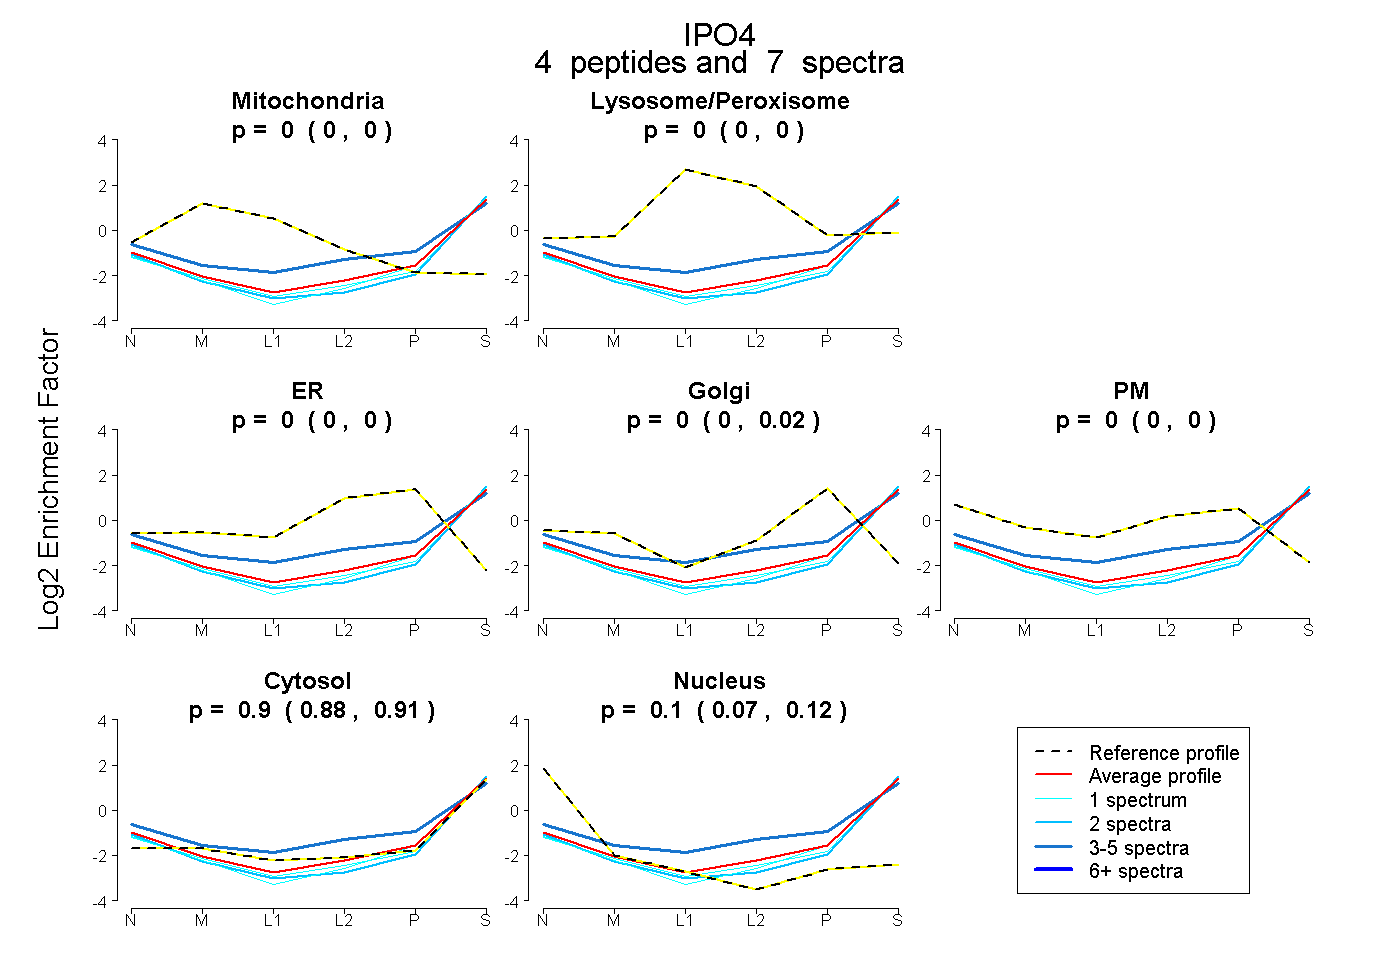 |
0.000 0.000 | 0.000 |
0.000 0.000 | 0.000 |
0.000 0.000 | 0.000 |
0.000 0.000 | 0.021 |
0.000 0.000 | 0.000 |
0.900 0.877 | 0.915 |
0.100 0.072 | 0.119 |
|||
| Plot | Lyso | Other | |||||||||||
| Expt C |
10 peptides |
32 spectra |
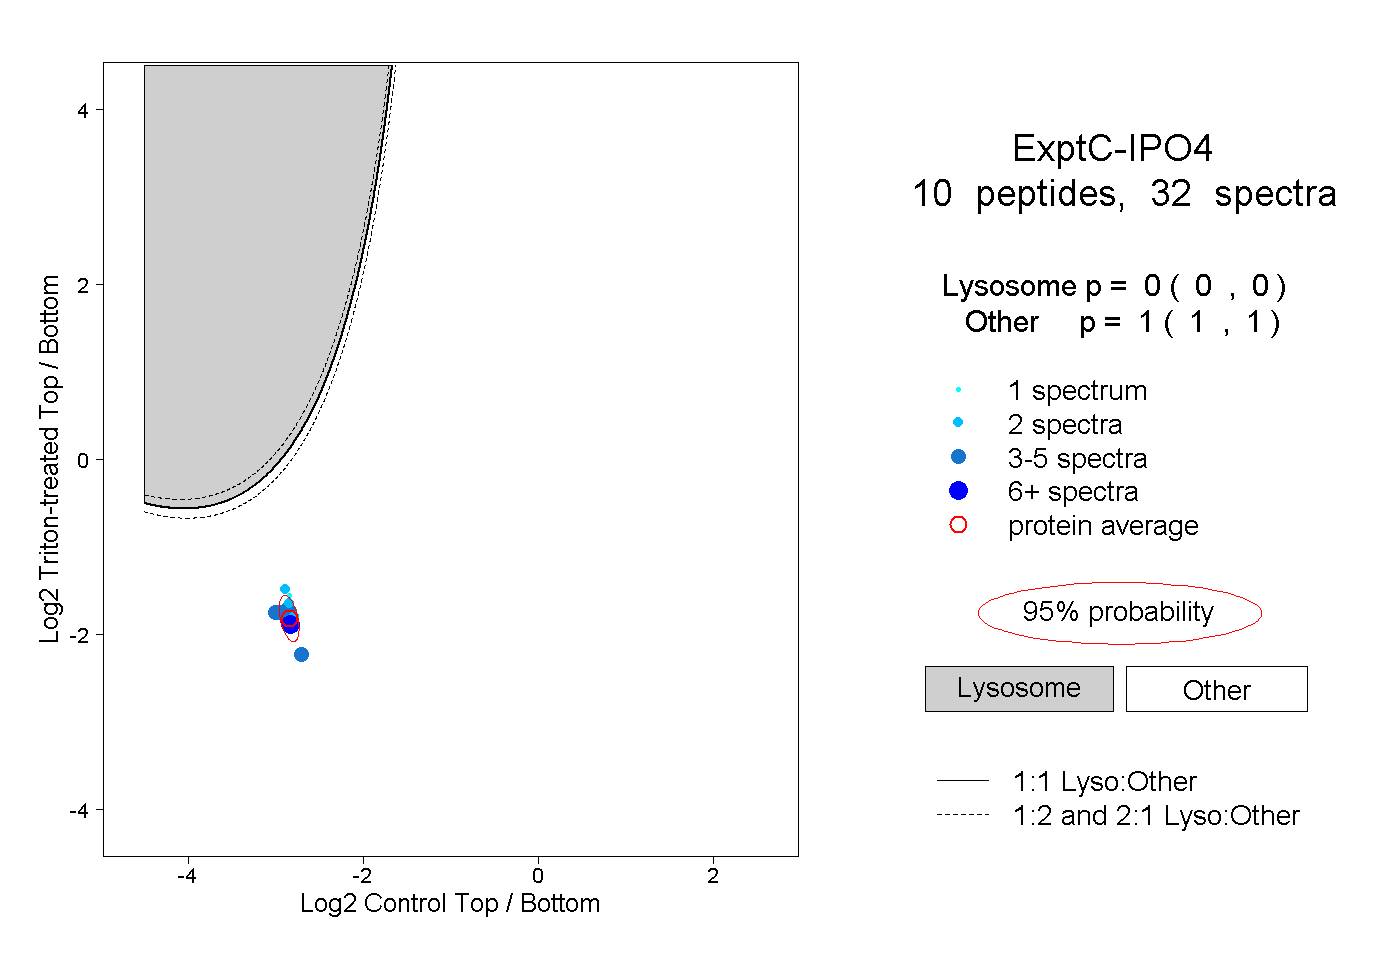 |
0.000 0.000 | 0.000 |
1.000 1.000 | 1.000 |