 20
20peptides
spectra
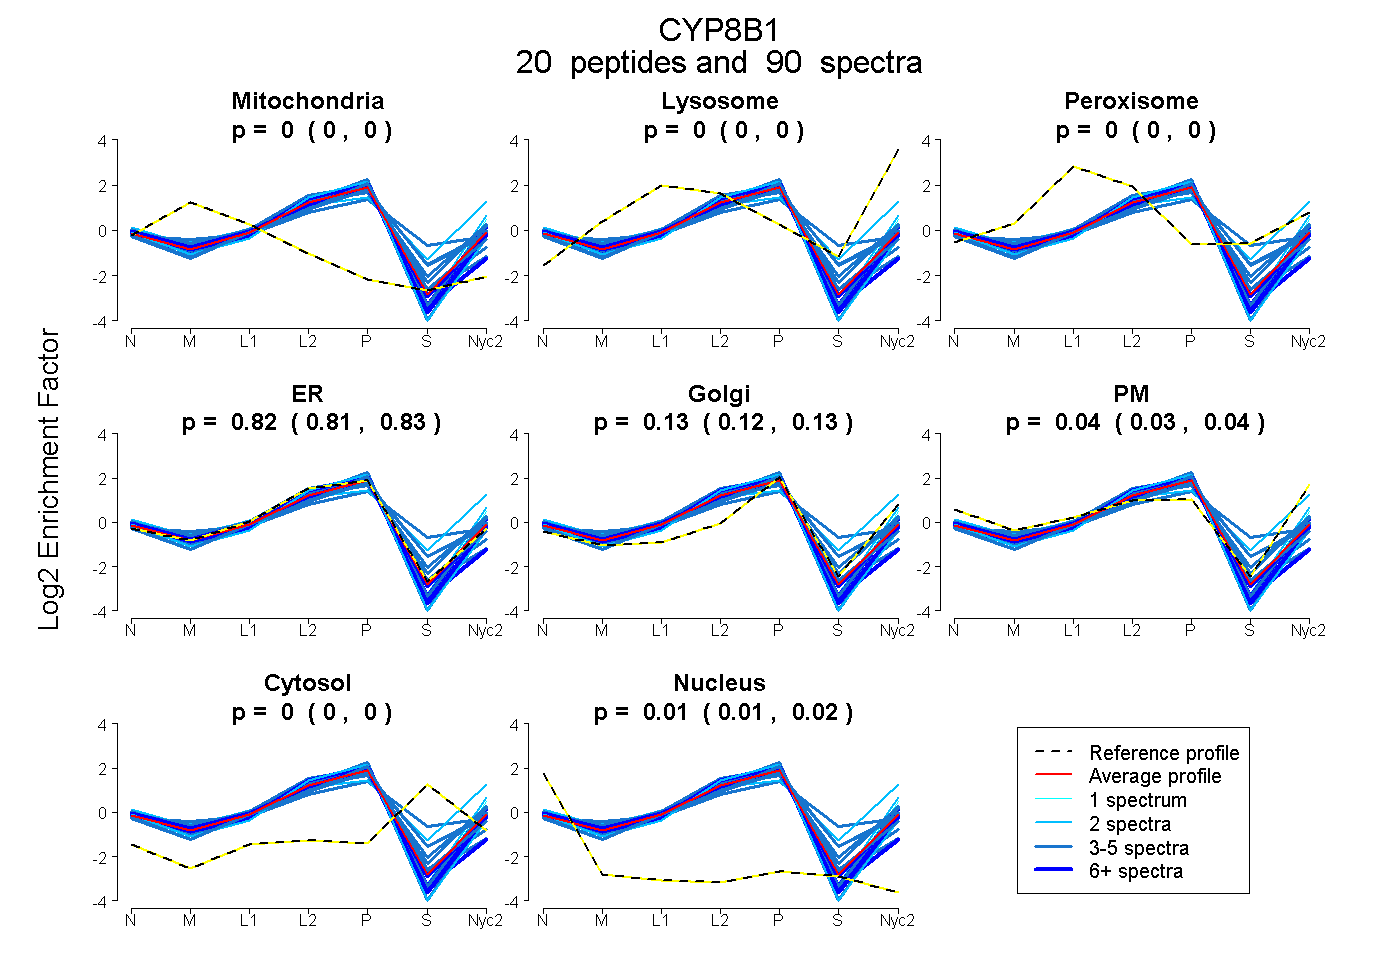
0.000 | 0.000
0.000 | 0.000
0.000 | 0.000
0.809 | 0.828
0.121 | 0.133
0.031 | 0.045
0.000 | 0.000
0.013 | 0.016
8peptides
spectra
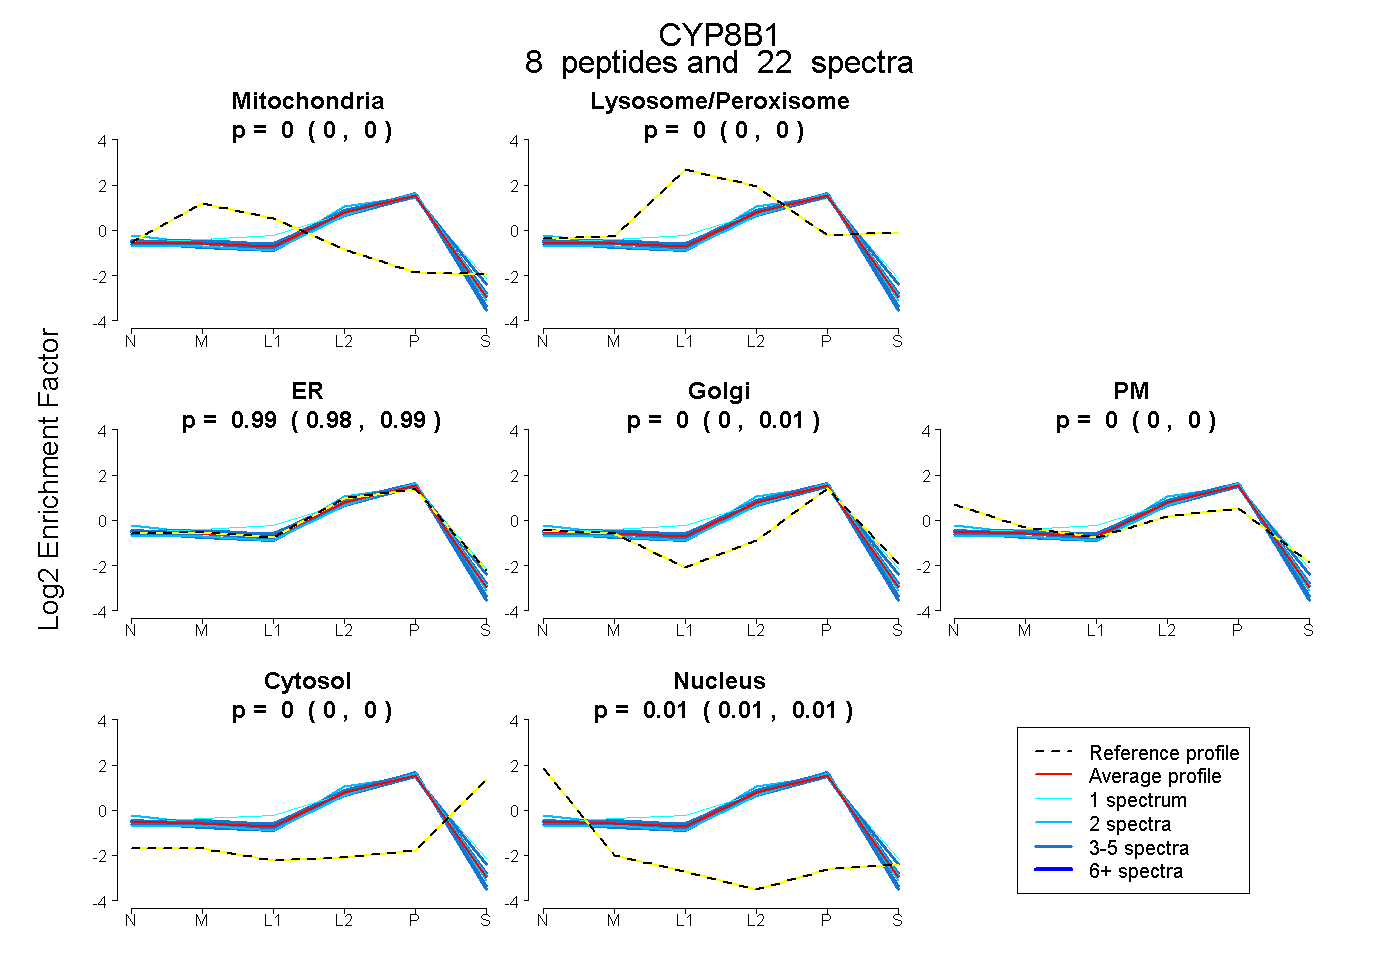
0.000 | 0.000
0.000 | 0.000
0.979 | 0.993
0.000 | 0.011
0.000 | 0.000
0.000 | 0.000
0.006 | 0.011
20peptides
spectra
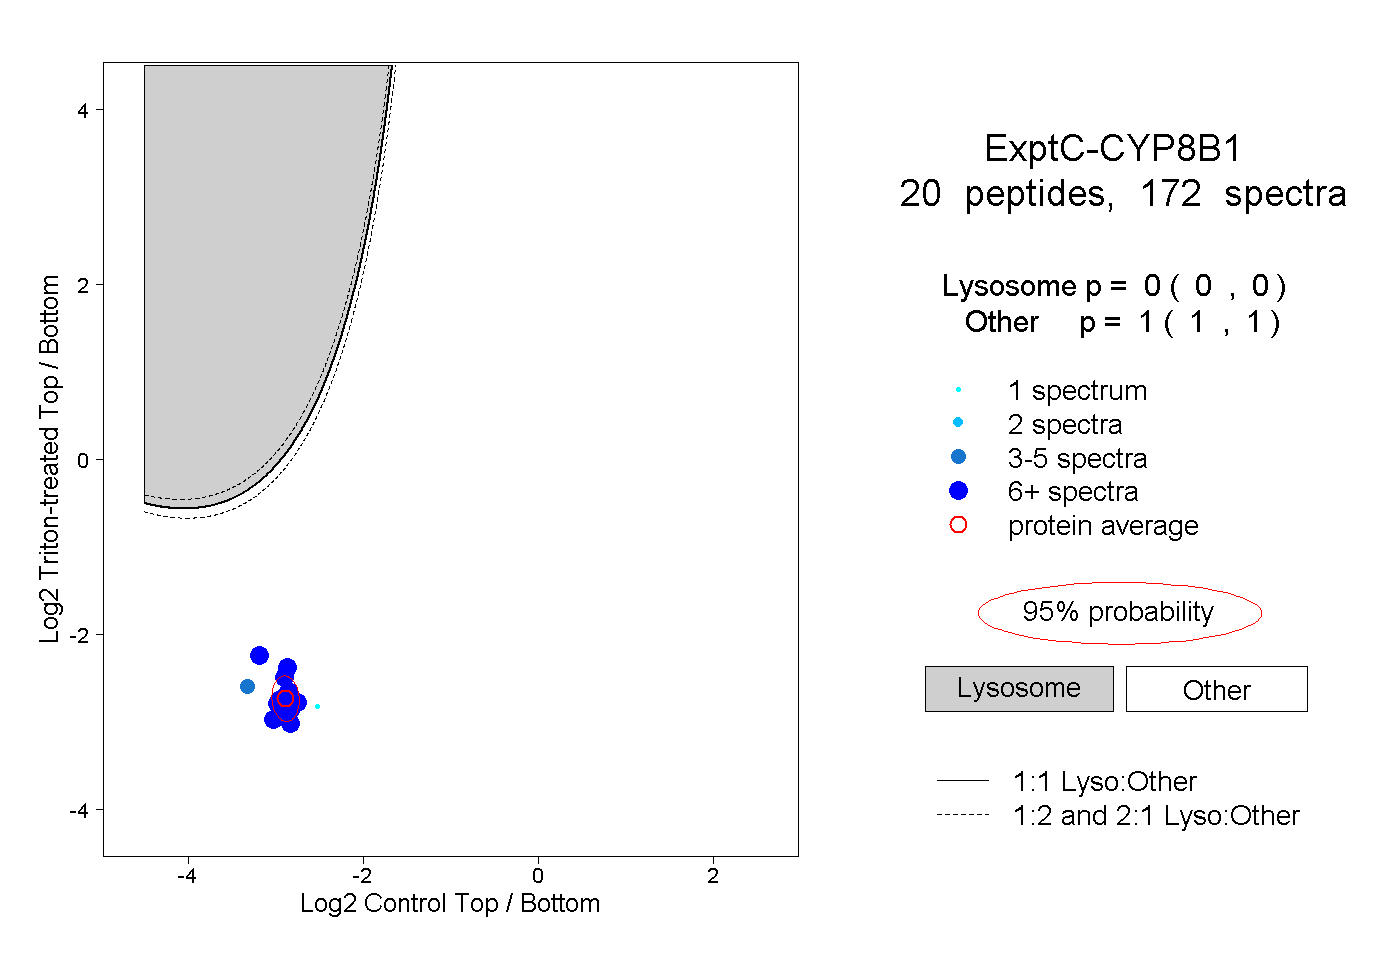
0.000 | 0.000
1.000 | 1.000
5peptides
spectra
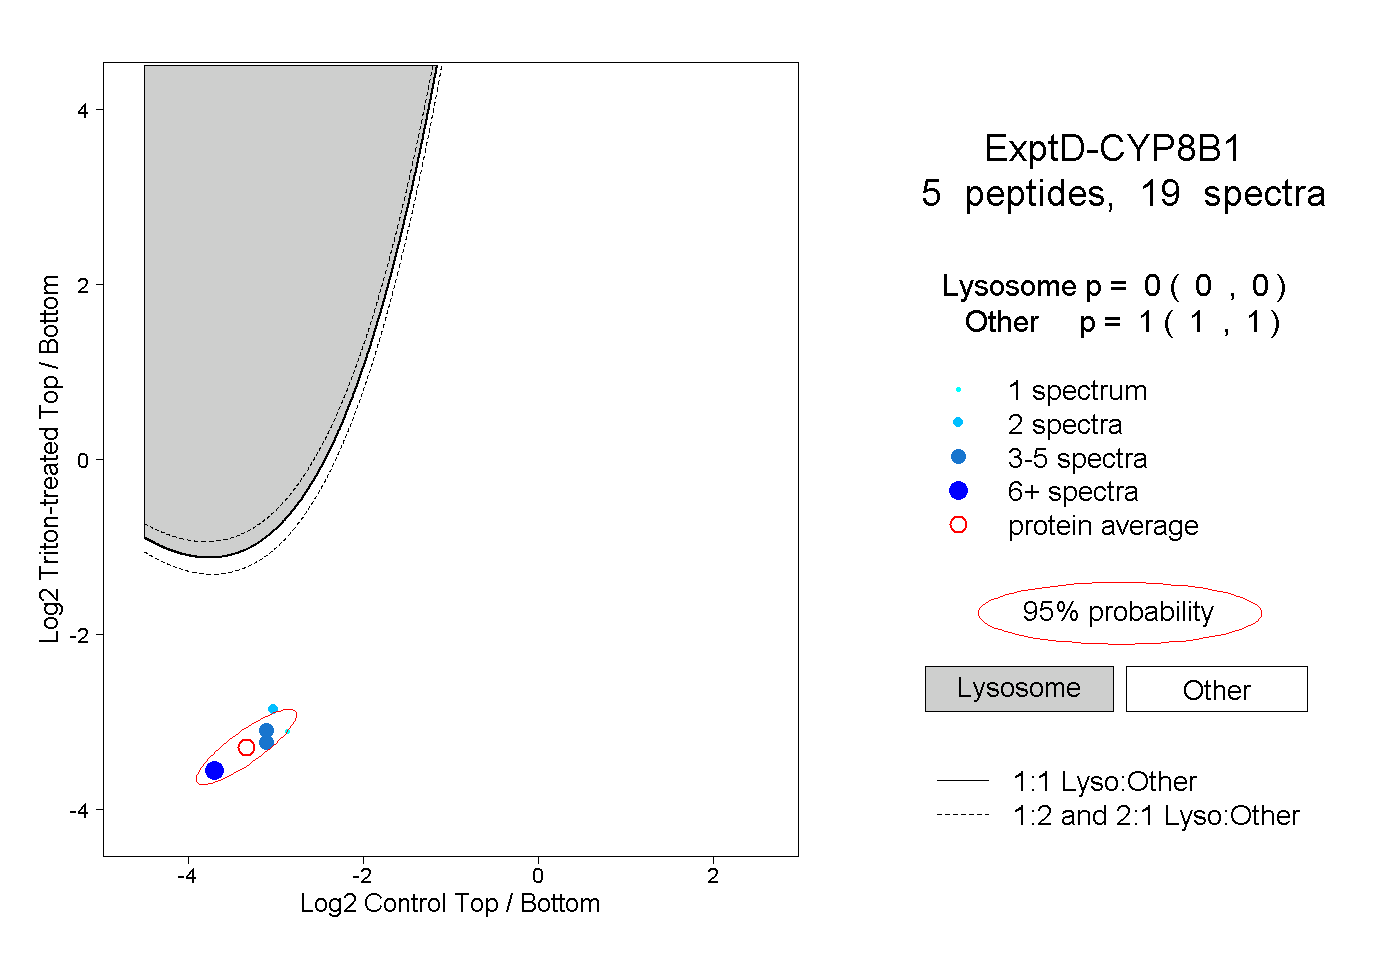
0.000 | 0.000
1.000 | 1.000