CYP8B1
[ENSRNOP00000026355]
Main page
| | | Plot |
Mito |
Lyso |
|
Perox |
ER |
Golgi |
PM |
Cytosol |
Nucleus |
|
| Expt A |
 20
20
peptides |
90
spectra |
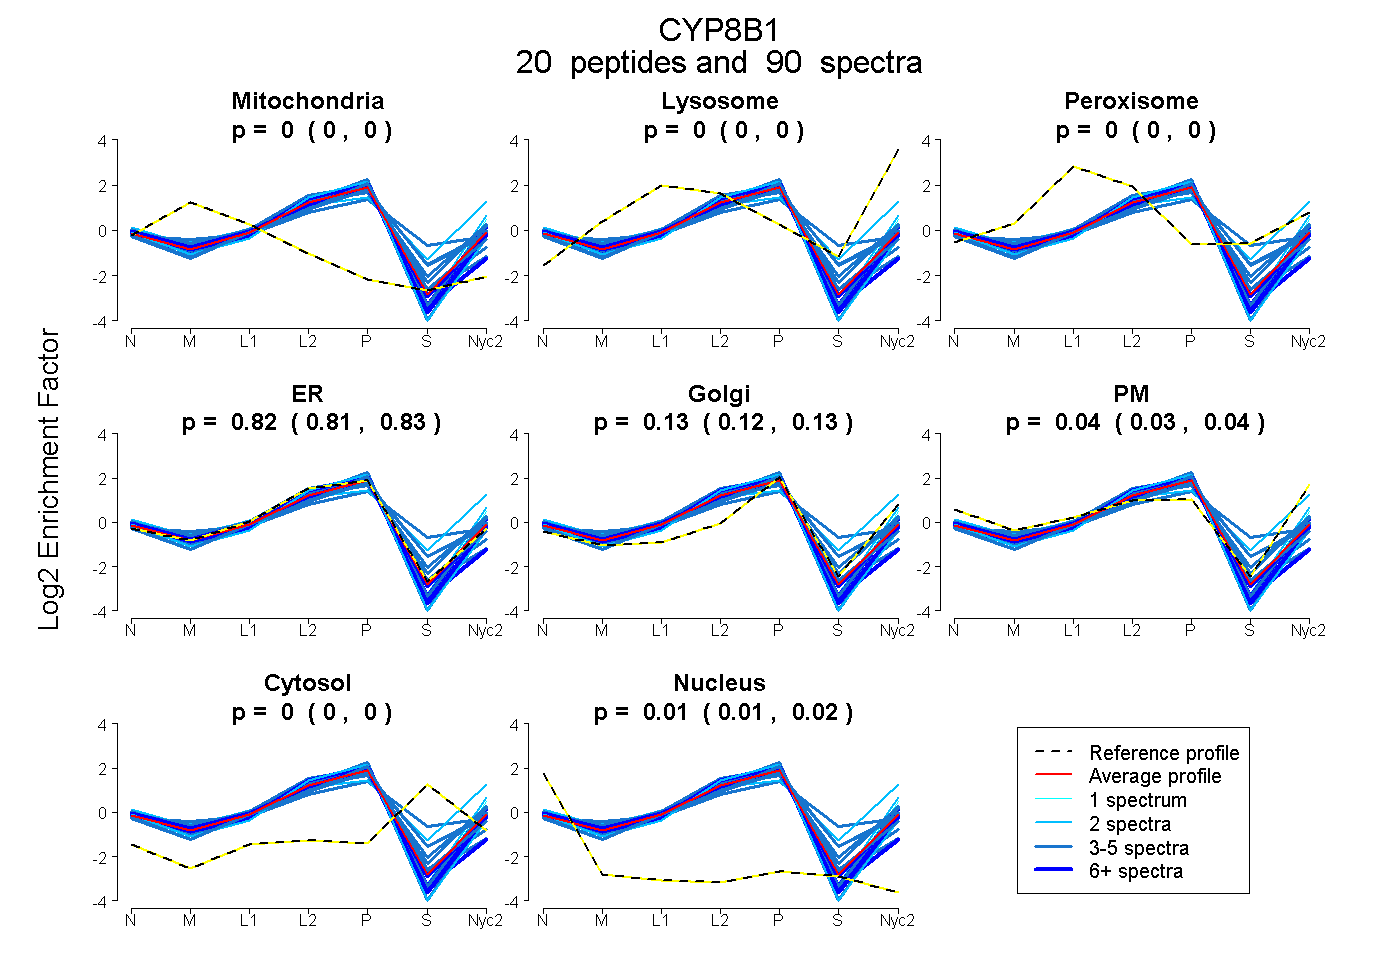 |
0.000
0.000 | 0.000 |
0.000
0.000 | 0.000 |
|
0.000
0.000 | 0.000 |
0.819
0.809 | 0.828 |
0.128
0.121 | 0.133 |
0.038
0.031 | 0.045 |
0.000
0.000 | 0.000 |
0.015
0.013 | 0.016 |
|
| | | Plot |
Mito |
|
Lyso or Perox |
|
ER |
Golgi |
PM |
Cytosol |
Nucleus |
|
| Expt B |
8
peptides |
22
spectra |
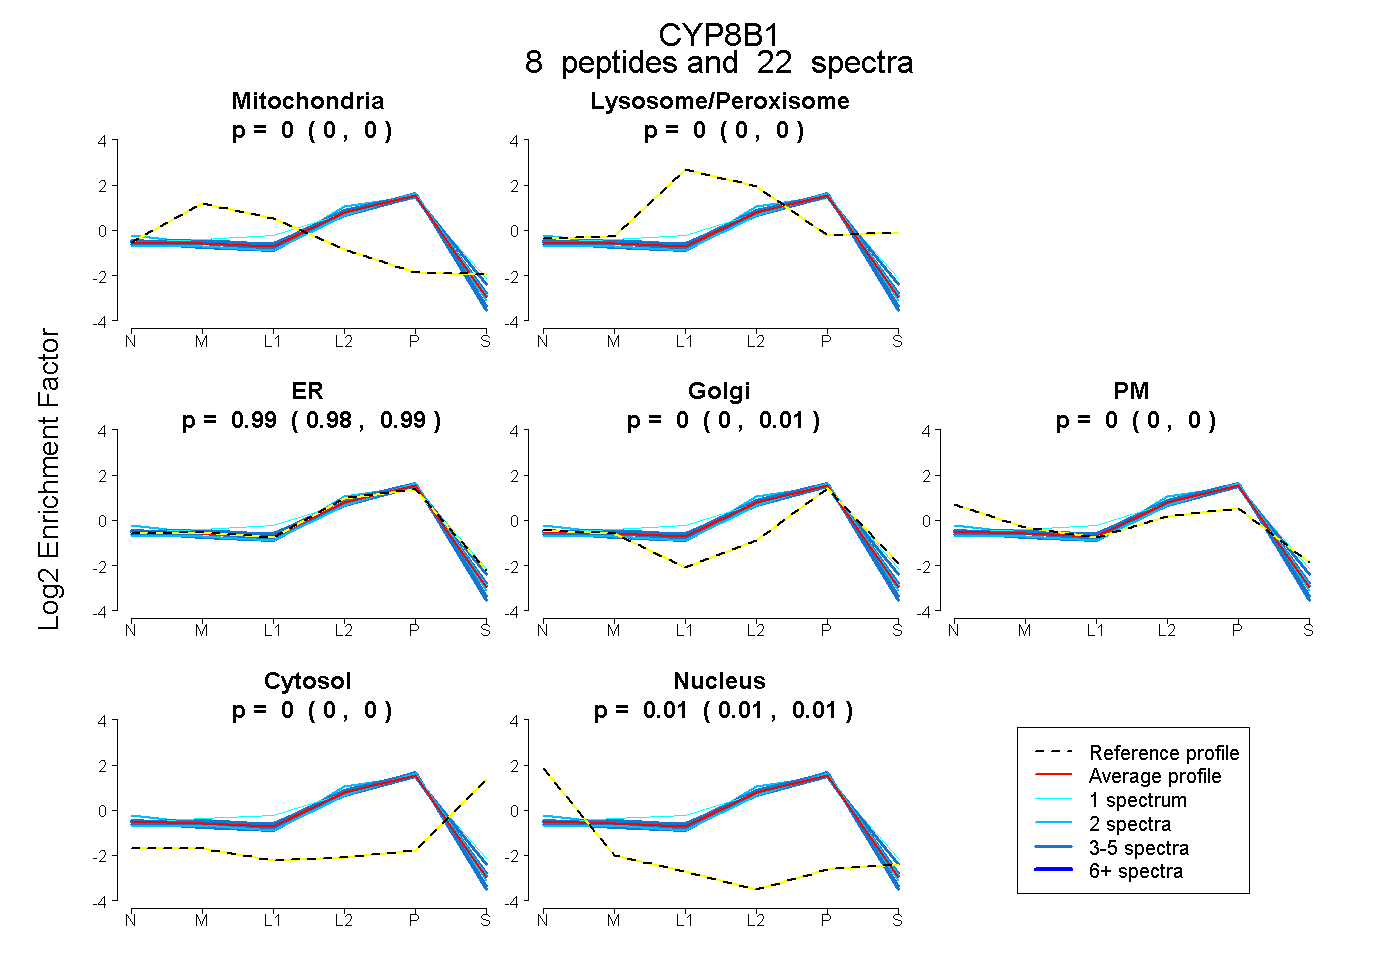 |
0.000
0.000 | 0.000 |
|
0.000
0.000 | 0.000 |
|
0.991
0.979 | 0.993 |
0.000
0.000 | 0.011 |
0.000
0.000 | 0.000 |
0.000
0.000 | 0.000 |
0.009
0.006 | 0.011 |
|
| 3 spectra, FLNPDGTR |
0.000 |
|
0.000 |
|
0.993 |
0.000 |
0.000 |
0.000 |
0.007 |
|
| 2 spectra, VVQEDYVLK |
0.000 |
|
0.000 |
|
0.883 |
0.117 |
0.000 |
0.000 |
0.000 |
|
| 2 spectra, AGFLSLFGCTK |
0.000 |
|
0.000 |
|
0.990 |
0.000 |
0.000 |
0.000 |
0.010 |
|
| 4 spectra, LCATPTLLR |
0.000 |
|
0.000 |
|
0.990 |
0.000 |
0.000 |
0.000 |
0.010 |
|
| 3 spectra, VLGEAR |
0.000 |
|
0.000 |
|
0.887 |
0.106 |
0.005 |
0.000 |
0.002 |
|
| 3 spectra, FDLLFPR |
0.000 |
|
0.000 |
|
1.000 |
0.000 |
0.000 |
0.000 |
0.000 |
|
| 1 spectrum, RPWEPPLDK |
0.018 |
|
0.090 |
|
0.843 |
0.049 |
0.000 |
0.000 |
0.000 |
|
| 4 spectra, VLDFVTYAR |
0.000 |
|
0.000 |
|
0.963 |
0.023 |
0.000 |
0.000 |
0.014 |
|
| | | Plot |
|
Lyso |
|
|
|
|
|
|
|
Other |
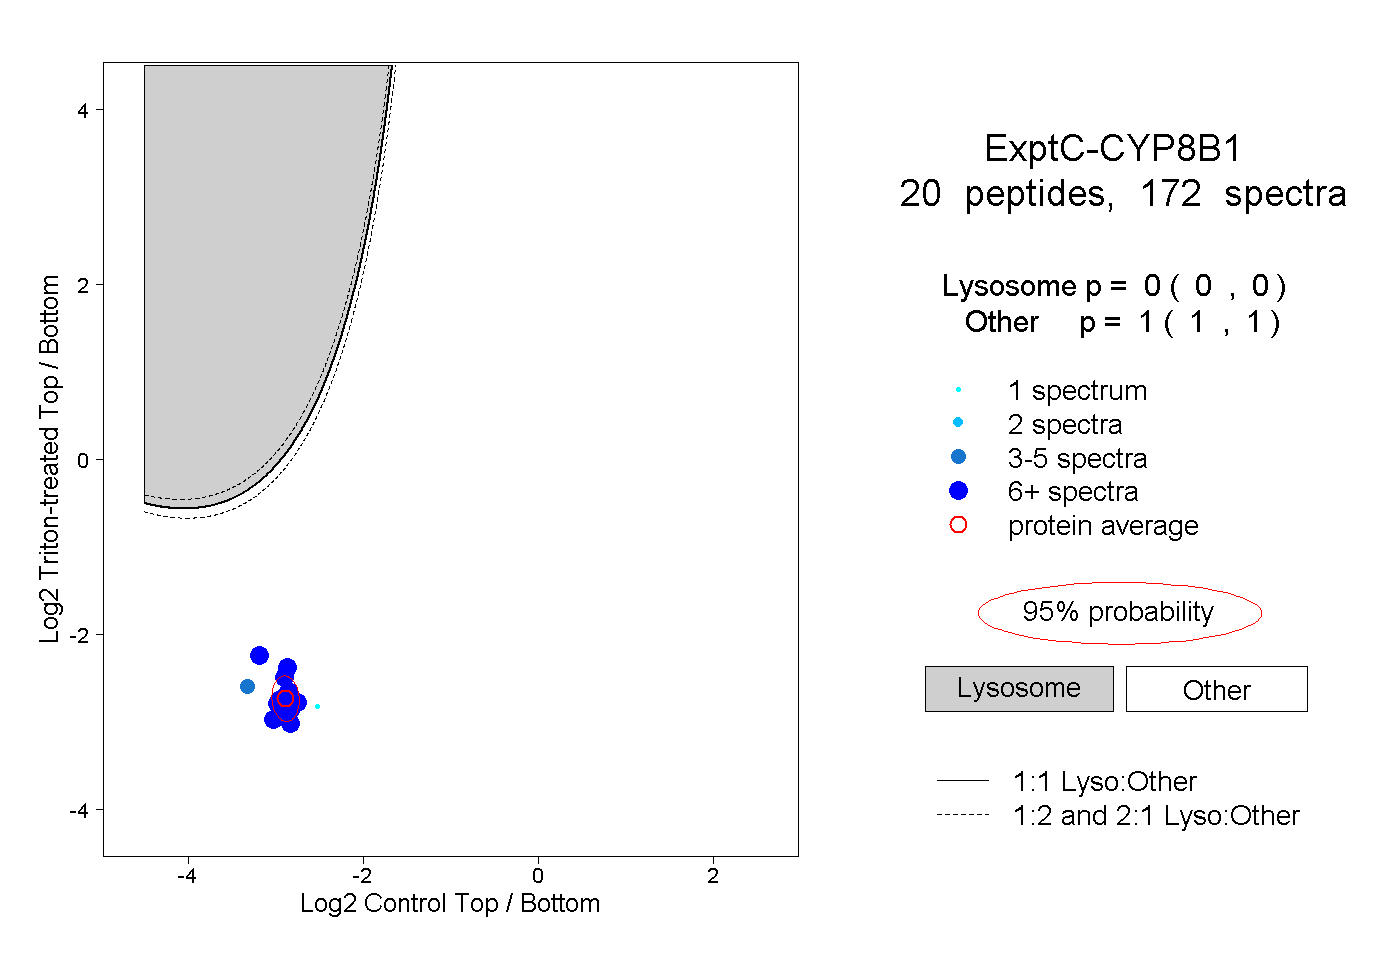
| Expt C |
20
peptides |
172
spectra |
 |
|
0.000
0.000 | 0.000 |
|
|
|
|
|
|
|
1.000
1.000 | 1.000 |
| | | Plot |
|
Lyso |
|
|
|
|
|
|
|
Other |
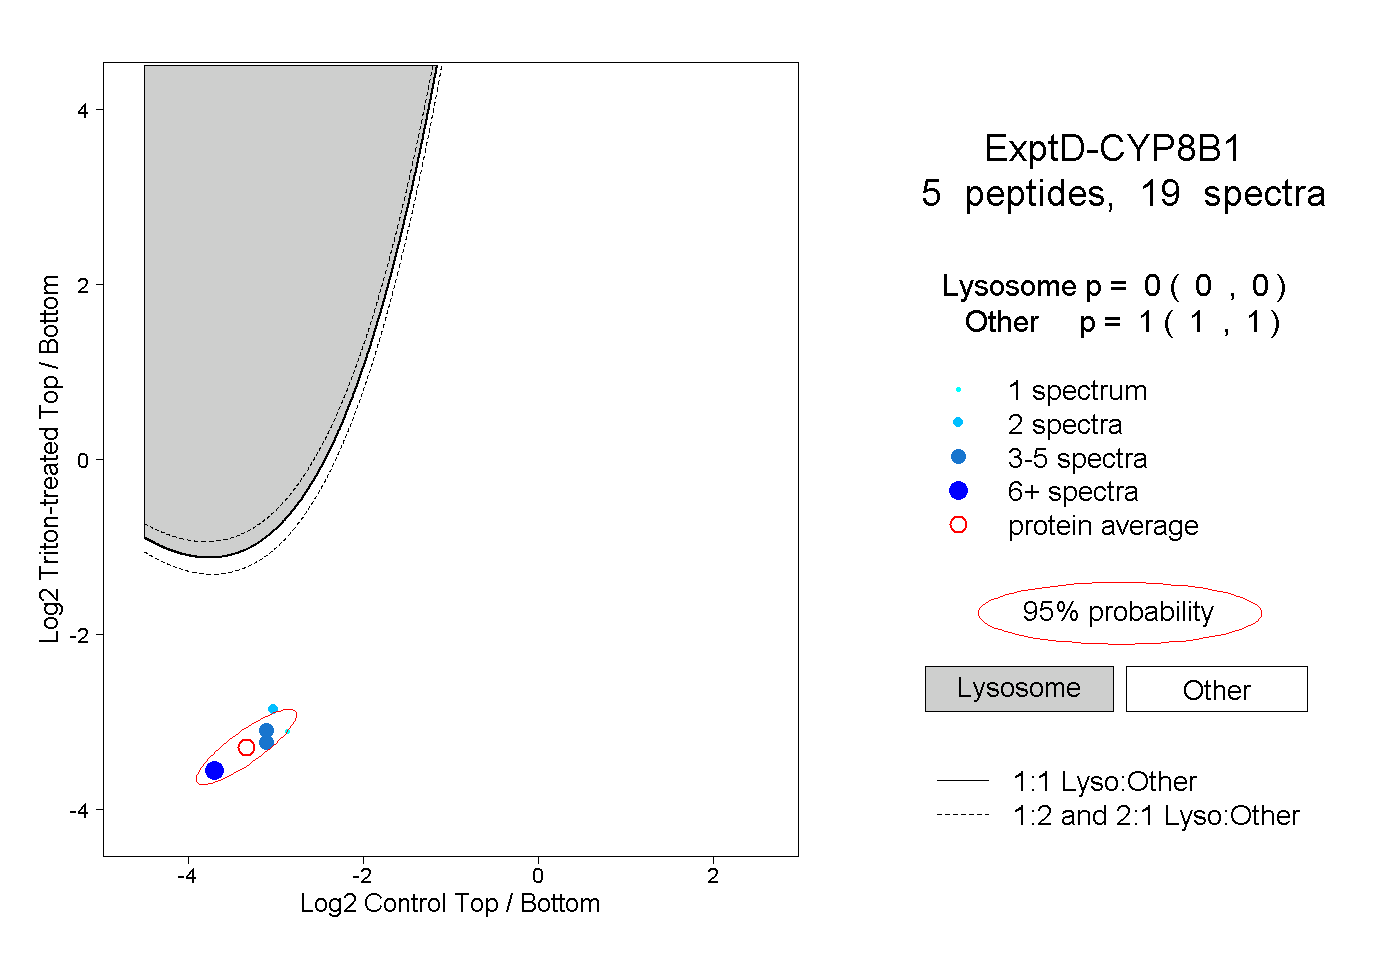
| Expt D |
5
peptides |
19
spectra |
 |
|
0.000
0.000 | 0.000 |
|
|
|
|
|
|
|
1.000
1.000 | 1.000 |