 20
20peptides
spectra
0.000 | 0.000
0.000 | 0.000
0.000 | 0.000
0.809 | 0.828
0.121 | 0.133
0.031 | 0.045
0.000 | 0.000
0.013 | 0.016
| Plot | Mito | Lyso | Perox | ER | Golgi | PM | Cytosol | Nucleus | |||||
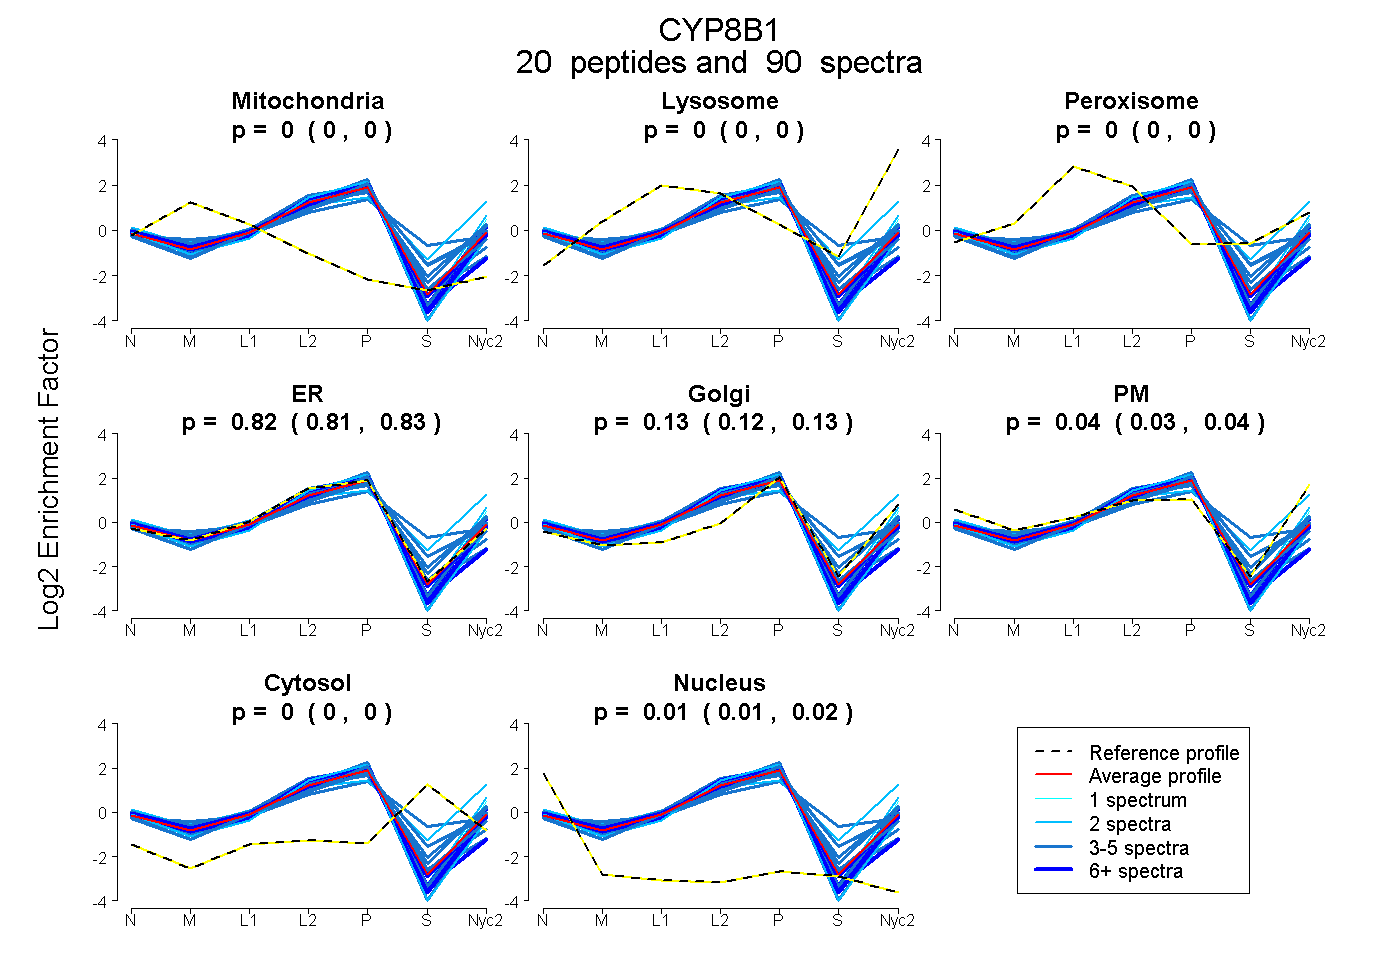
| Expt A |
20 peptides |
90 spectra |
|
0.000 0.000 | 0.000 |
0.000 0.000 | 0.000 |
0.000 0.000 | 0.000 |
0.819 0.809 | 0.828 |
0.128 0.121 | 0.133 |
0.038 0.031 | 0.045 |
0.000 0.000 | 0.000 |
0.015 0.013 | 0.016 |
| 3 spectra, VVQEDYVLK | 0.000 | 0.000 | 0.000 | 0.781 | 0.179 | 0.000 | 0.000 | 0.040 | ||
| 4 spectra, AGFLSLFGCTK | 0.039 | 0.000 | 0.000 | 0.895 | 0.000 | 0.000 | 0.000 | 0.066 | ||
| 10 spectra, LCATPTLLR | 0.000 | 0.000 | 0.000 | 0.921 | 0.000 | 0.000 | 0.000 | 0.079 | ||
| 5 spectra, CTPVLDSVMEETLR | 0.000 | 0.000 | 0.000 | 0.941 | 0.000 | 0.000 | 0.000 | 0.059 | ||
| 2 spectra, VLGEAR | 0.000 | 0.000 | 0.000 | 0.961 | 0.013 | 0.000 | 0.000 | 0.026 | ||
| 5 spectra, LEAETSFAFTLSALK | 0.000 | 0.000 | 0.115 | 0.641 | 0.146 | 0.000 | 0.098 | 0.000 | ||
| 8 spectra, NMFEFLK | 0.000 | 0.000 | 0.000 | 0.829 | 0.089 | 0.059 | 0.000 | 0.023 | ||
| 5 spectra, FDLLFPR | 0.000 | 0.000 | 0.000 | 0.800 | 0.094 | 0.106 | 0.000 | 0.000 | ||
| 5 spectra, MASGQEYQIR | 0.000 | 0.000 | 0.000 | 0.868 | 0.132 | 0.000 | 0.000 | 0.000 | ||
| 4 spectra, RPWEPPLDK | 0.000 | 0.000 | 0.047 | 0.664 | 0.156 | 0.000 | 0.133 | 0.000 | ||
| 9 spectra, VLDFVTYAR | 0.000 | 0.000 | 0.000 | 0.937 | 0.050 | 0.000 | 0.000 | 0.013 | ||
| 3 spectra, HLMGQGLEDLNR | 0.000 | 0.000 | 0.065 | 0.597 | 0.120 | 0.180 | 0.039 | 0.000 | ||
| 5 spectra, LSVEQNLEK | 0.000 | 0.000 | 0.000 | 0.838 | 0.010 | 0.152 | 0.000 | 0.000 | ||
| 7 spectra, HQDAMK | 0.000 | 0.000 | 0.000 | 0.786 | 0.158 | 0.056 | 0.000 | 0.000 | ||
| 1 spectrum, AMLDSLSLVMLGPK | 0.000 | 0.000 | 0.000 | 0.663 | 0.027 | 0.309 | 0.000 | 0.000 | ||
| 2 spectra, FFALSEMK | 0.000 | 0.000 | 0.000 | 0.624 | 0.065 | 0.311 | 0.000 | 0.000 | ||
| 3 spectra, FLNPDGTR | 0.000 | 0.000 | 0.153 | 0.491 | 0.135 | 0.000 | 0.221 | 0.000 | ||
| 3 spectra, DGISNWLGFMLR | 0.000 | 0.000 | 0.000 | 0.868 | 0.132 | 0.000 | 0.000 | 0.000 | ||
| 4 spectra, GFVPWLGHTMAFR | 0.000 | 0.000 | 0.000 | 0.661 | 0.081 | 0.216 | 0.042 | 0.000 | ||
| 2 spectra, GMASSMQDK | 0.000 | 0.130 | 0.000 | 0.222 | 0.064 | 0.477 | 0.107 | 0.000 |
| Plot | Mito | Lyso or Perox | ER | Golgi | PM | Cytosol | Nucleus | ||||||
| Expt B |
8 peptides |
22 spectra |
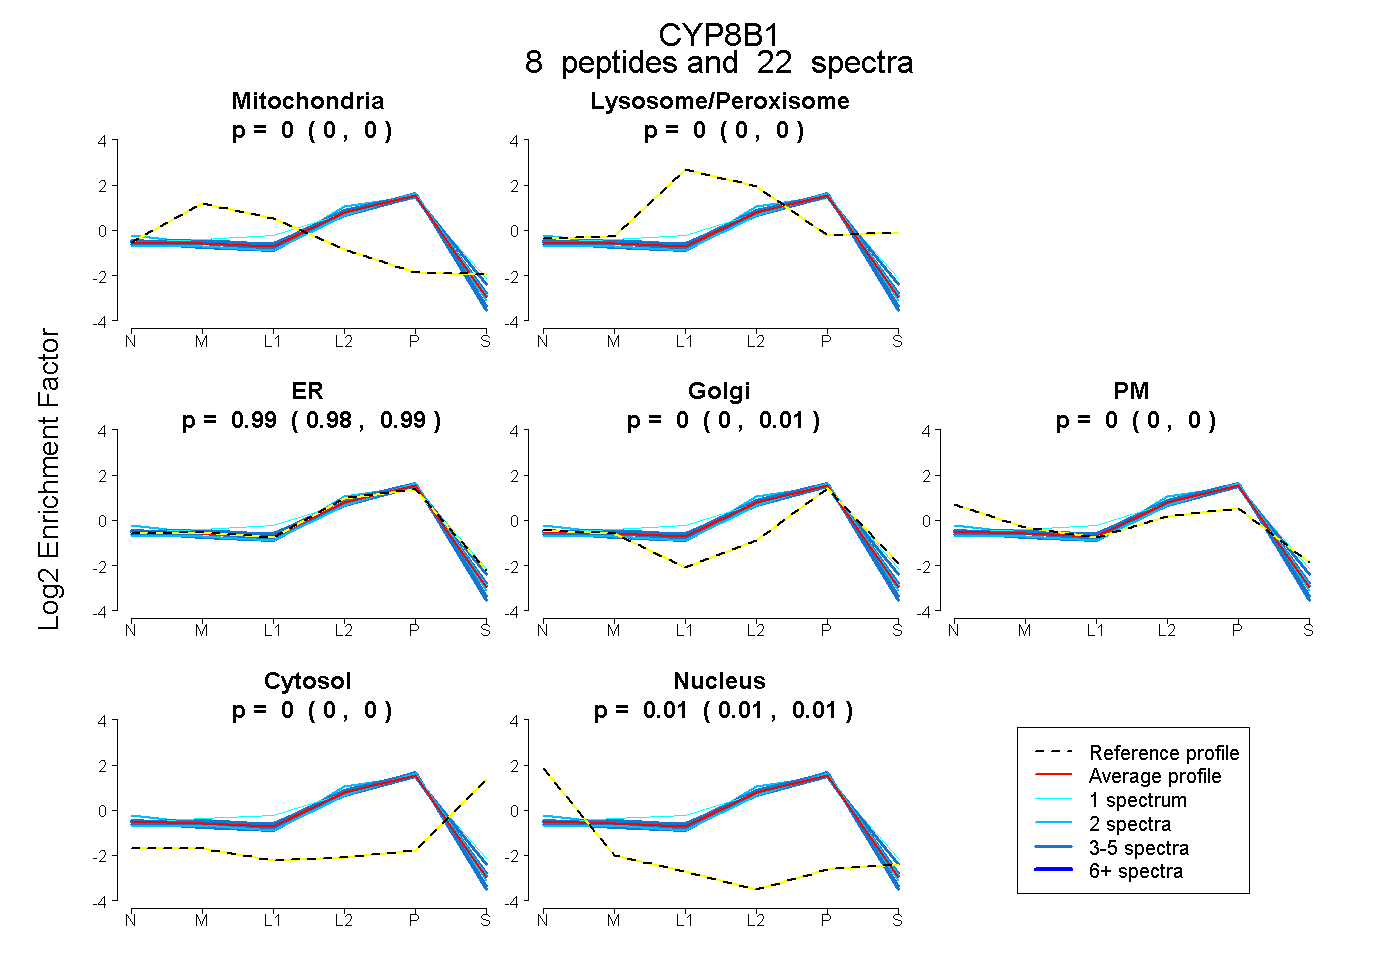 |
0.000 0.000 | 0.000 |
0.000 0.000 | 0.000 |
0.991 0.979 | 0.993 |
0.000 0.000 | 0.011 |
0.000 0.000 | 0.000 |
0.000 0.000 | 0.000 |
0.009 0.006 | 0.011 |
|||
| Plot | Lyso | Other | |||||||||||
| Expt C |
20 peptides |
172 spectra |
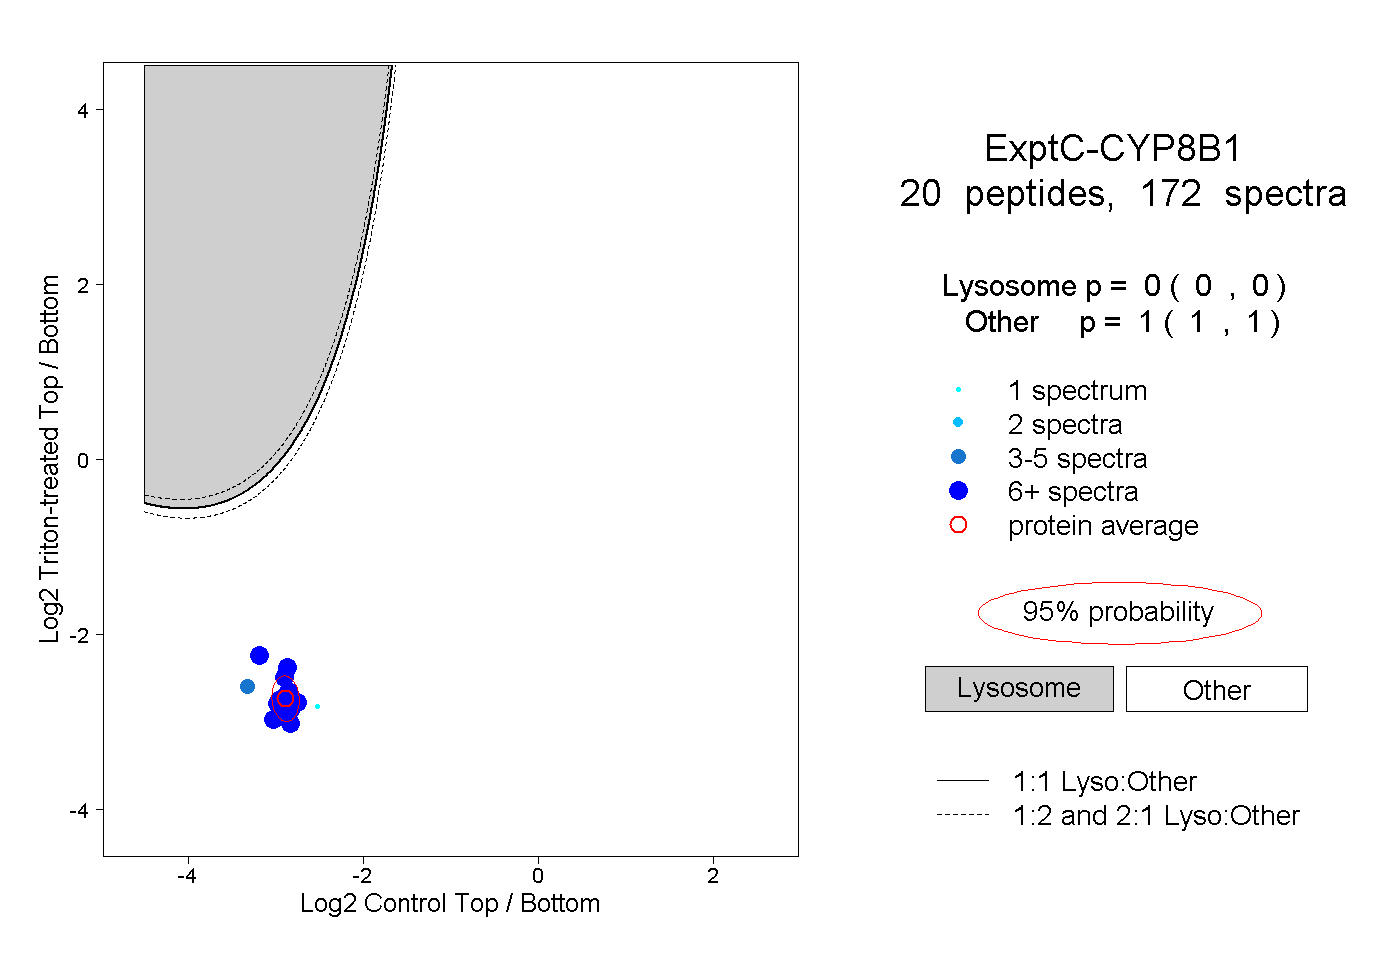 |
0.000 0.000 | 0.000 |
1.000 1.000 | 1.000 |
||||||||
| Plot | Lyso | Other | |||||||||||
| Expt D |
5 peptides |
19 spectra |
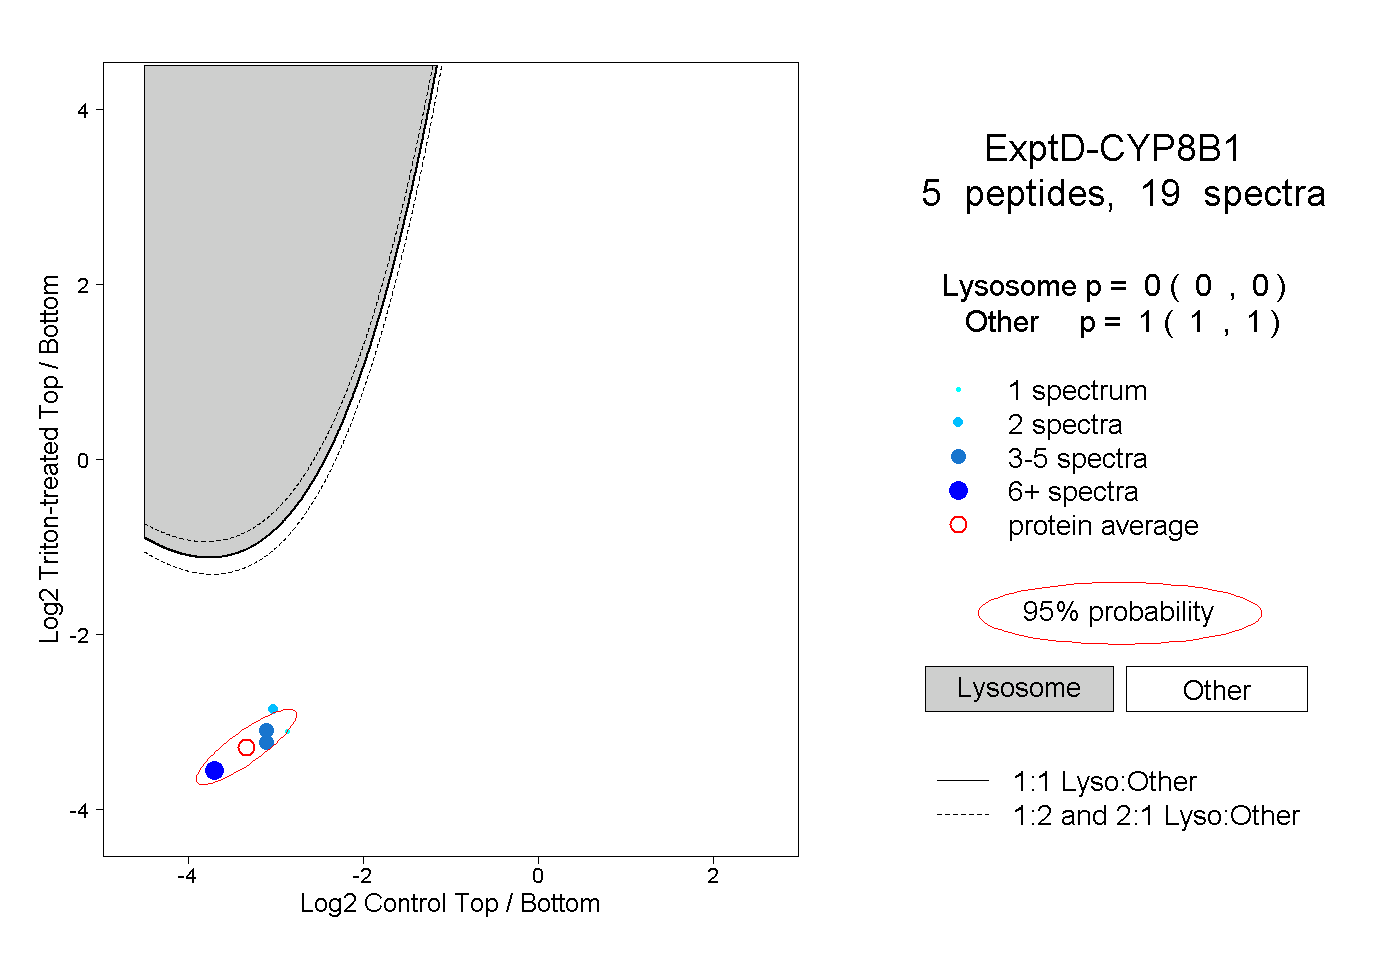 |
0.000 0.000 | 0.000 |
1.000 1.000 | 1.000 |