 5
5peptides
spectra
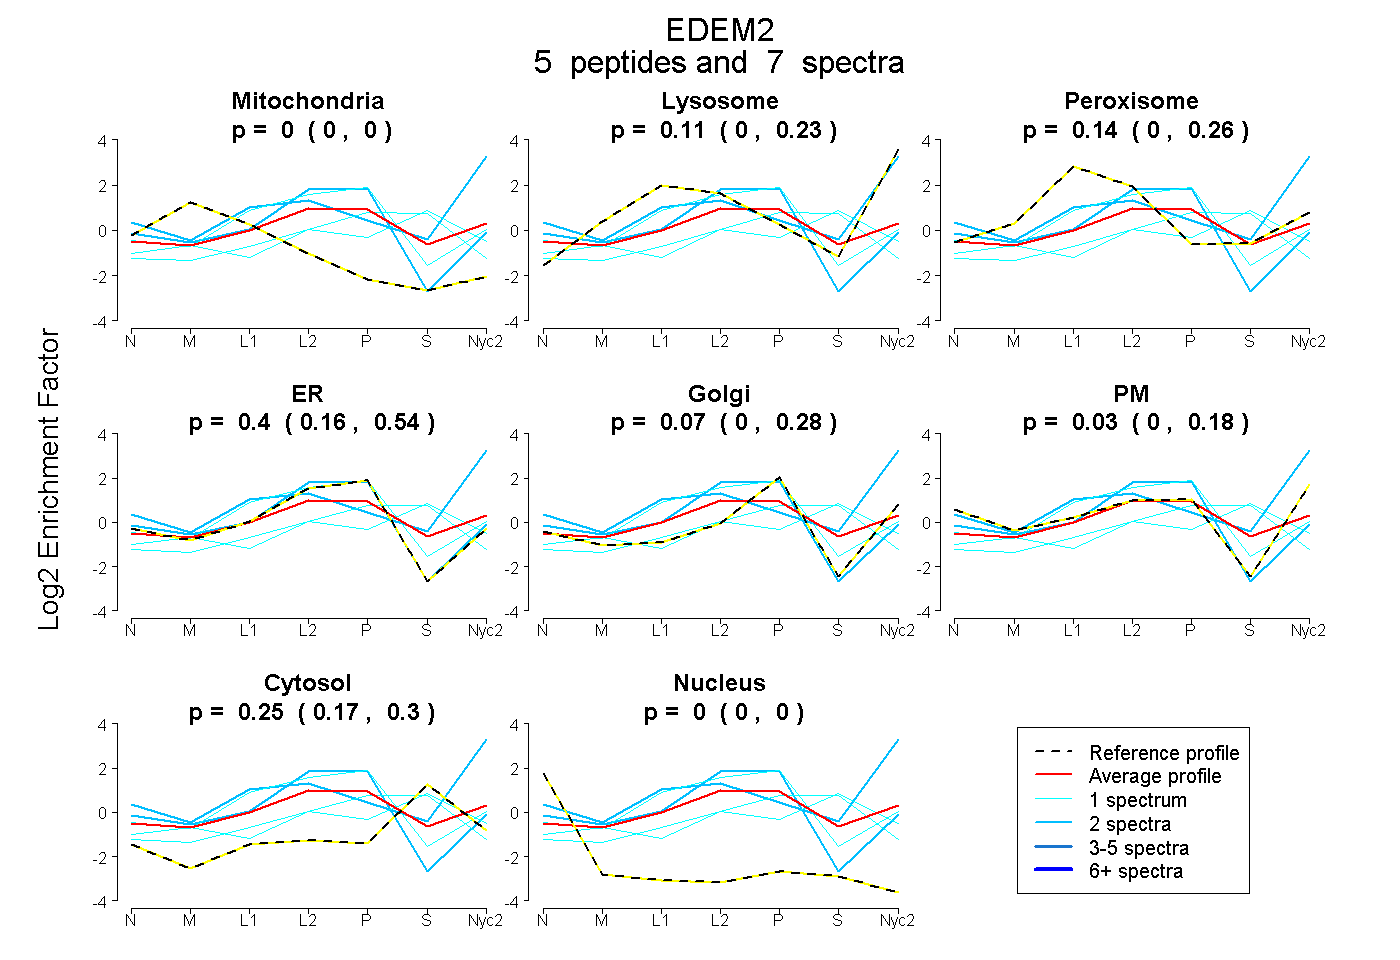
0.000 | 0.000
0.000 | 0.231
0.000 | 0.262
0.164 | 0.535
0.000 | 0.279
0.000 | 0.182
0.174 | 0.304
0.000 | 0.000
3peptides
spectra
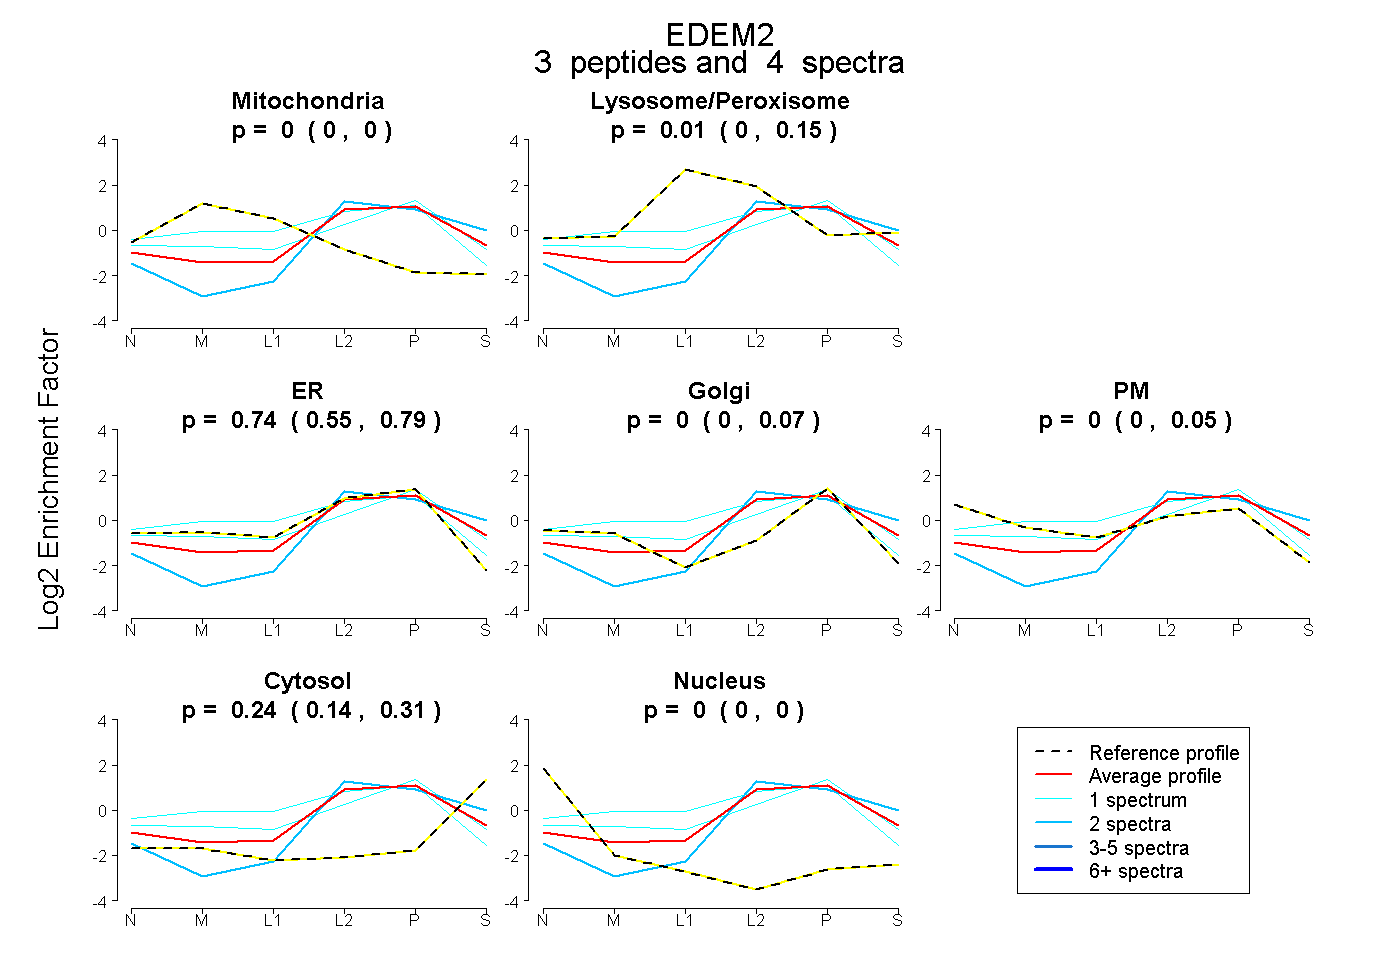
0.000 | 0.000
0.000 | 0.148
0.546 | 0.792
0.000 | 0.074
0.000 | 0.047
0.141 | 0.310
0.000 | 0.000
3peptides
spectra
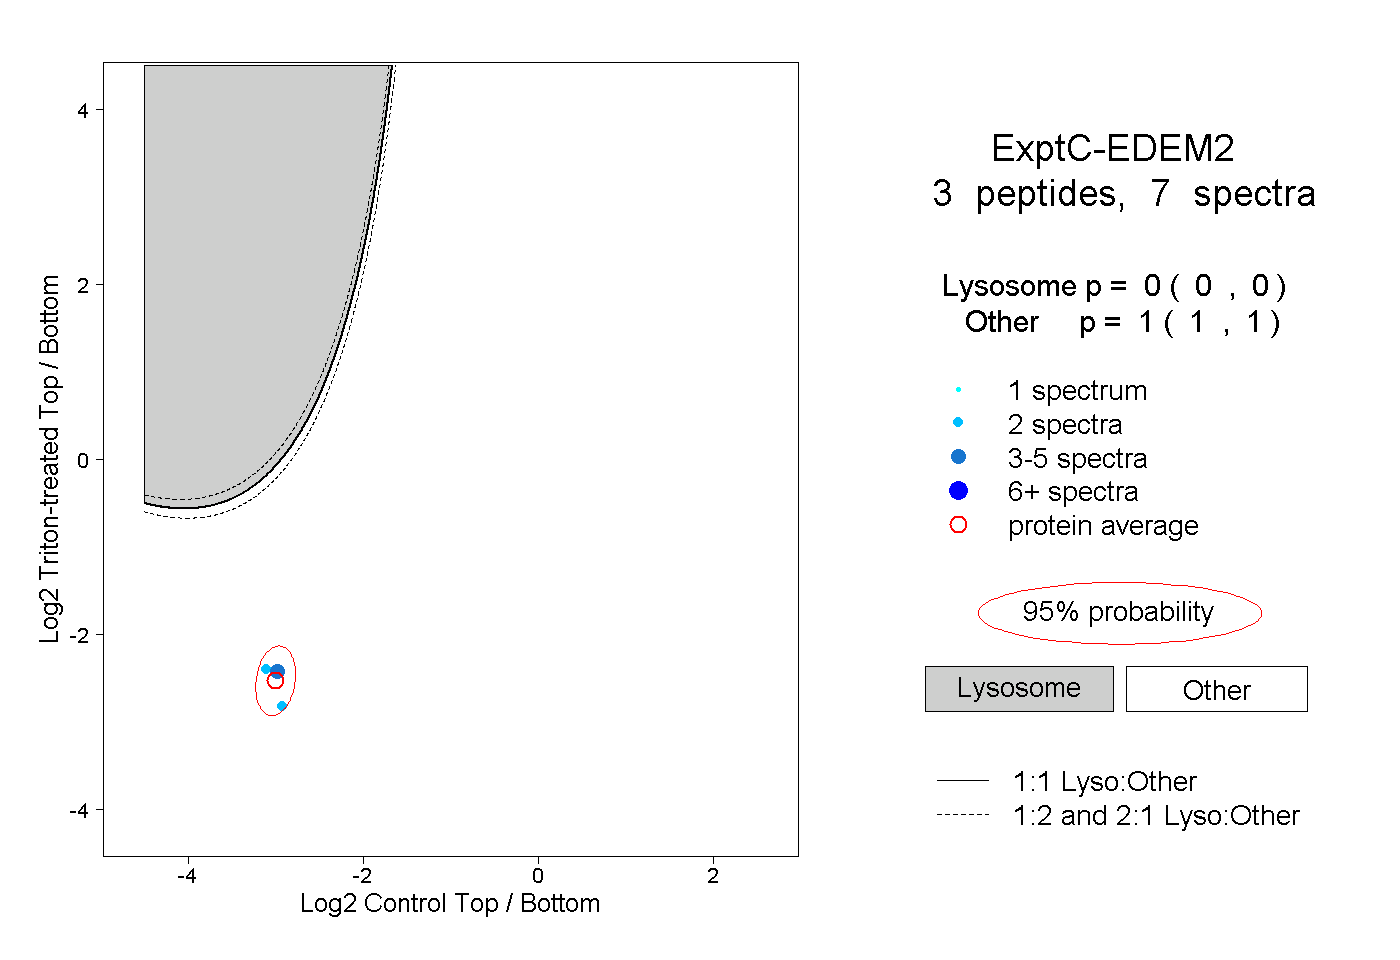
0.000 | 0.000
1.000 | 1.000