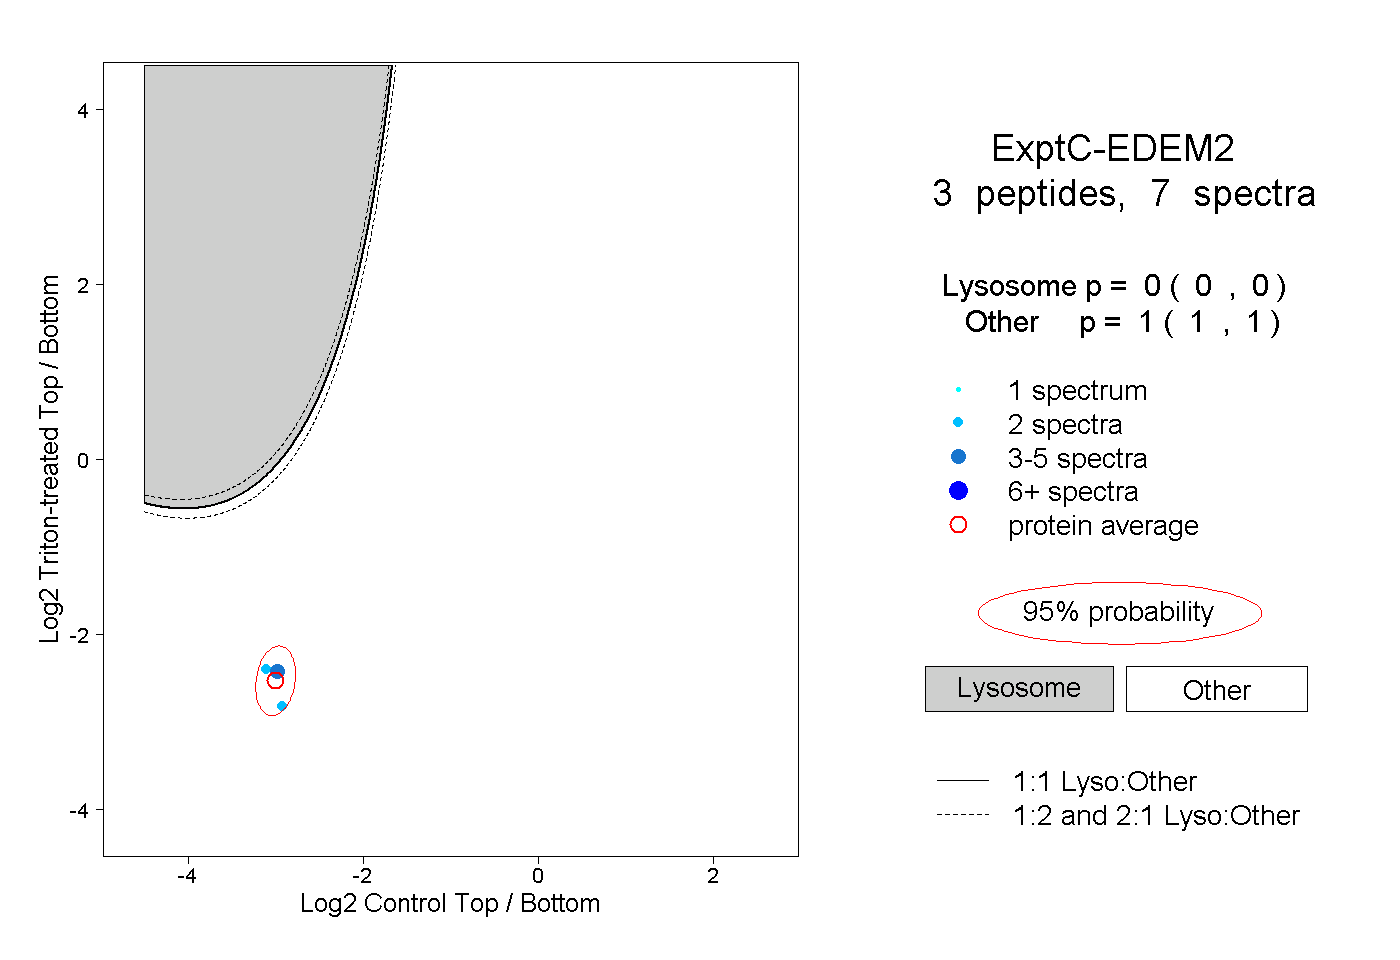
EDEM2
[ENSRNOP00000026120]
Main page
| | | Plot |
Mito |
Lyso |
|
Perox |
ER |
Golgi |
PM |
Cytosol |
Nucleus |
|
| Expt A |
 5
5
peptides |
7
spectra |
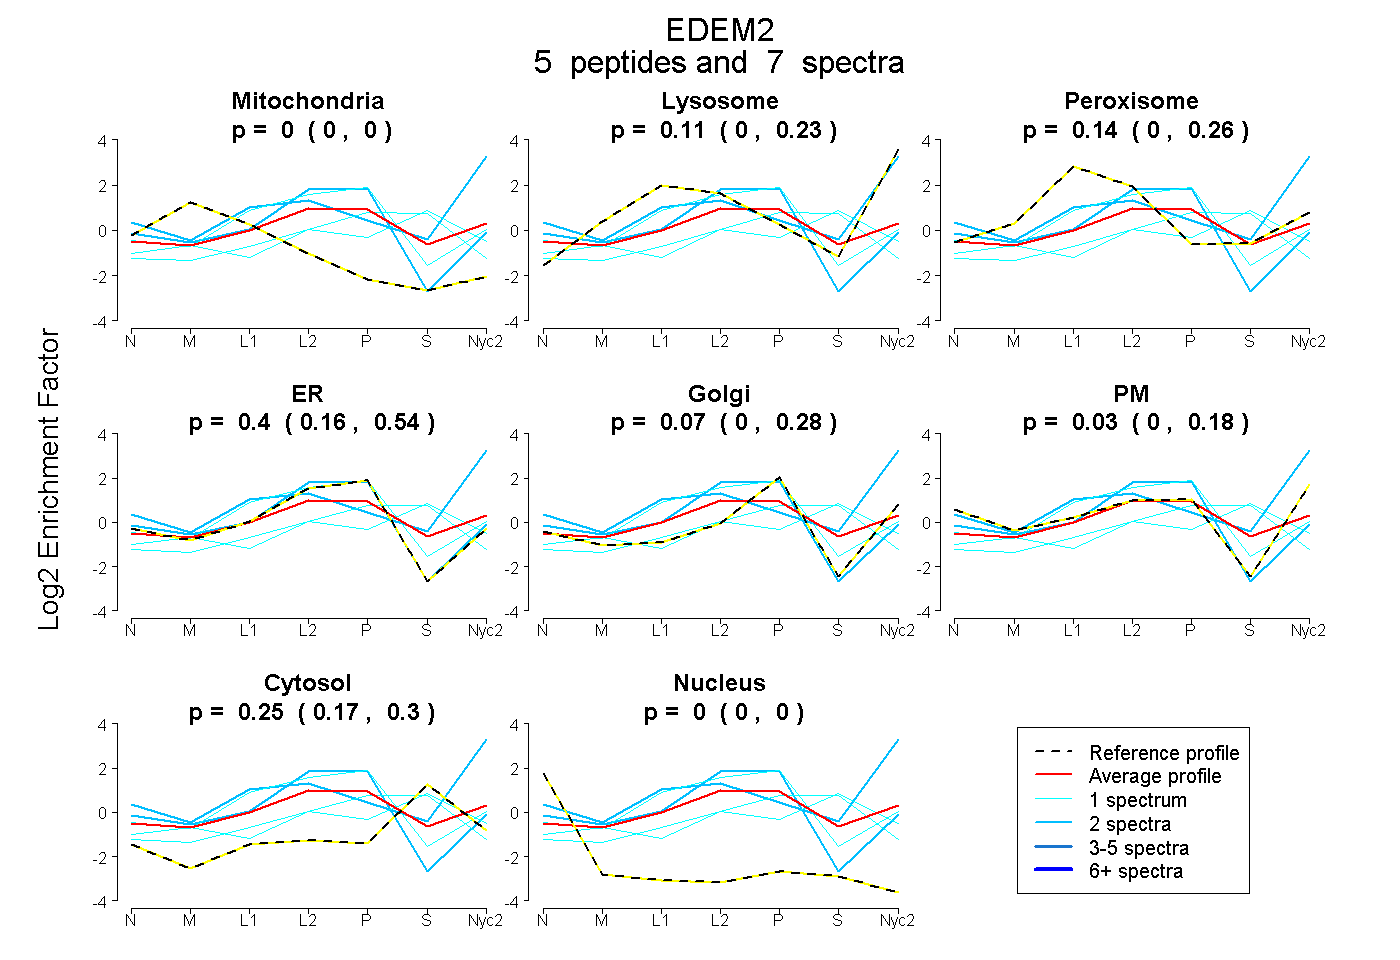 |
0.000
0.000 | 0.000 |
0.110
0.000 | 0.231 |
|
0.139
0.000 | 0.262 |
0.403
0.164 | 0.535 |
0.072
0.000 | 0.279 |
0.028
0.000 | 0.182 |
0.247
0.174 | 0.304 |
0.000
0.000 | 0.000 |
|
| | | Plot |
Mito |
|
Lyso or Perox |
|
ER |
Golgi |
PM |
Cytosol |
Nucleus |
|
| Expt B |
3
peptides |
4
spectra |
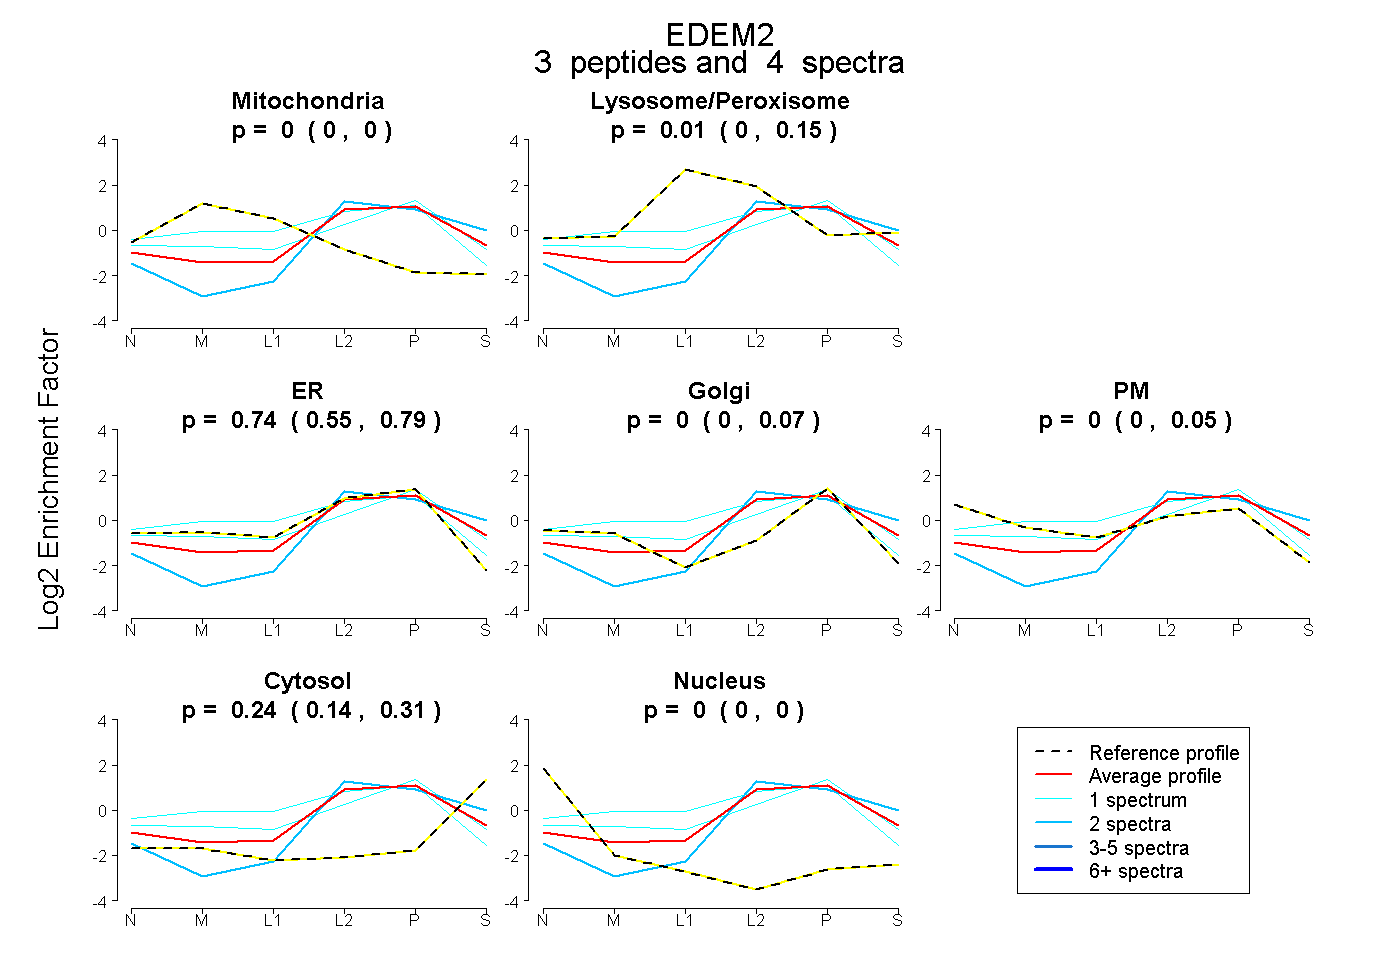 |
0.000
0.000 | 0.000 |
|
0.013
0.000 | 0.148 |
|
0.745
0.546 | 0.792 |
0.000
0.000 | 0.074 |
0.000
0.000 | 0.047 |
0.242
0.141 | 0.310 |
0.000
0.000 | 0.000 |
|
| 1 spectrum, ATGDPTLLELGR |
0.000 |
|
0.201 |
|
0.283 |
0.428 |
0.000 |
0.088 |
0.000 |
|
| 2 spectra, MAEEAAR |
0.000 |
|
0.000 |
|
0.614 |
0.000 |
0.000 |
0.386 |
0.000 |
|
| 1 spectrum, DAVESIEK |
0.027 |
|
0.237 |
|
0.534 |
0.155 |
0.047 |
0.000 |
0.000 |
|
| | | Plot |
|
Lyso |
|
|
|
|
|
|
|
Other |
| Expt C |
3
peptides |
7
spectra |
 |
|
0.000
0.000 | 0.000 |
|
|
|
|
|
|
|
1.000
1.000 | 1.000 |