 5
5peptides
spectra
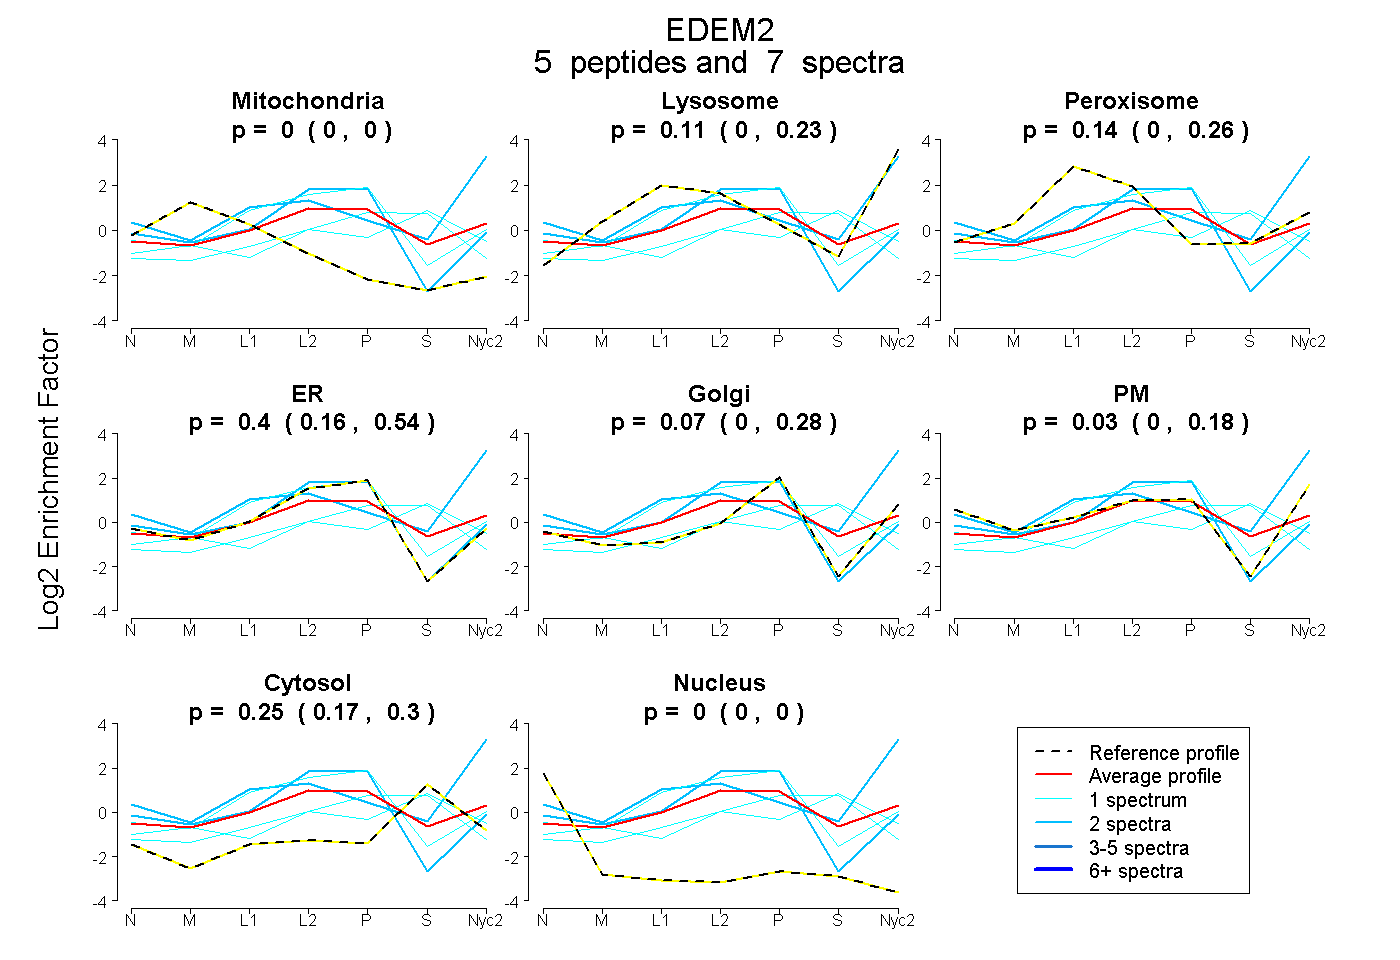
0.000 | 0.000
0.000 | 0.231
0.000 | 0.262
0.164 | 0.535
0.000 | 0.279
0.000 | 0.182
0.174 | 0.304
0.000 | 0.000
| Plot | Mito | Lyso | Perox | ER | Golgi | PM | Cytosol | Nucleus | |||||
| Expt A |
5 peptides |
7 spectra |
|
0.000 0.000 | 0.000 |
0.110 0.000 | 0.231 |
0.139 0.000 | 0.262 |
0.403 0.164 | 0.535 |
0.072 0.000 | 0.279 |
0.028 0.000 | 0.182 |
0.247 0.174 | 0.304 |
0.000 0.000 | 0.000 |
| 1 spectrum, VVGGLLSAHLLSK | 0.027 | 0.053 | 0.090 | 0.186 | 0.000 | 0.000 | 0.643 | 0.000 | ||
| 1 spectrum, MESFFLAETVK | 0.000 | 0.000 | 0.020 | 0.374 | 0.000 | 0.000 | 0.606 | 0.000 | ||
| 2 spectra, ATGDPTLLELGR | 0.000 | 0.011 | 0.001 | 0.925 | 0.000 | 0.063 | 0.000 | 0.000 | ||
| 2 spectra, MAEEAAR | 0.000 | 0.567 | 0.000 | 0.000 | 0.000 | 0.348 | 0.085 | 0.000 | ||
| 1 spectrum, VECGFATIK | 0.000 | 0.036 | 0.206 | 0.737 | 0.000 | 0.000 | 0.021 | 0.000 |
| Plot | Mito | Lyso or Perox | ER | Golgi | PM | Cytosol | Nucleus | ||||||
| Expt B |
3 peptides |
4 spectra |
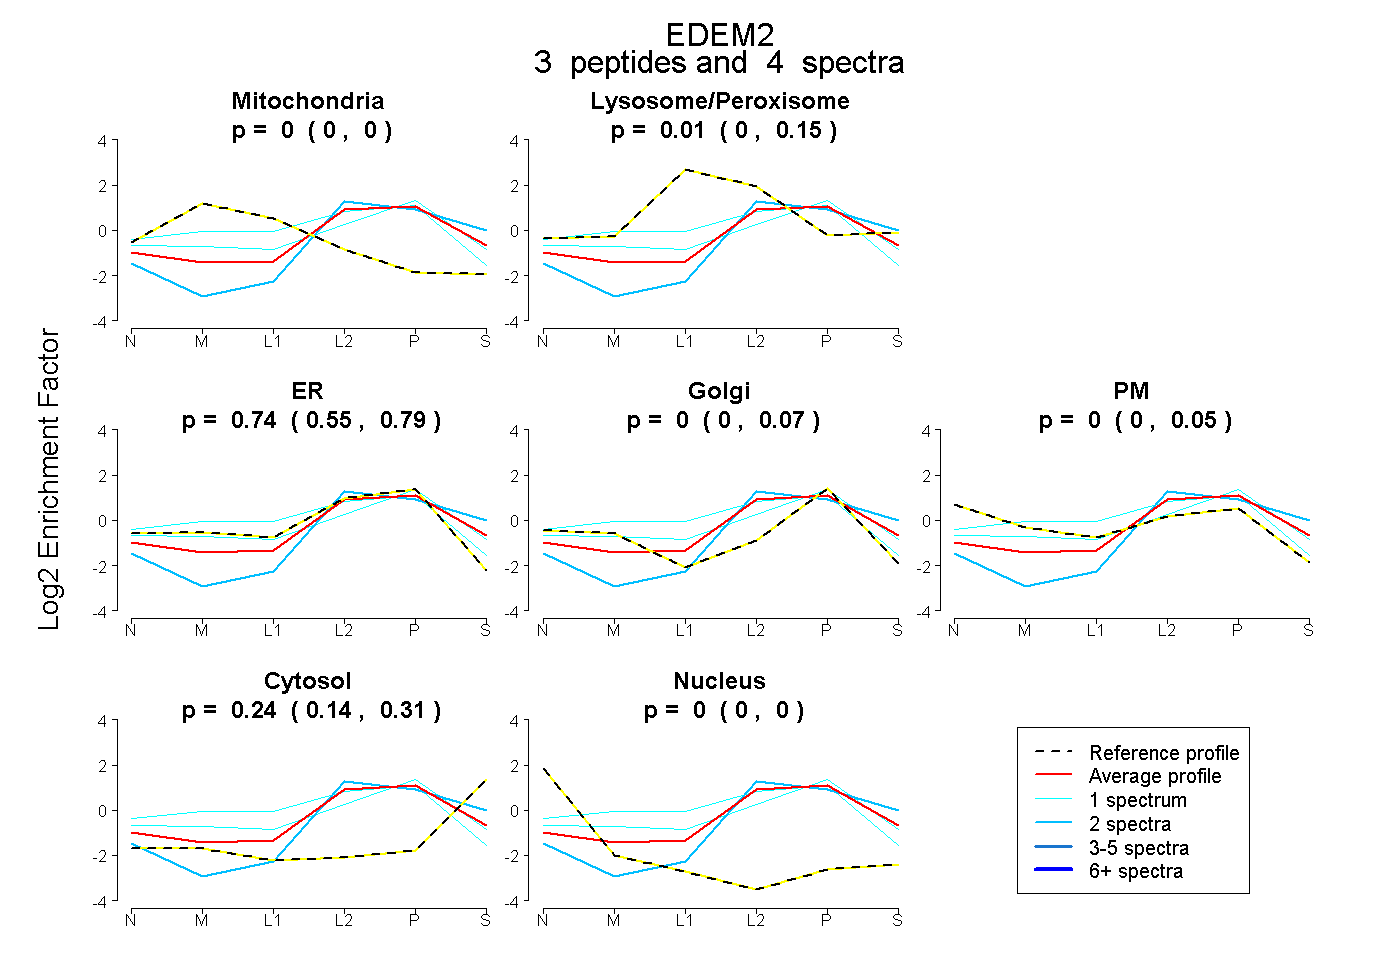 |
0.000 0.000 | 0.000 |
0.013 0.000 | 0.148 |
0.745 0.546 | 0.792 |
0.000 0.000 | 0.074 |
0.000 0.000 | 0.047 |
0.242 0.141 | 0.310 |
0.000 0.000 | 0.000 |
|||
| Plot | Lyso | Other | |||||||||||
| Expt C |
3 peptides |
7 spectra |
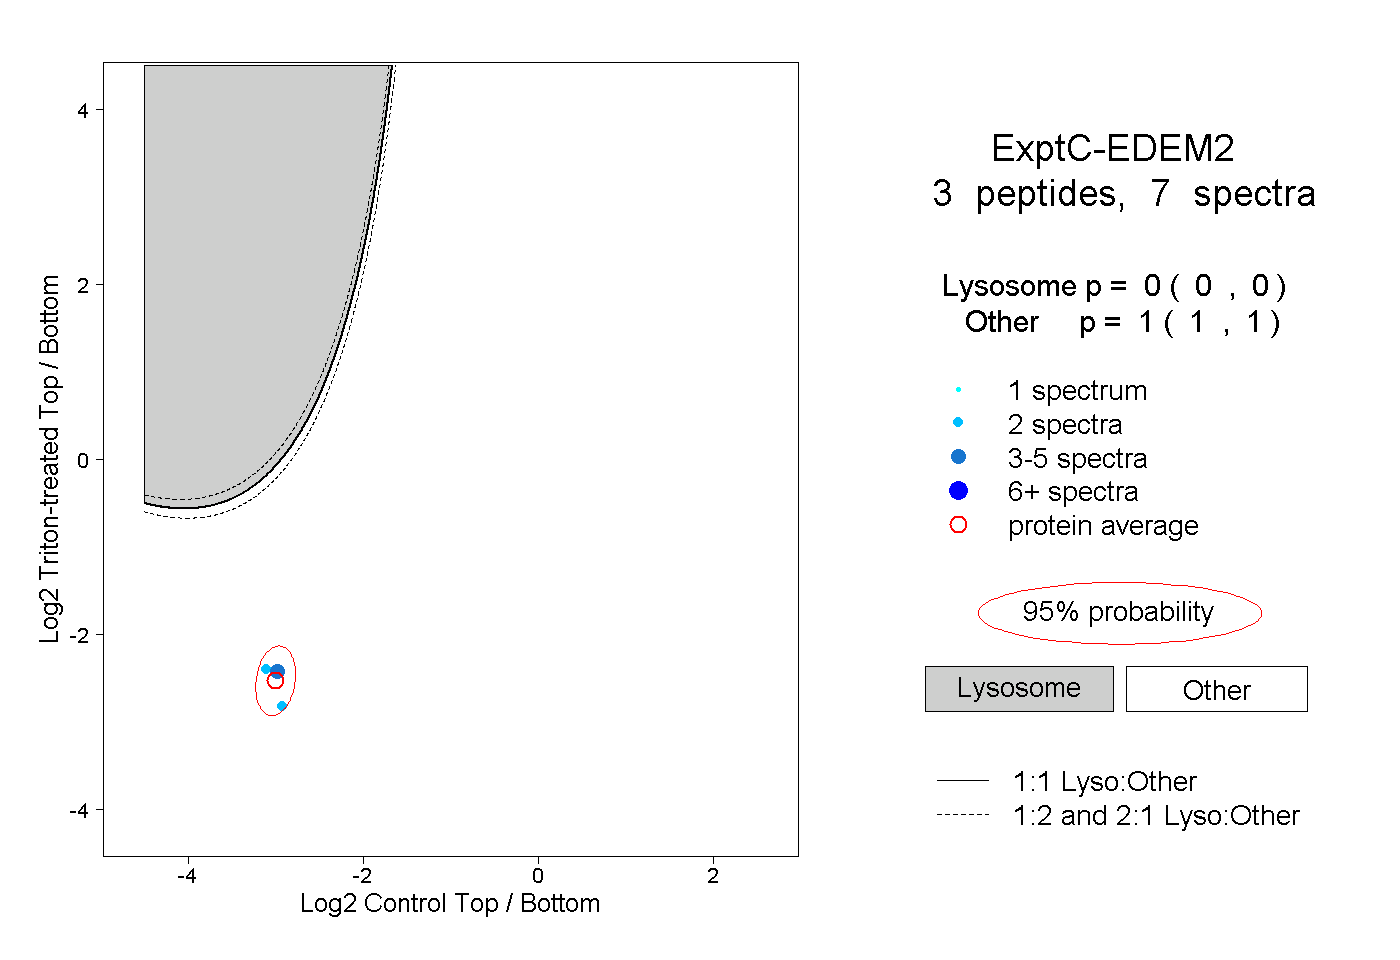 |
0.000 0.000 | 0.000 |
1.000 1.000 | 1.000 |