 7
7peptides
spectra
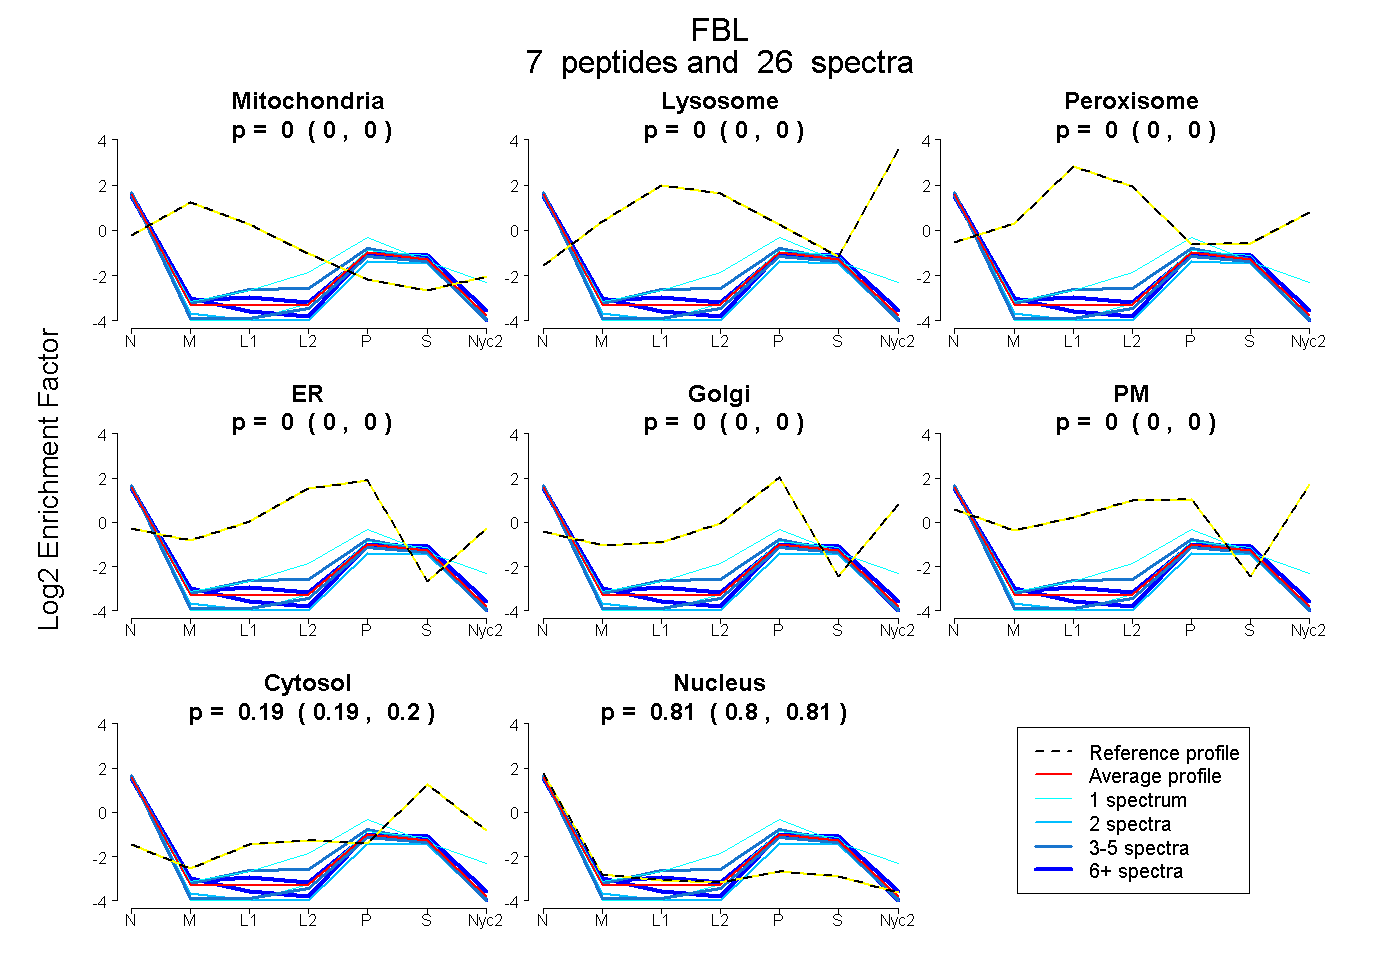
0.000 | 0.000
0.000 | 0.000
0.000 | 0.000
0.000 | 0.000
0.000 | 0.000
0.000 | 0.000
0.186 | 0.198
0.801 | 0.813
4peptides
spectra
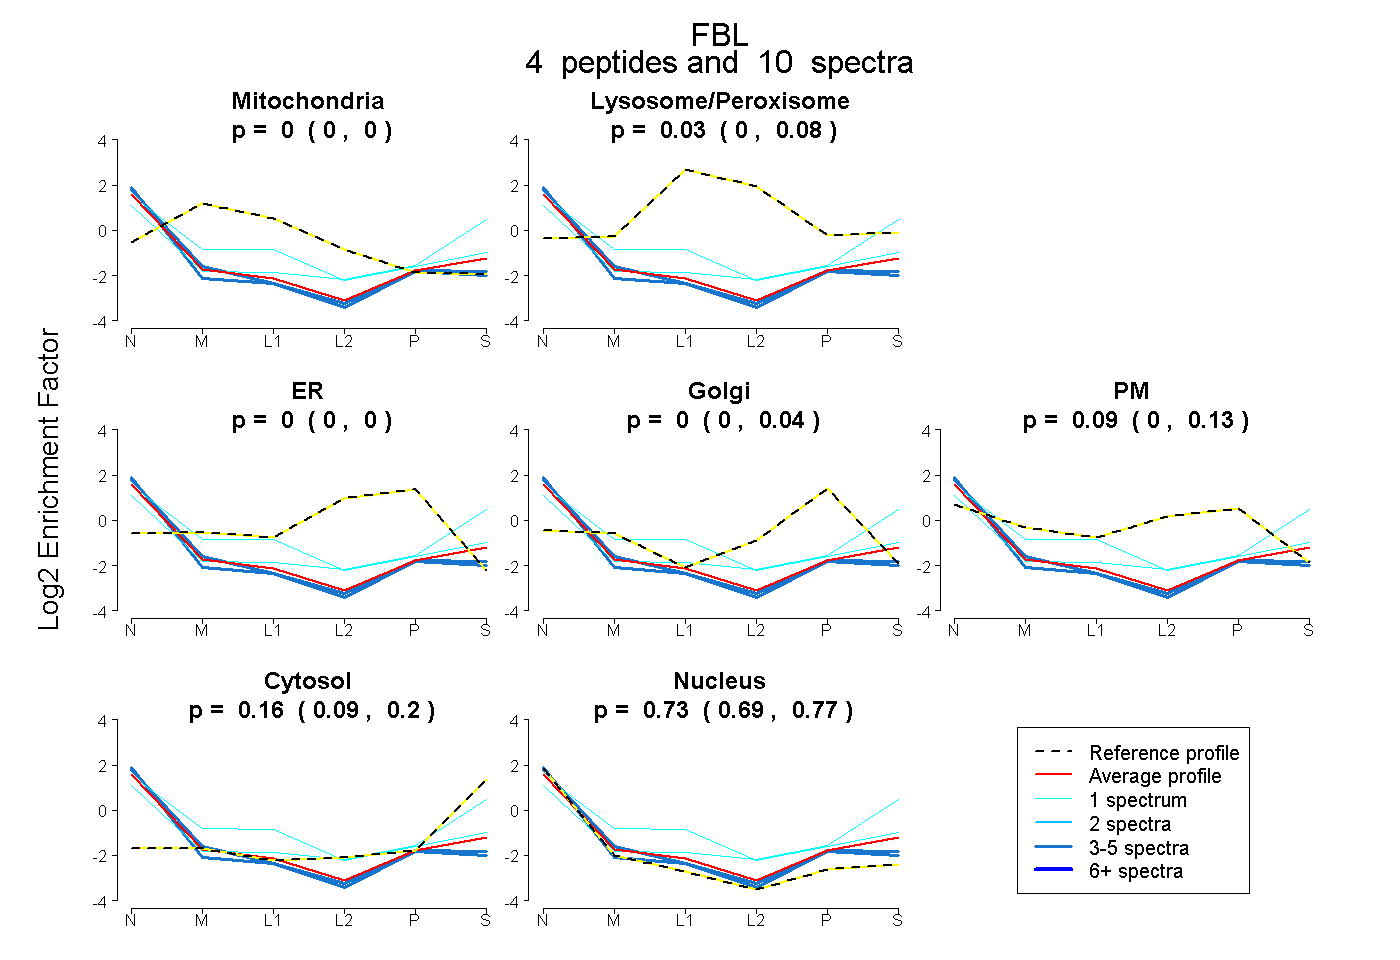
0.000 | 0.000
0.000 | 0.076
0.000 | 0.000
0.000 | 0.042
0.000 | 0.128
0.087 | 0.202
0.691 | 0.769
1peptide
spectra
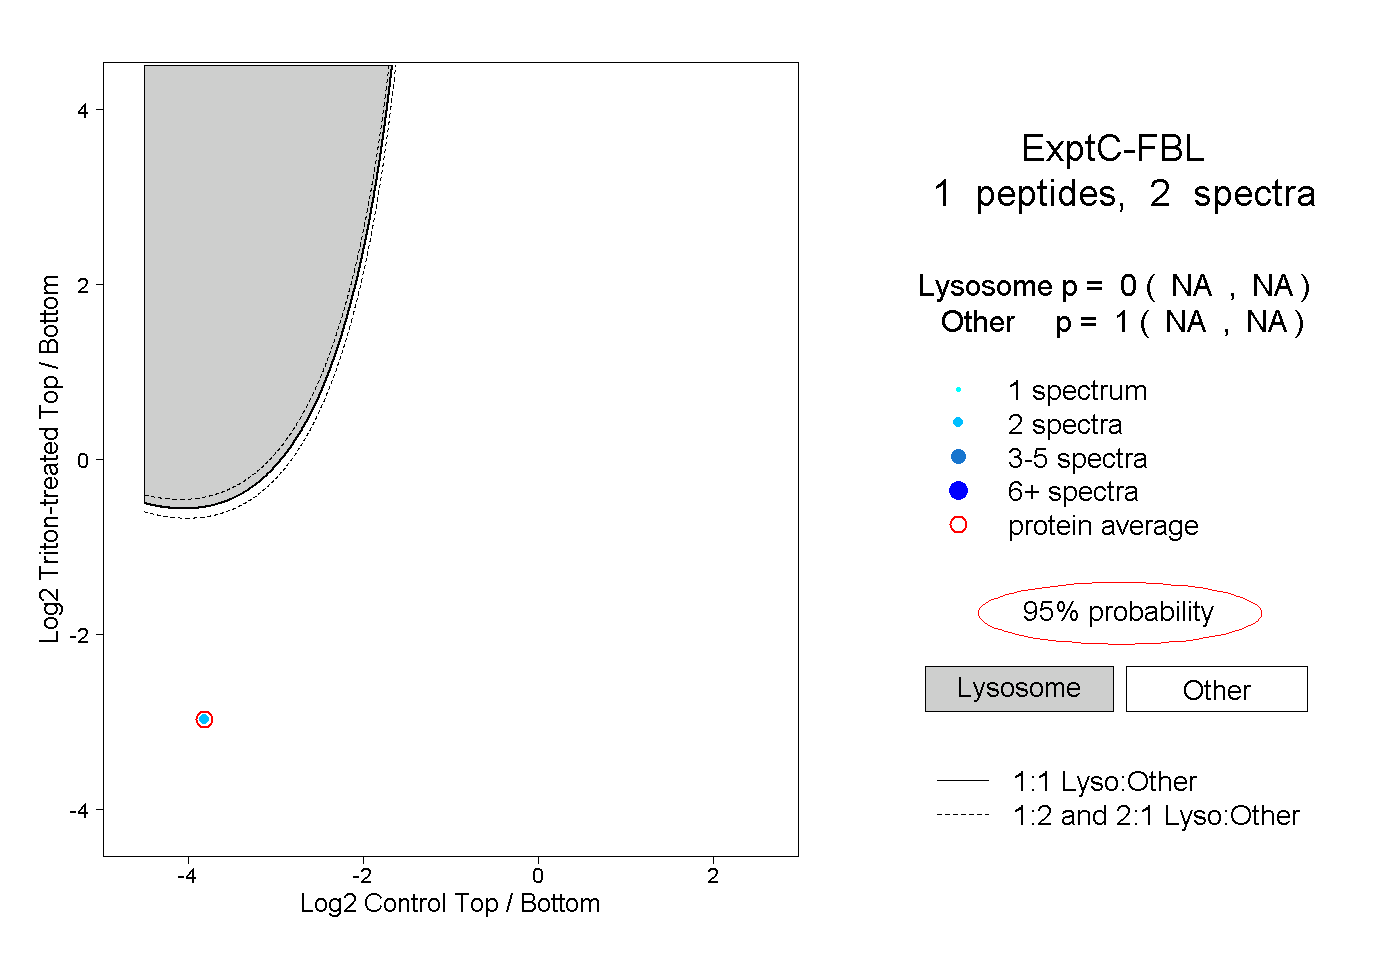
NA | NA
NA | NA