FBL
[ENSRNOP00000026021]
Main page
| | | Plot |
Mito |
Lyso |
|
Perox |
ER |
Golgi |
PM |
Cytosol |
Nucleus |
|
| Expt A |
 7
7
peptides |
26
spectra |
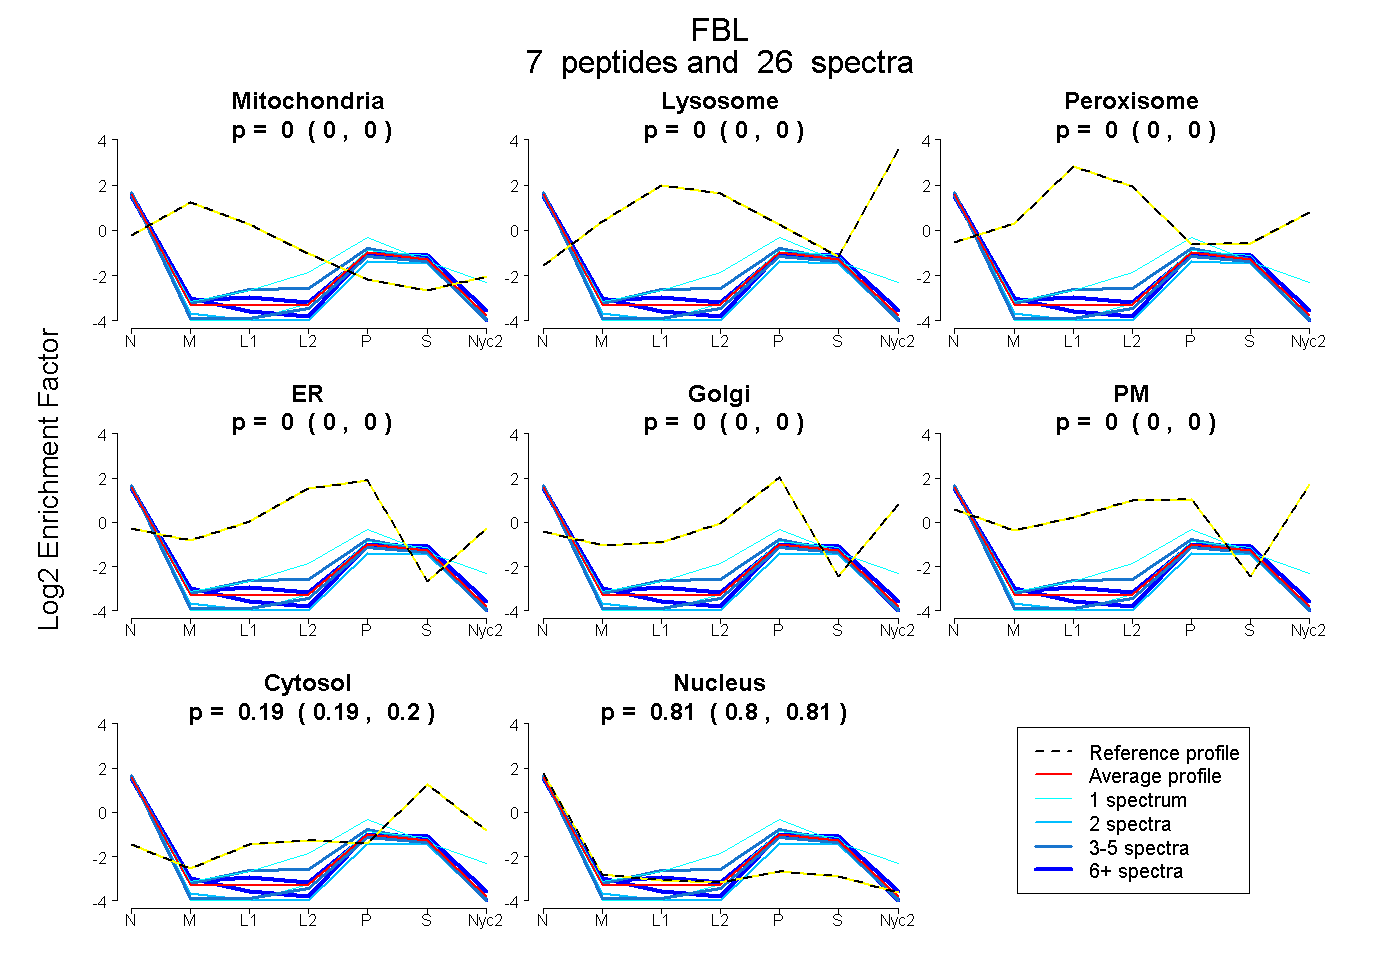 |
0.000
0.000 | 0.000 |
0.000
0.000 | 0.000 |
|
0.000
0.000 | 0.000 |
0.000
0.000 | 0.000 |
0.000
0.000 | 0.000 |
0.000
0.000 | 0.000 |
0.192
0.186 | 0.198 |
0.808
0.801 | 0.813 |
|
| | | Plot |
Mito |
|
Lyso or Perox |
|
ER |
Golgi |
PM |
Cytosol |
Nucleus |
|
| Expt B |
4
peptides |
10
spectra |
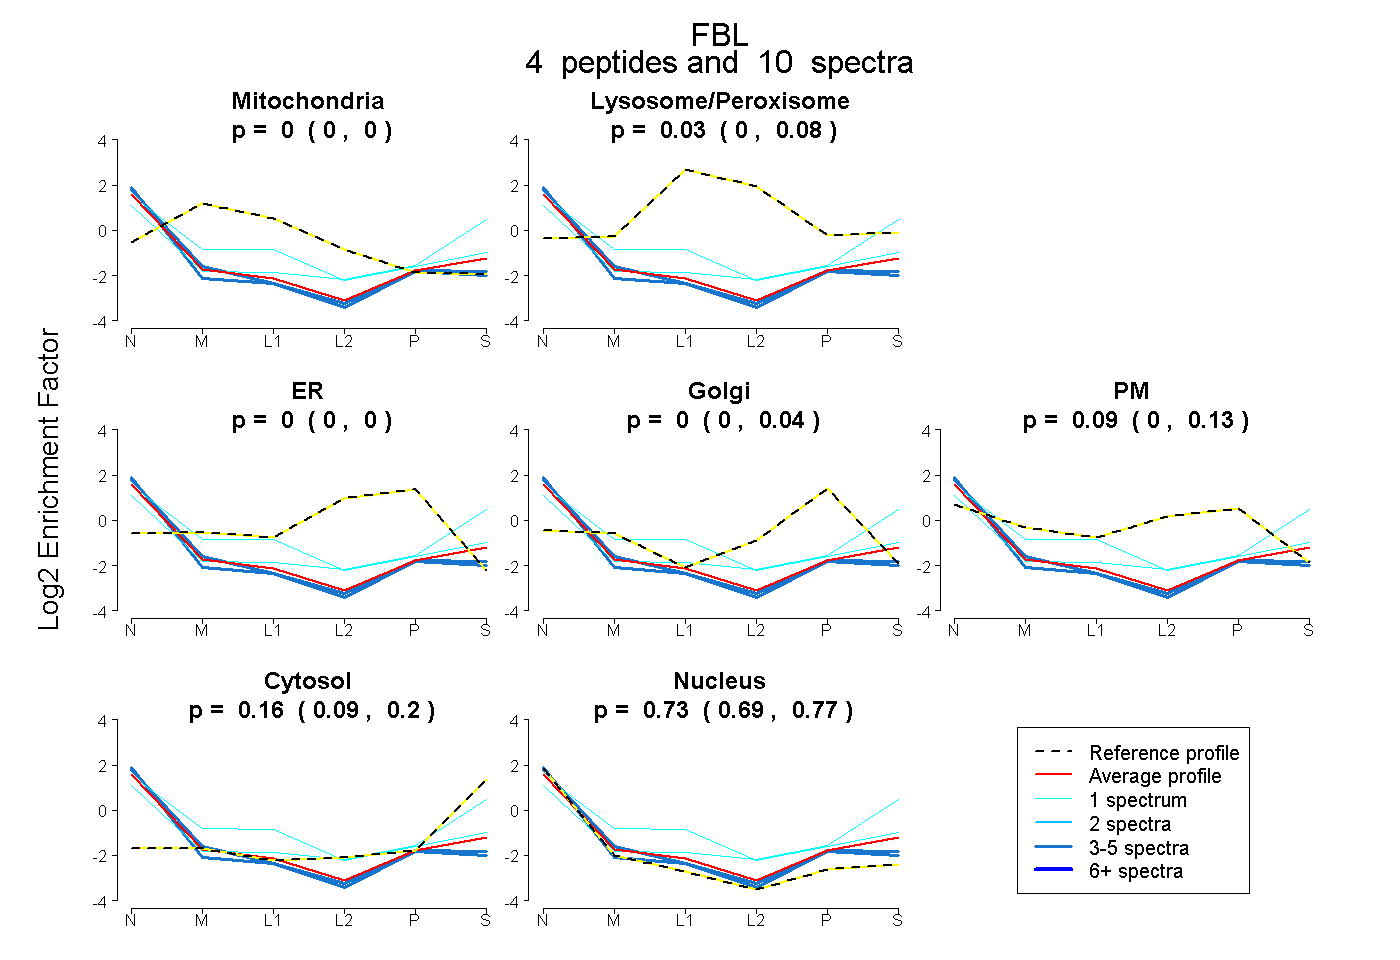 |
0.000
0.000 | 0.000 |
|
0.030
0.000 | 0.076 |
|
0.000
0.000 | 0.000 |
0.000
0.000 | 0.042 |
0.086
0.000 | 0.128 |
0.157
0.087 | 0.202 |
0.727
0.691 | 0.769 |
|
| 1 spectrum, NLVPGESVYGEK |
0.000 |
|
0.130 |
|
0.000 |
0.000 |
0.002 |
0.432 |
0.436 |
|
| 1 spectrum, NGGHFVISIK |
0.051 |
|
0.281 |
|
0.000 |
0.000 |
0.000 |
0.040 |
0.628 |
|
| 4 spectra, AWNPFR |
0.000 |
|
0.000 |
|
0.000 |
0.038 |
0.107 |
0.045 |
0.810 |
|
| 4 spectra, IVALNAHTFLR |
0.000 |
|
0.017 |
|
0.000 |
0.089 |
0.000 |
0.005 |
0.889 |
|
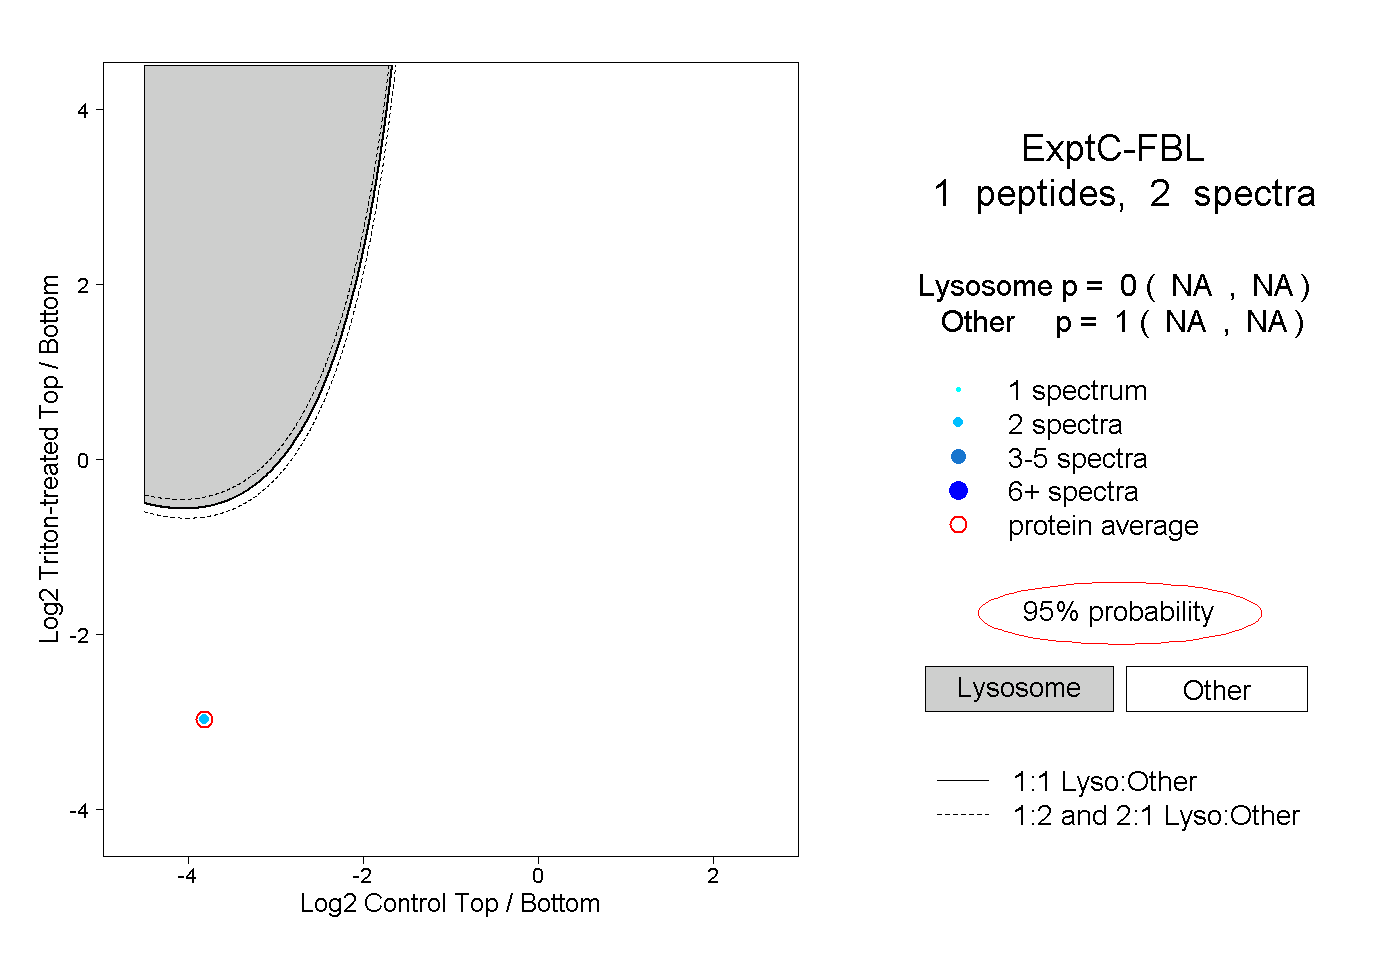
| | | Plot |
|
Lyso |
|
|
|
|
|
|
|
Other |
| Expt C |
1
peptide |
2
spectra |
 |
|
0.000
NA | NA |
|
|
|
|
|
|
|
1.000
NA | NA |