 31
31peptides
spectra
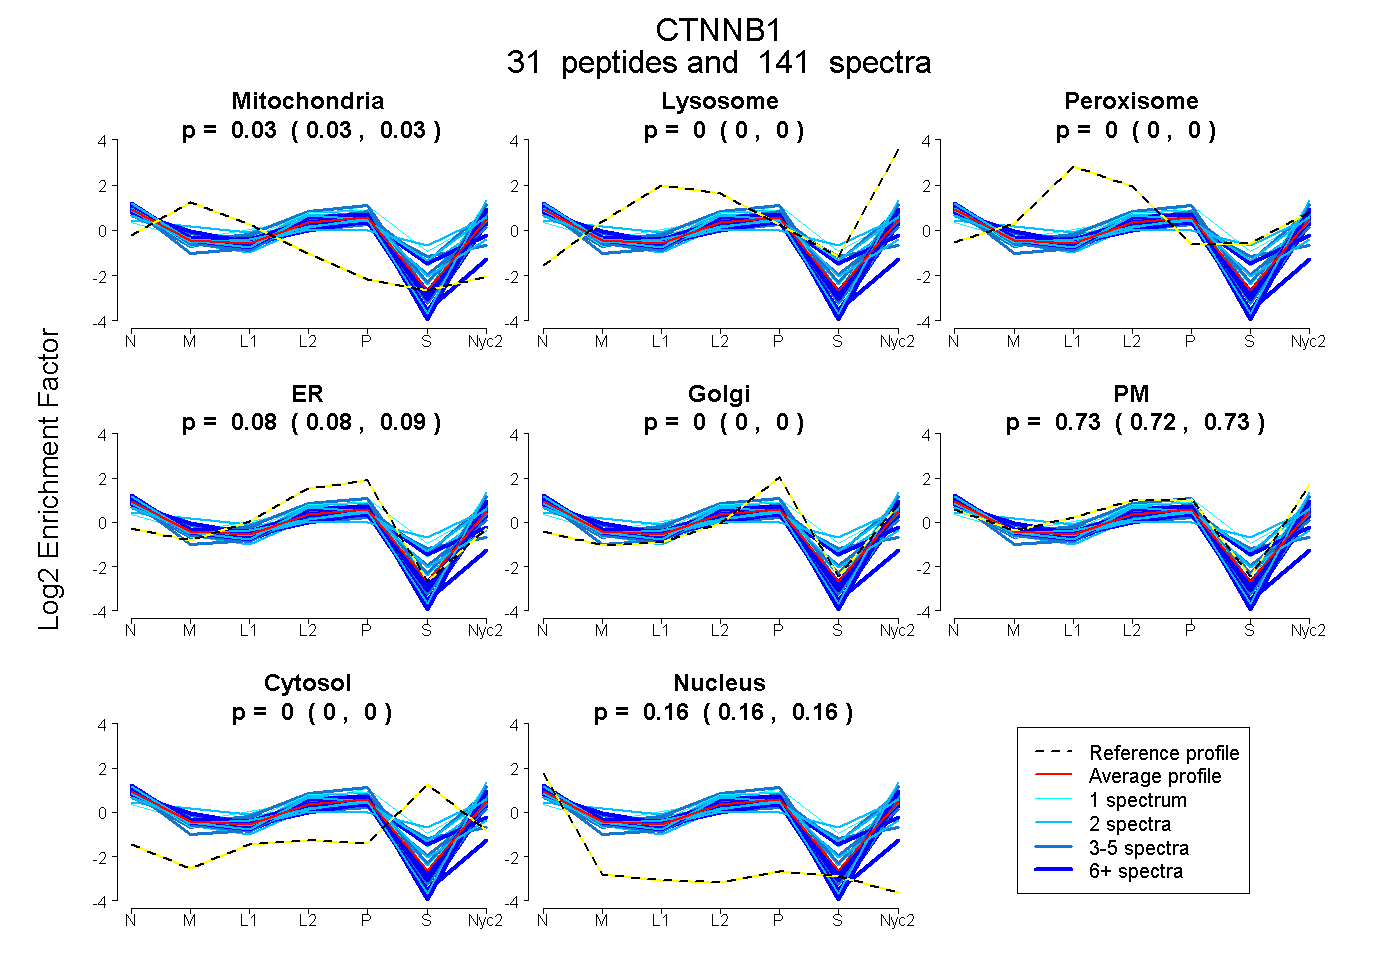
0.029 | 0.033
0.000 | 0.000
0.000 | 0.000
0.076 | 0.085
0.000 | 0.000
0.721 | 0.733
0.000 | 0.000
0.159 | 0.161
18peptides
spectra
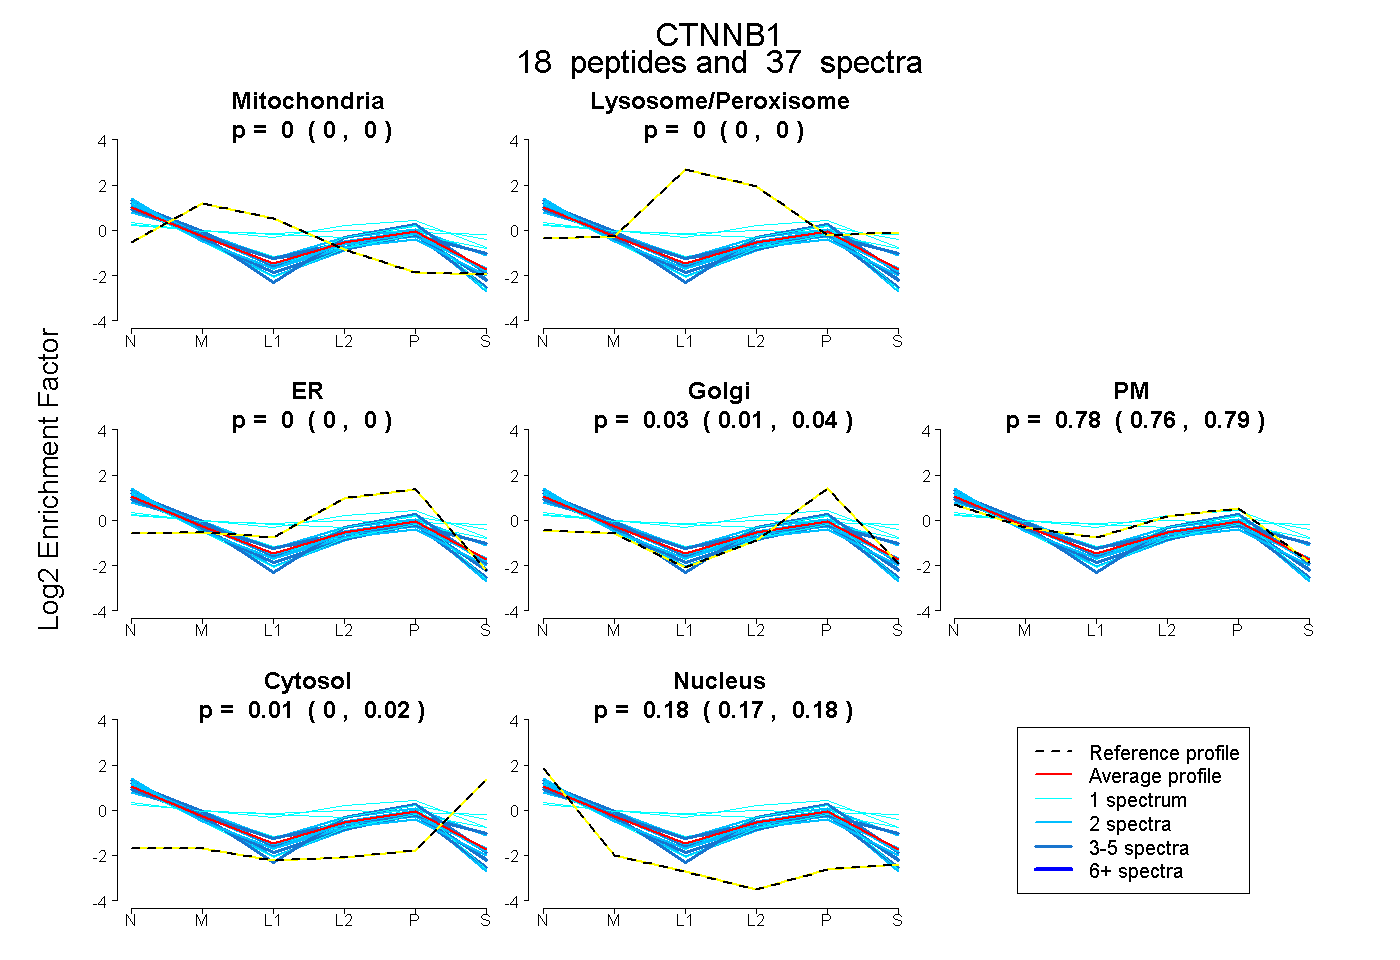
0.000 | 0.001
0.000 | 0.000
0.000 | 0.000
0.013 | 0.042
0.764 | 0.792
0.003 | 0.024
0.170 | 0.183
21peptides
spectra
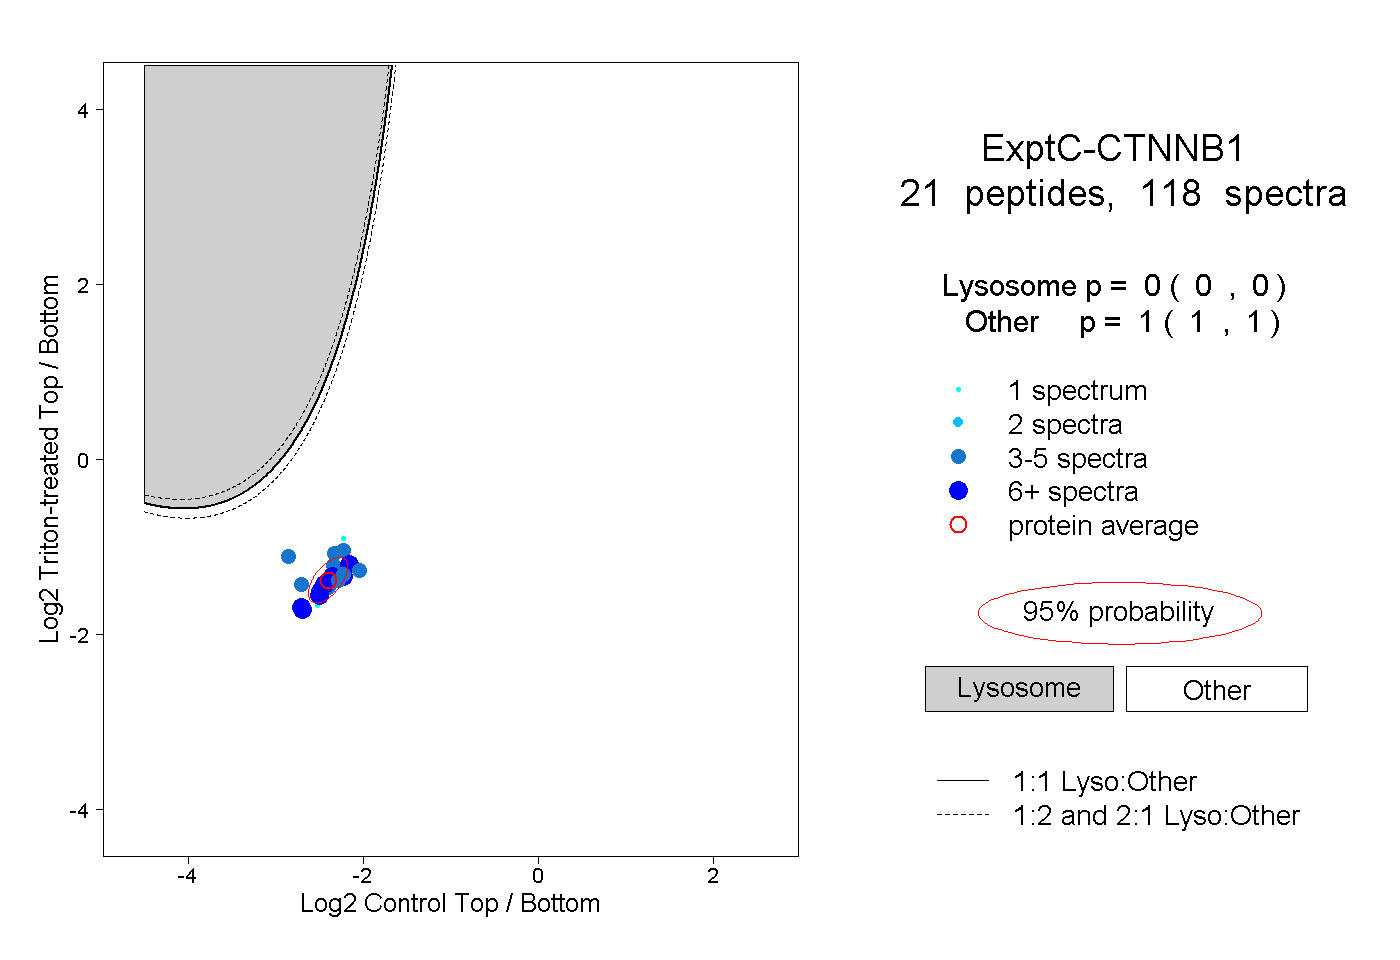
0.000 | 0.000
1.000 | 1.000
11peptides
spectra
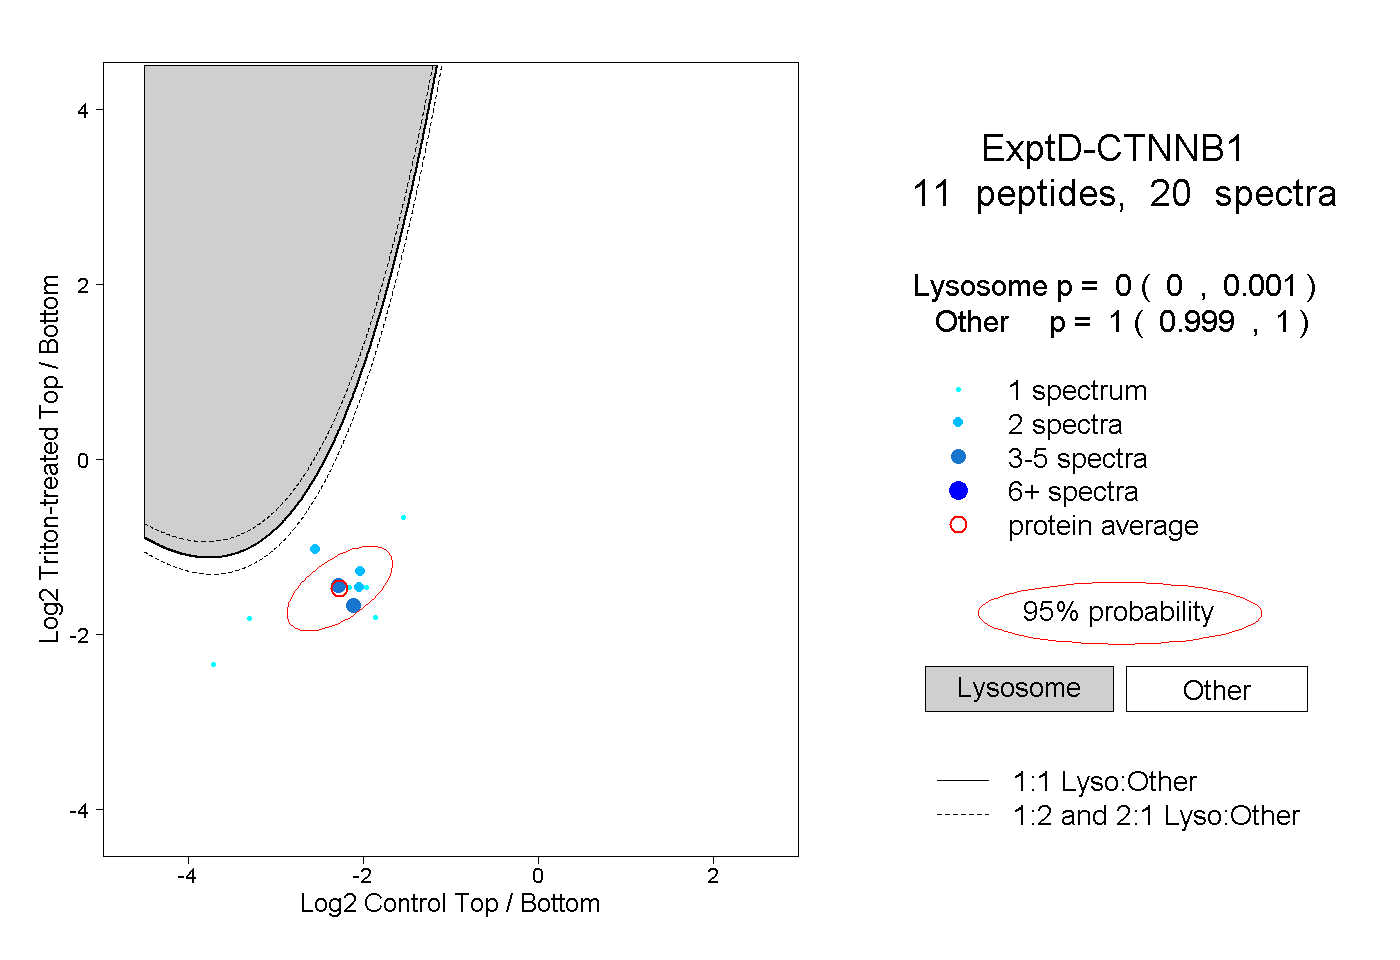
0.000 | 0.001
0.999 | 1.000