 10
10peptides
spectra
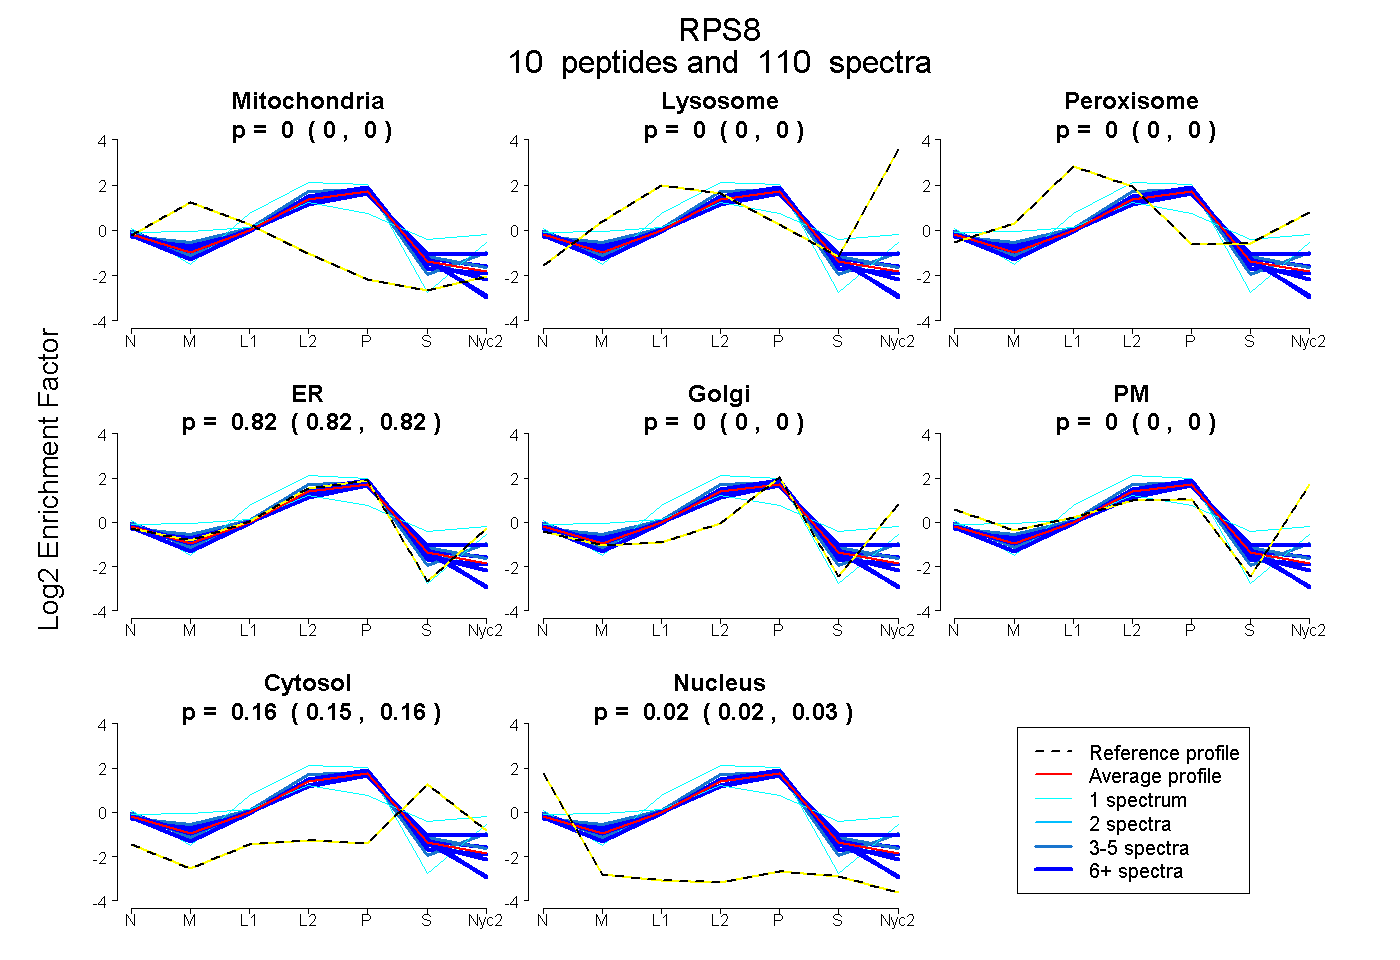
0.000 | 0.005
0.000 | 0.000
0.000 | 0.000
0.816 | 0.821
0.000 | 0.000
0.000 | 0.000
0.153 | 0.159
0.019 | 0.026
10peptides
spectra
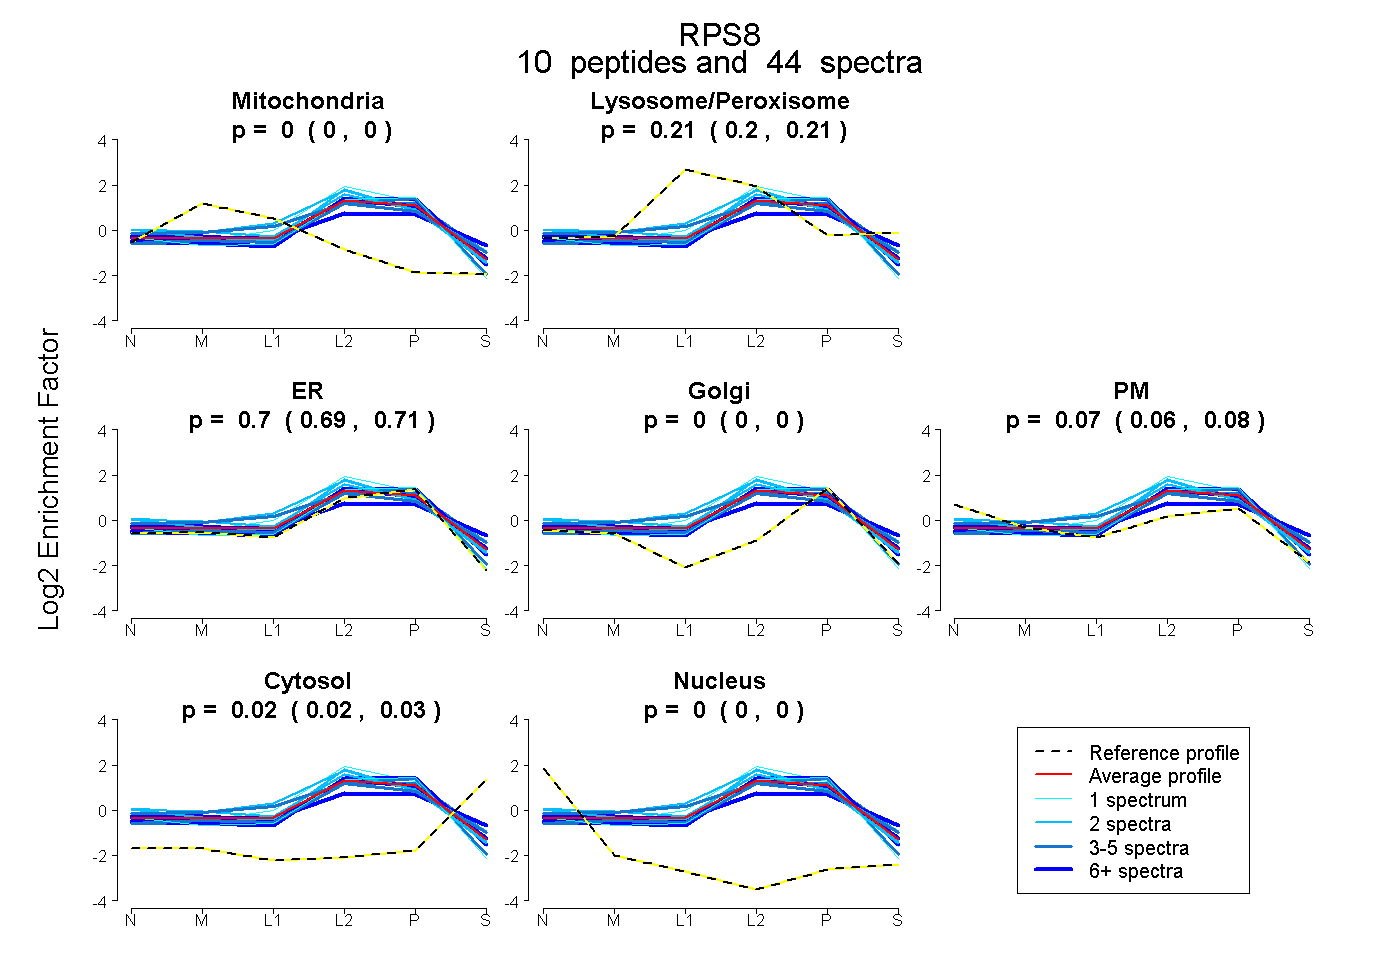
0.000 | 0.000
0.199 | 0.211
0.687 | 0.713
0.000 | 0.000
0.056 | 0.082
0.018 | 0.028
0.000 | 0.000
12peptides
spectra
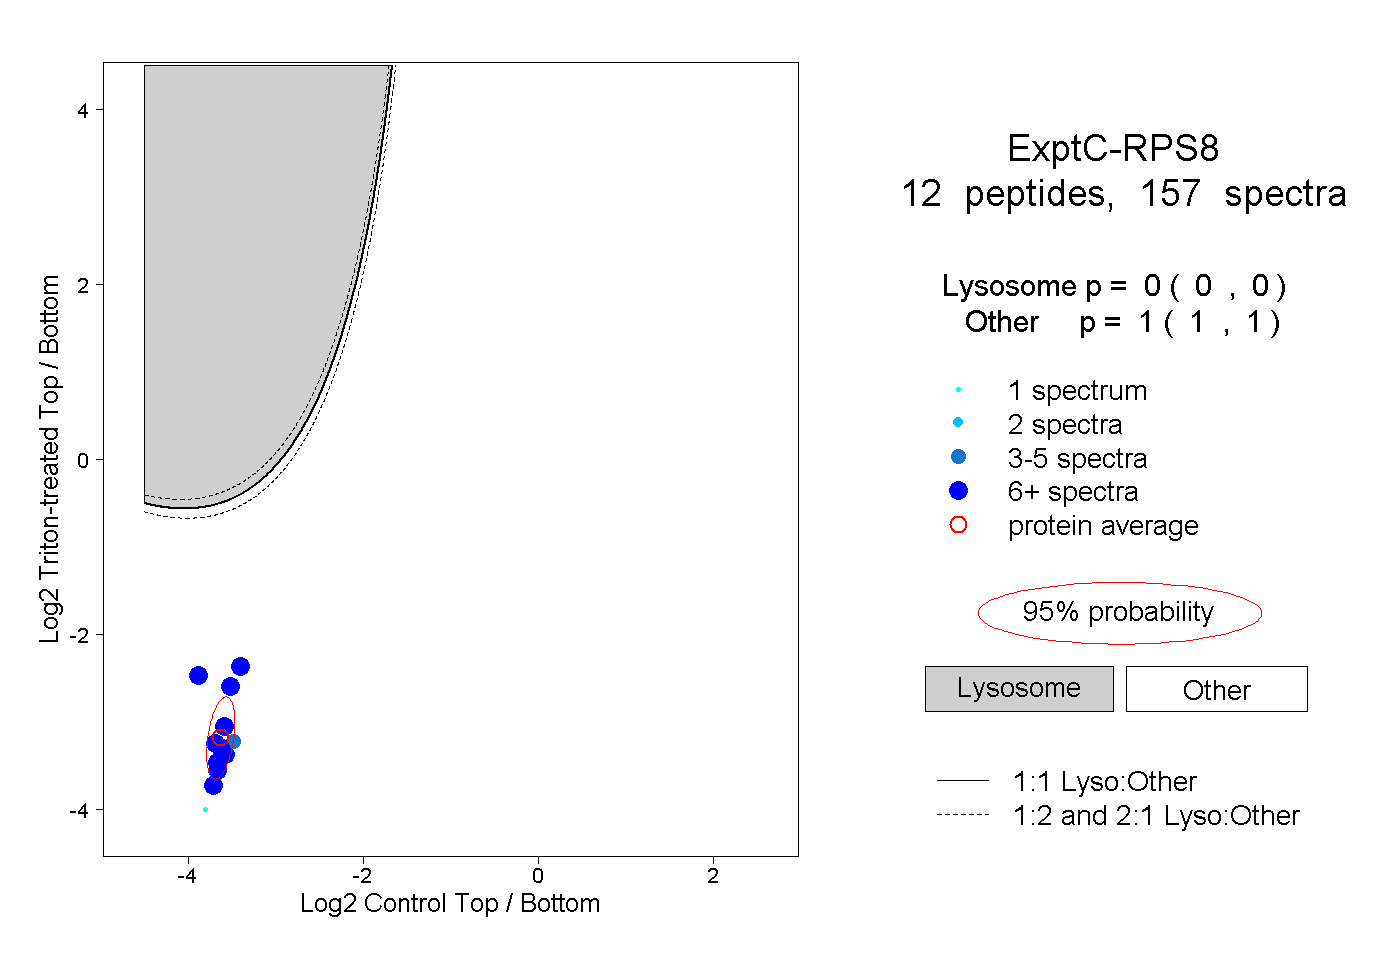
0.000 | 0.000
1.000 | 1.000
6peptides
spectra
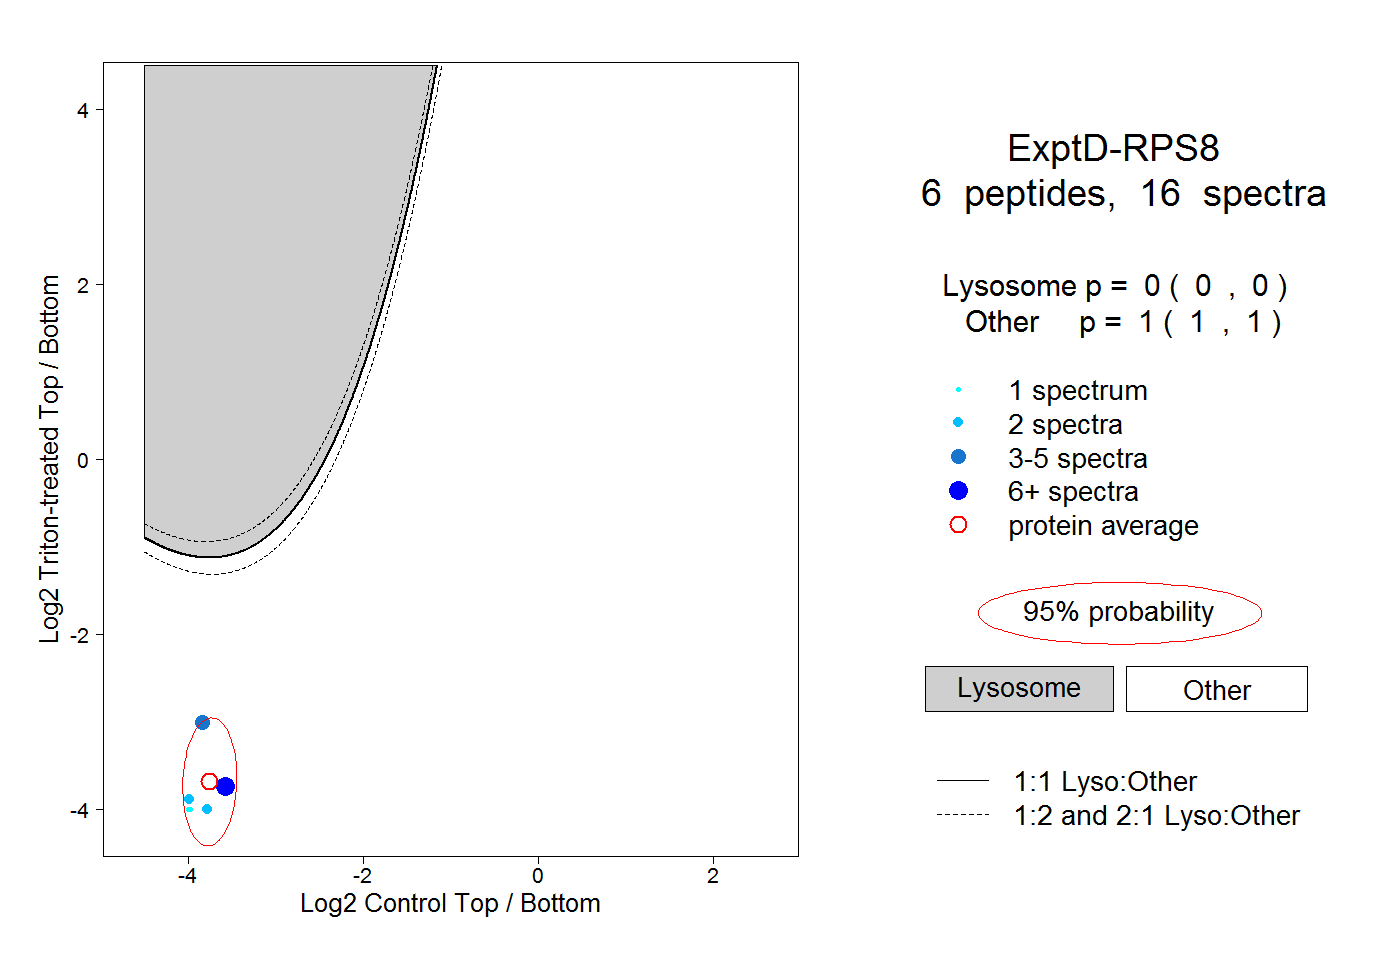
0.000 | 0.000
1.000 | 1.000