 10
10peptides
spectra
0.000 | 0.005
0.000 | 0.000
0.000 | 0.000
0.816 | 0.821
0.000 | 0.000
0.000 | 0.000
0.153 | 0.159
0.019 | 0.026
| Plot | Mito | Lyso | Perox | ER | Golgi | PM | Cytosol | Nucleus | |||||
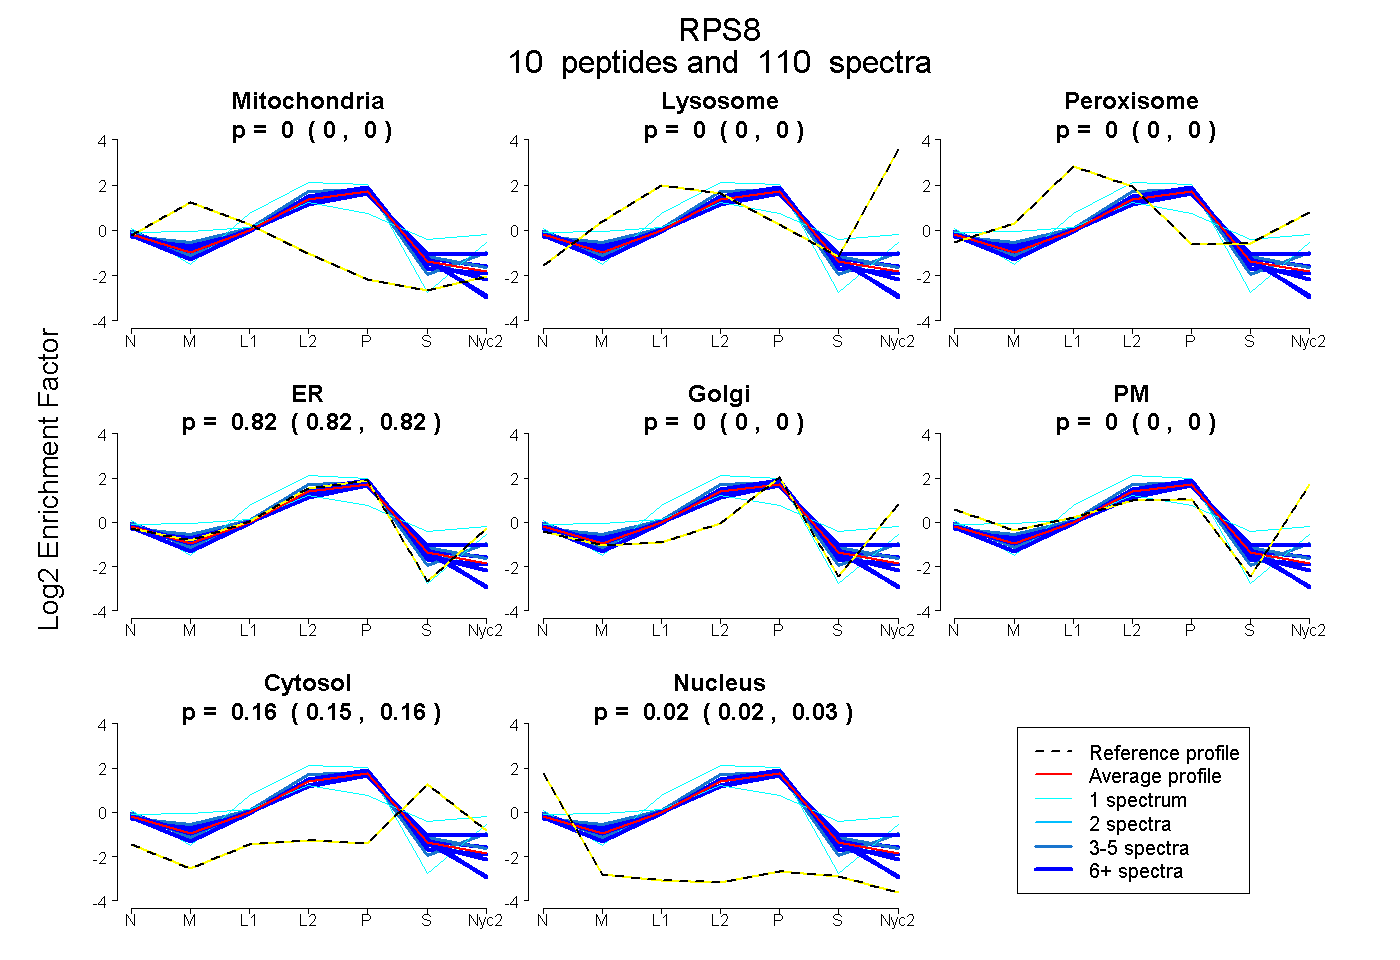
| Expt A |
10 peptides |
110 spectra |
|
0.002 0.000 | 0.005 |
0.000 0.000 | 0.000 |
0.000 0.000 | 0.000 |
0.819 0.816 | 0.821 |
0.000 0.000 | 0.000 |
0.000 0.000 | 0.000 |
0.157 0.153 | 0.159 |
0.023 0.019 | 0.026 |
| 12 spectra, NCIVLIDSTPYR | 0.039 | 0.000 | 0.000 | 0.785 | 0.000 | 0.000 | 0.102 | 0.075 | ||
| 28 spectra, LTPEEEEILNK | 0.000 | 0.000 | 0.000 | 0.827 | 0.000 | 0.000 | 0.129 | 0.044 | ||
| 3 spectra, IIDVVYNASNNELVR | 0.020 | 0.000 | 0.041 | 0.894 | 0.000 | 0.000 | 0.045 | 0.000 | ||
| 21 spectra, ADGYVLEGK | 0.000 | 0.000 | 0.000 | 0.794 | 0.000 | 0.000 | 0.185 | 0.021 | ||
| 1 spectrum, YELGRPAANTK | 0.000 | 0.000 | 0.308 | 0.440 | 0.000 | 0.034 | 0.218 | 0.000 | ||
| 21 spectra, QWYESHYALPLGR | 0.000 | 0.000 | 0.038 | 0.753 | 0.000 | 0.000 | 0.209 | 0.000 | ||
| 9 spectra, LDVGNFSWGSECCTR | 0.037 | 0.000 | 0.000 | 0.753 | 0.000 | 0.000 | 0.132 | 0.077 | ||
| 11 spectra, ELEFYLR | 0.055 | 0.000 | 0.000 | 0.839 | 0.000 | 0.000 | 0.088 | 0.018 | ||
| 1 spectrum, KPYHK | 0.000 | 0.000 | 0.029 | 0.971 | 0.000 | 0.000 | 0.000 | 0.000 | ||
| 3 spectra, ISSLLEEQFQQGK | 0.000 | 0.000 | 0.016 | 0.793 | 0.000 | 0.000 | 0.187 | 0.004 |
| Plot | Mito | Lyso or Perox | ER | Golgi | PM | Cytosol | Nucleus | ||||||
| Expt B |
10 peptides |
44 spectra |
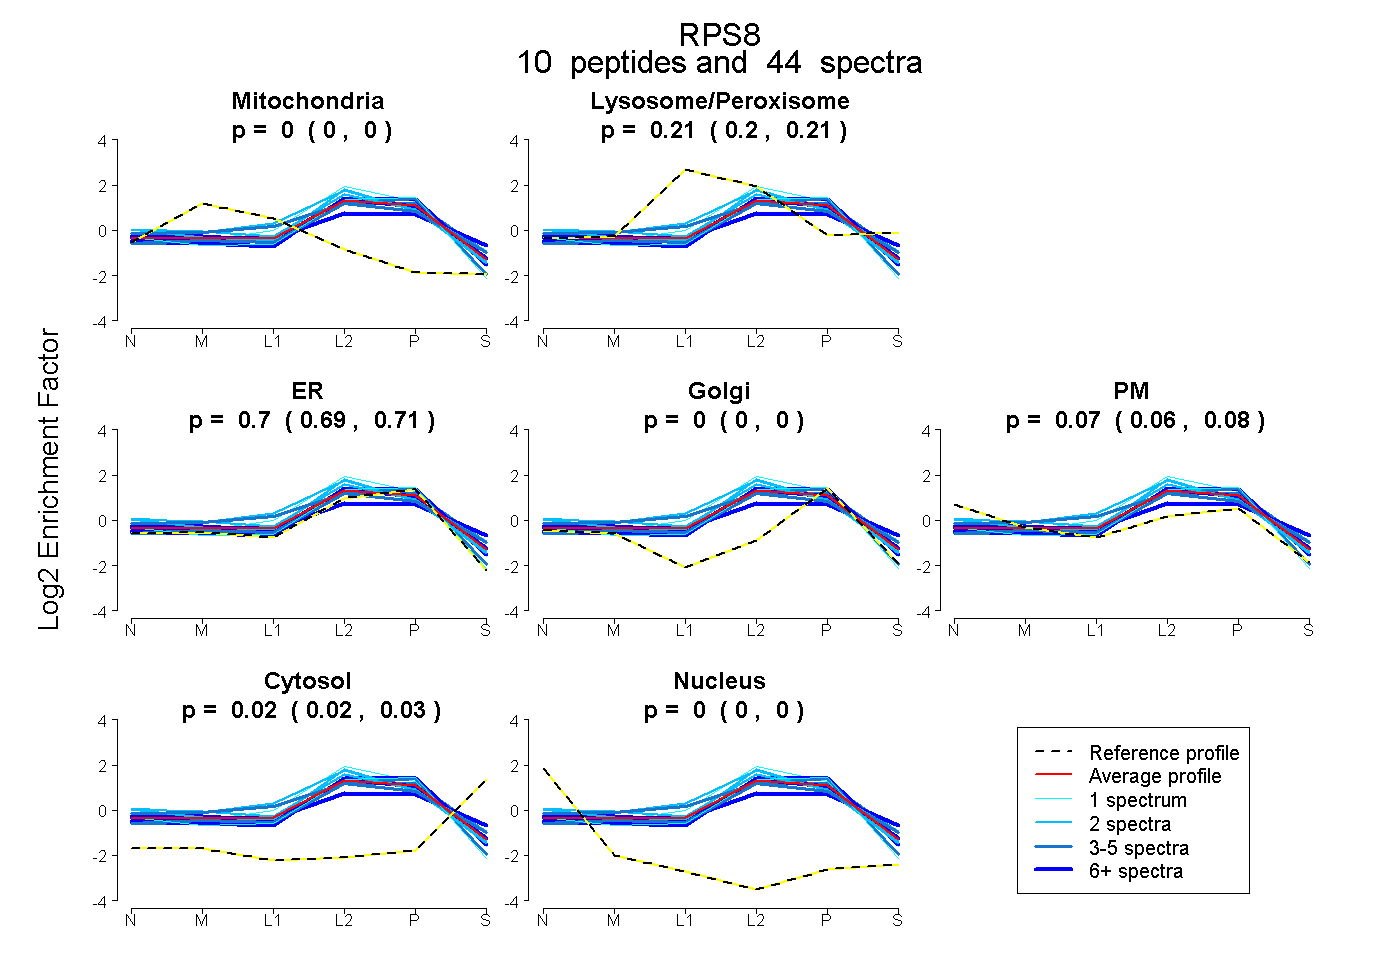 |
0.000 0.000 | 0.000 |
0.205 0.199 | 0.211 |
0.701 0.687 | 0.713 |
0.000 0.000 | 0.000 |
0.071 0.056 | 0.082 |
0.023 0.018 | 0.028 |
0.000 0.000 | 0.000 |
|||
| Plot | Lyso | Other | |||||||||||
| Expt C |
12 peptides |
157 spectra |
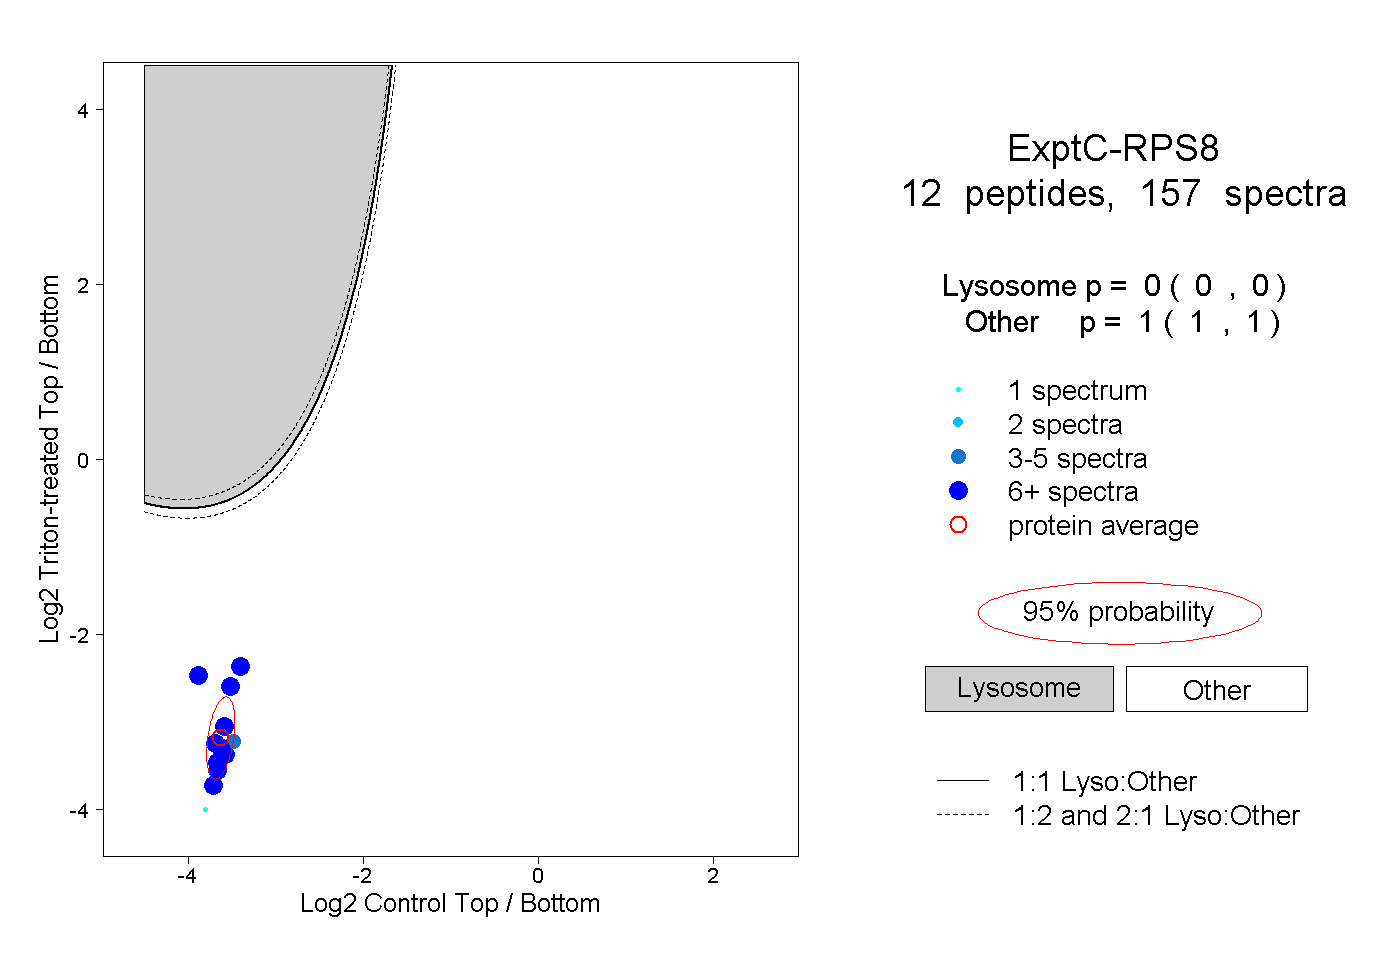 |
0.000 0.000 | 0.000 |
1.000 1.000 | 1.000 |
||||||||
| Plot | Lyso | Other | |||||||||||
| Expt D |
6 peptides |
16 spectra |
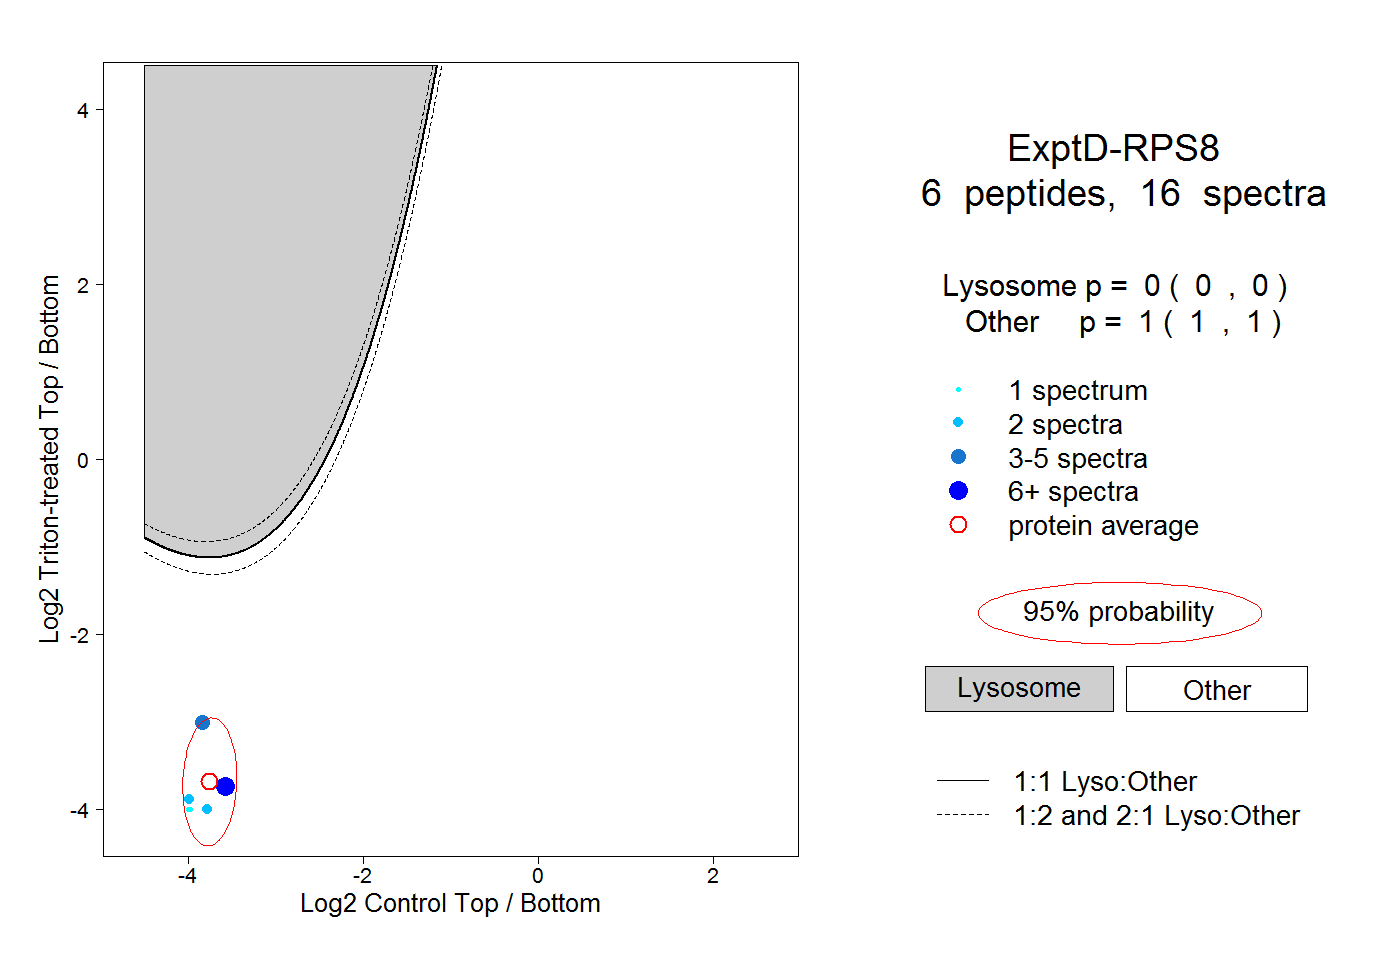 |
0.000 0.000 | 0.000 |
1.000 1.000 | 1.000 |