 33
33peptides
spectra
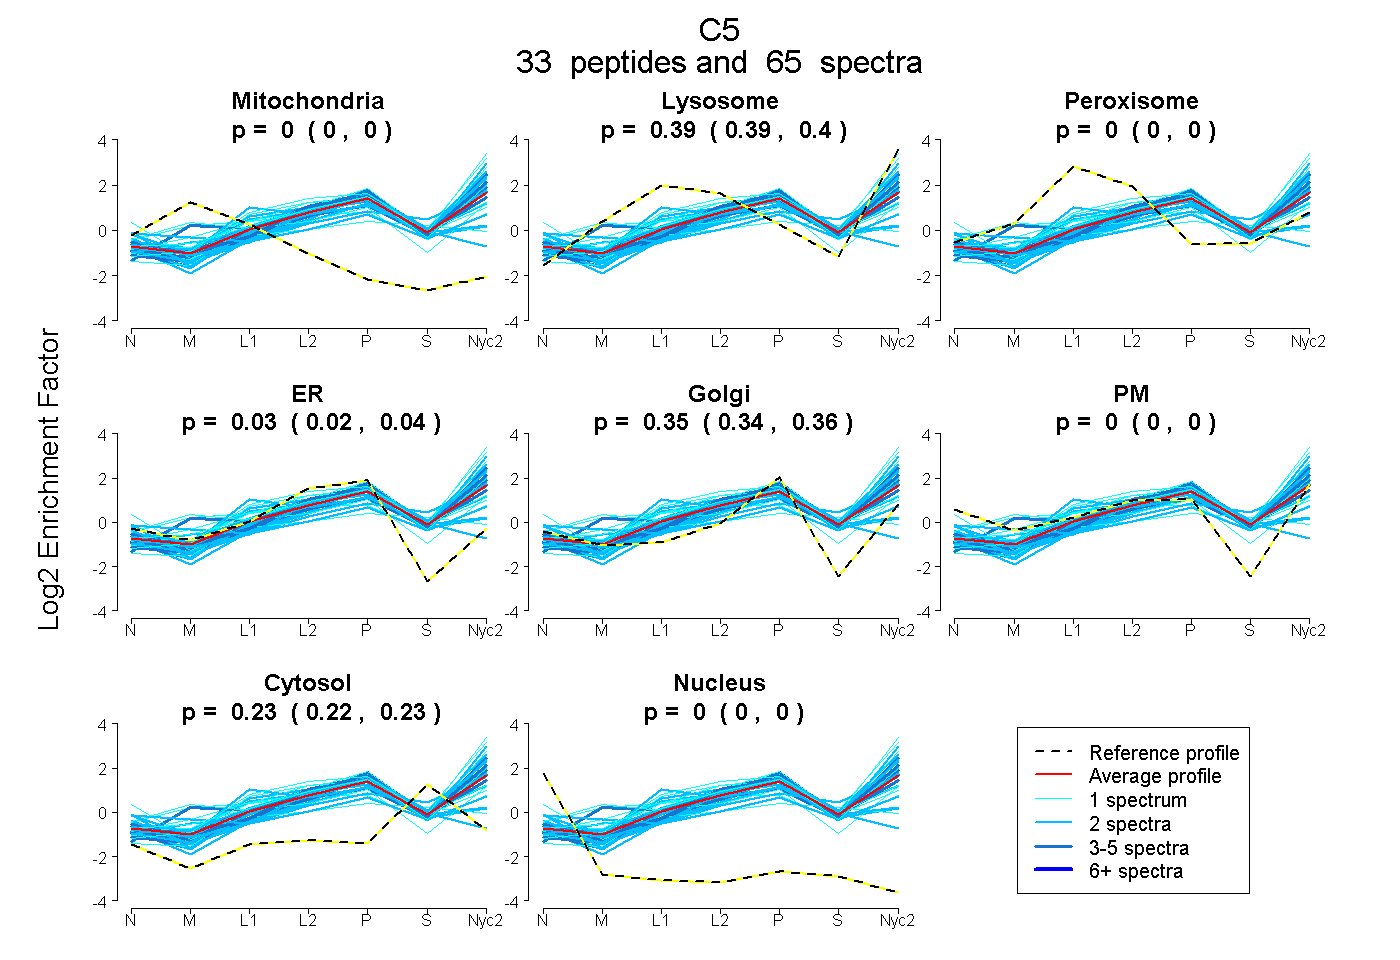
0.000 | 0.000
0.386 | 0.397
0.000 | 0.000
0.019 | 0.043
0.340 | 0.361
0.000 | 0.000
0.222 | 0.228
0.000 | 0.000
12peptides
spectra
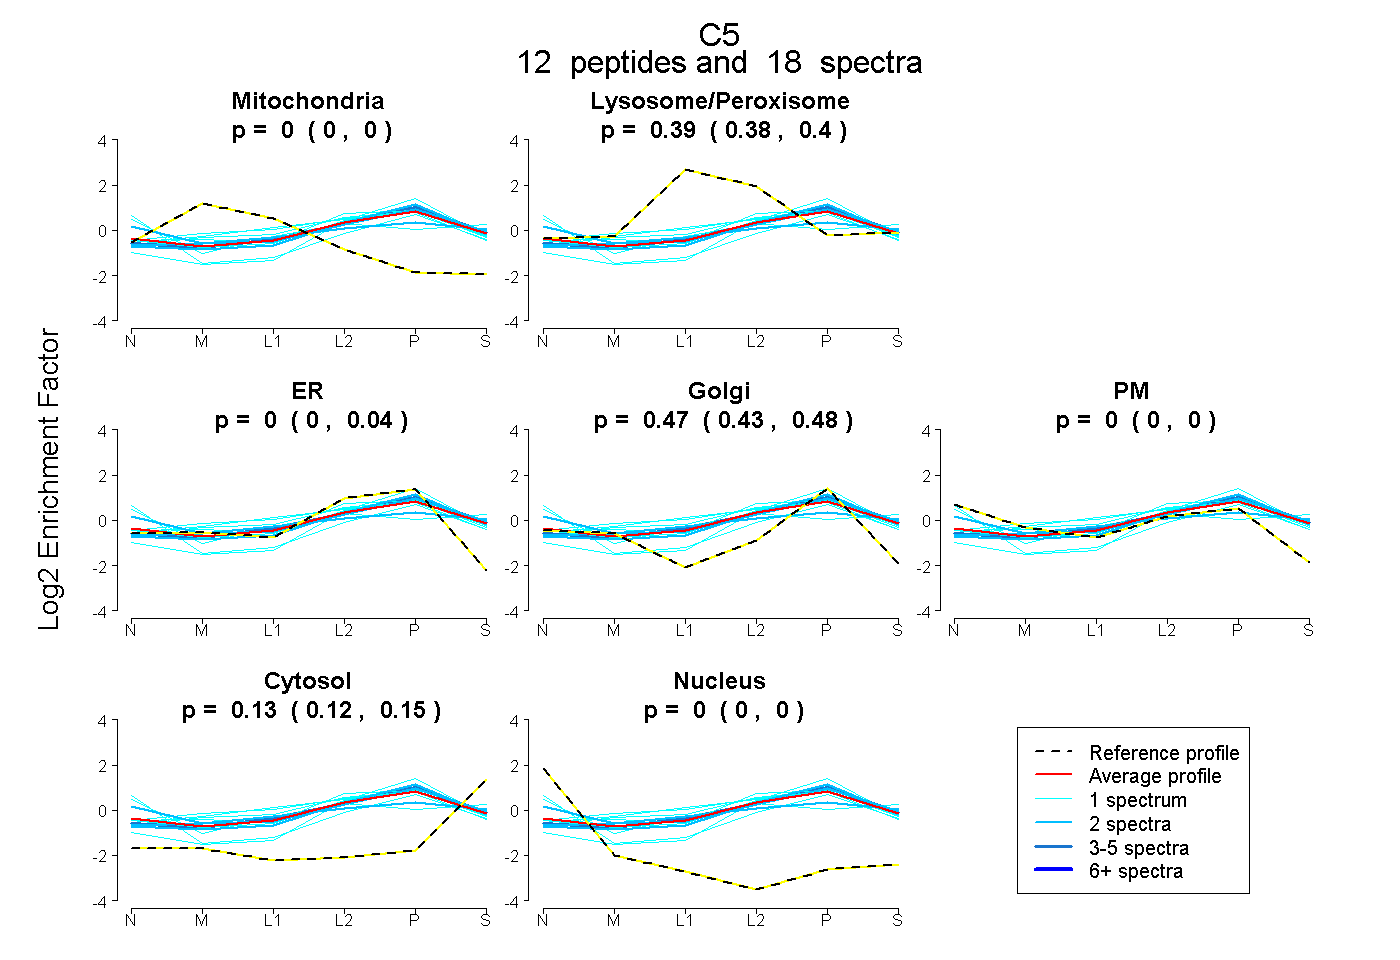
0.000 | 0.000
0.375 | 0.398
0.000 | 0.035
0.434 | 0.481
0.000 | 0.000
0.125 | 0.145
0.000 | 0.000
49peptides
spectra
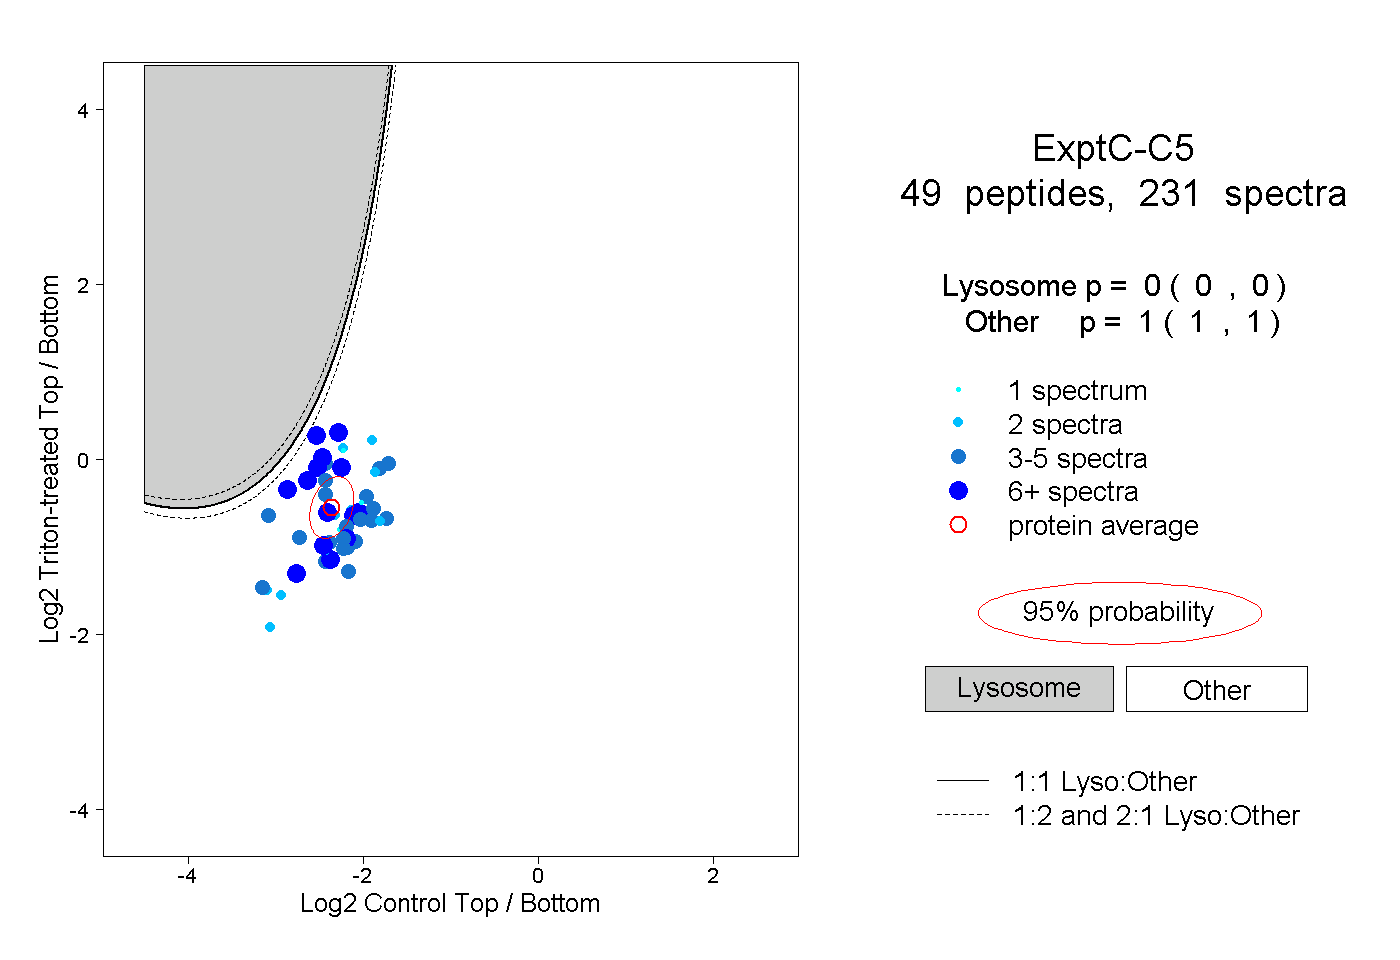
0.000 | 0.000
1.000 | 1.000
10peptides
spectra
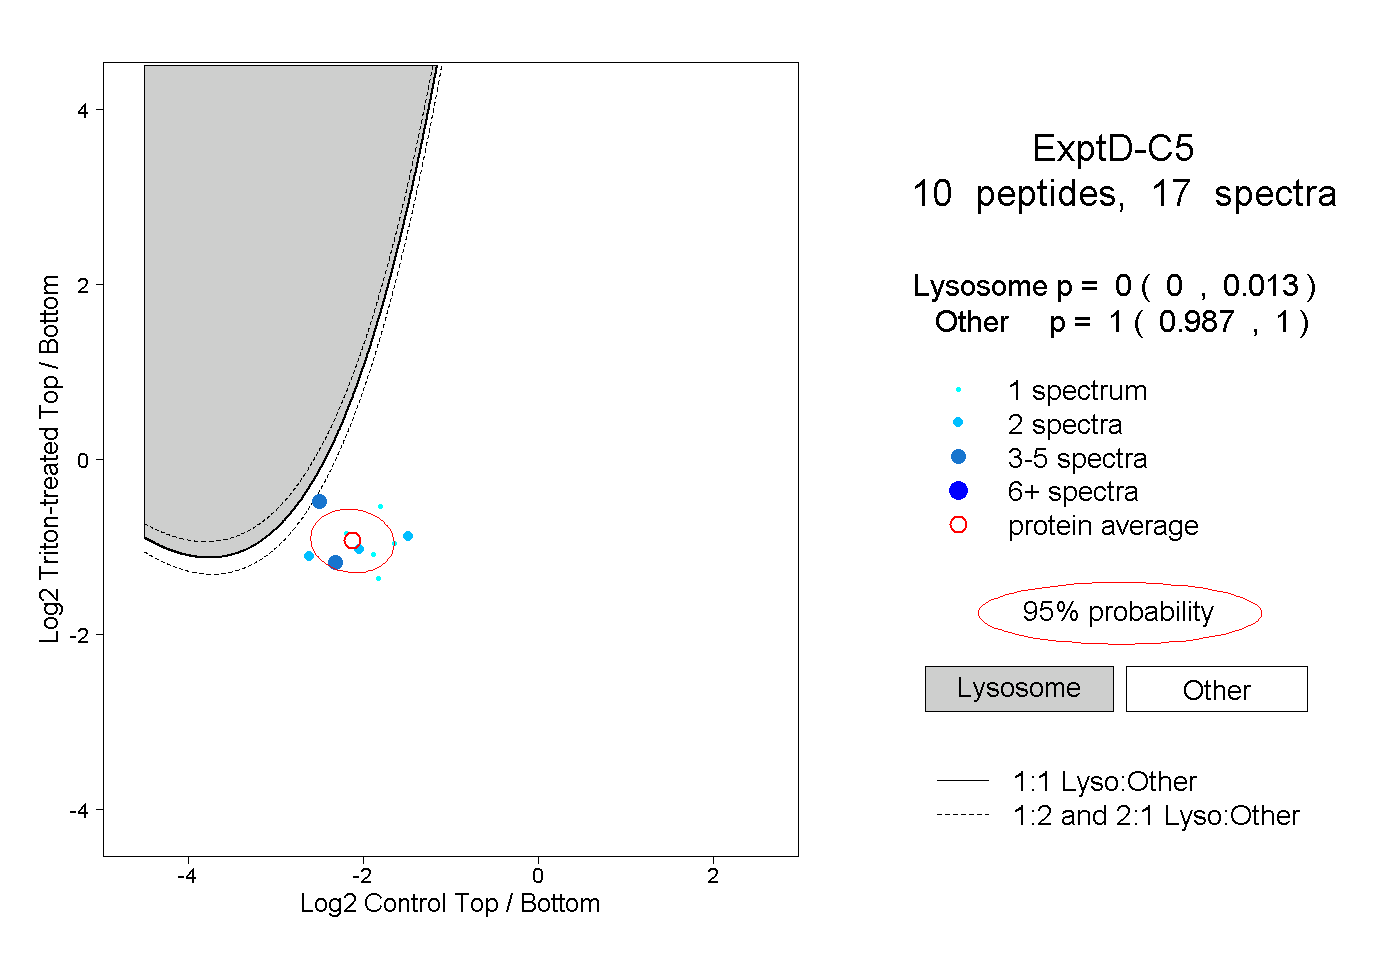
0.000 | 0.013
0.987 | 1.000