C5
[ENSRNOP00000025534]
Main page
| | | Plot |
Mito |
Lyso |
|
Perox |
ER |
Golgi |
PM |
Cytosol |
Nucleus |
|
| Expt A |
 33
33
peptides |
65
spectra |
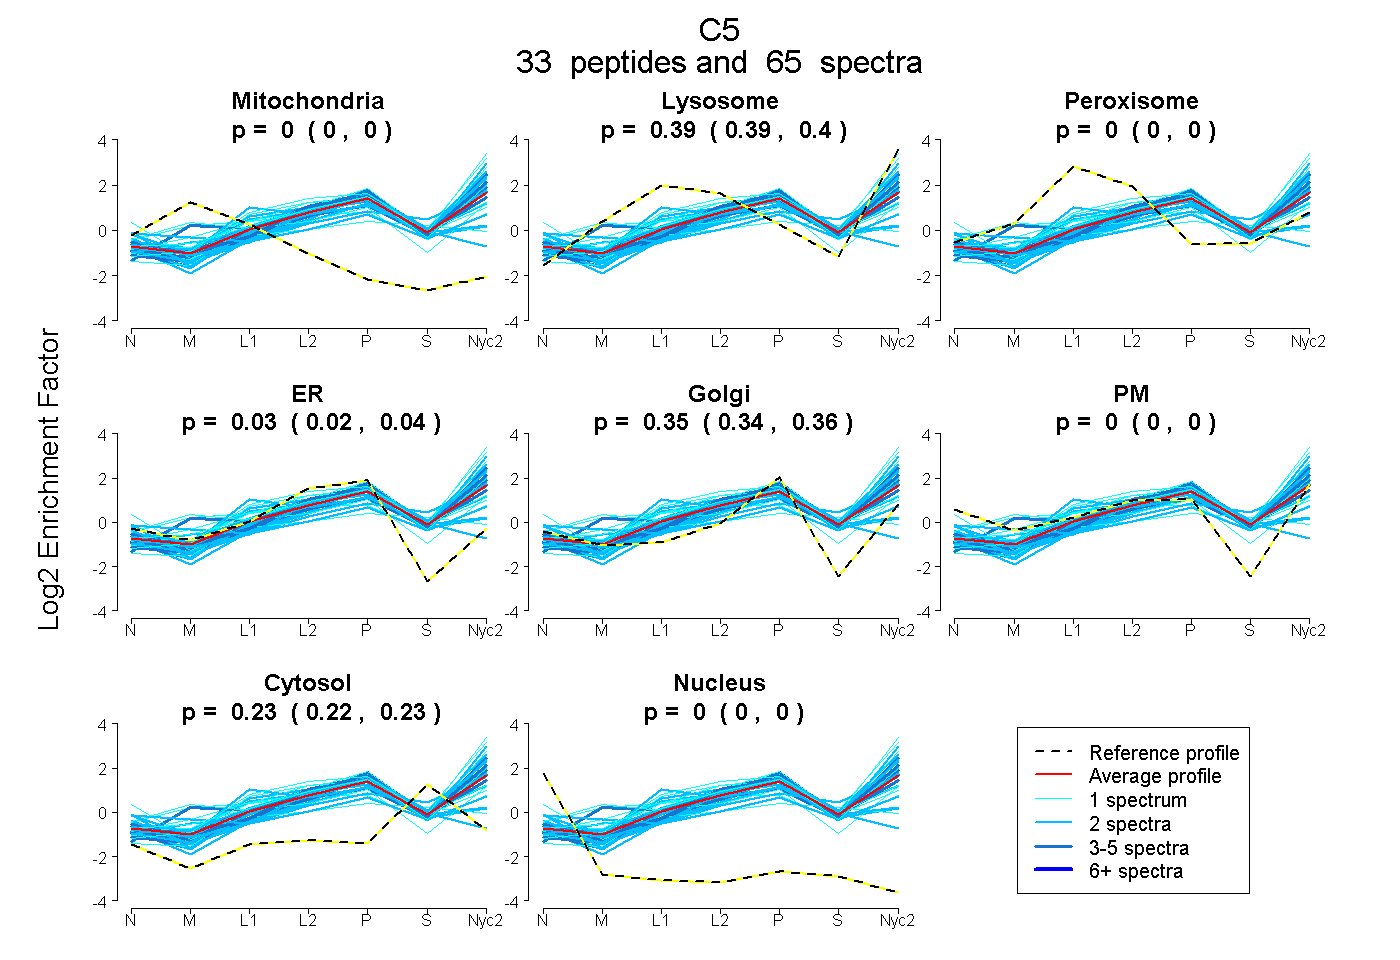 |
0.000
0.000 | 0.000 |
0.392
0.386 | 0.397 |
|
0.000
0.000 | 0.000 |
0.031
0.019 | 0.043 |
0.351
0.340 | 0.361 |
0.000
0.000 | 0.000 |
0.225
0.222 | 0.228 |
0.000
0.000 | 0.000 |
|
| | | Plot |
Mito |
|
Lyso or Perox |
|
ER |
Golgi |
PM |
Cytosol |
Nucleus |
|
| Expt B |
12
peptides |
18
spectra |
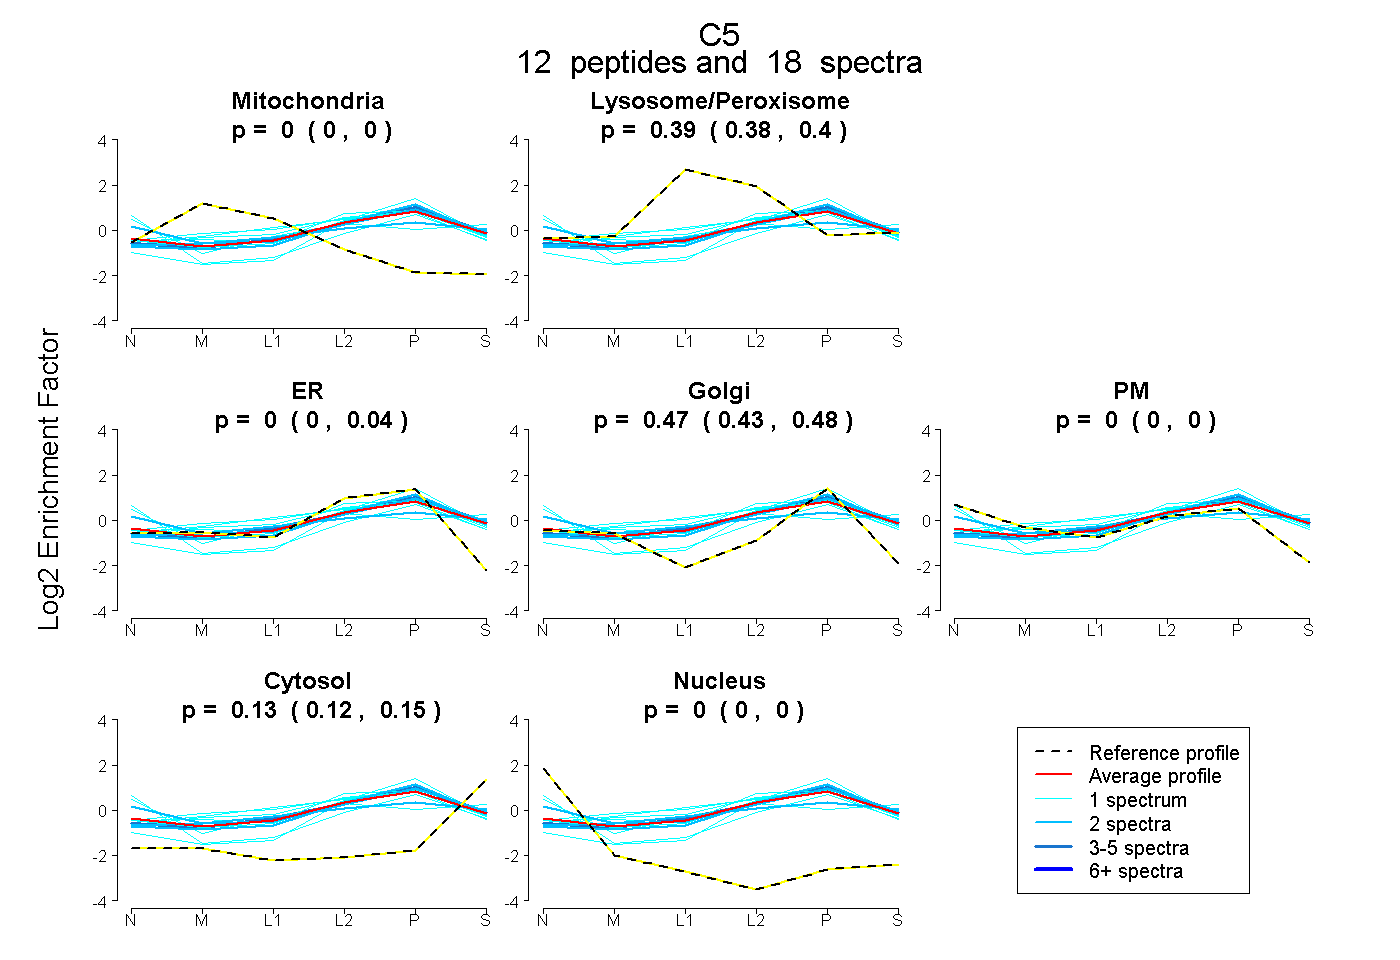 |
0.000
0.000 | 0.000 |
|
0.393
0.375 | 0.398 |
|
0.000
0.000 | 0.035 |
0.474
0.434 | 0.481 |
0.000
0.000 | 0.000 |
0.133
0.125 | 0.145 |
0.000
0.000 | 0.000 |
|
| | | Plot |
|
Lyso |
|
|
|
|
|
|
|
Other |
| Expt C |
49
peptides |
231
spectra |
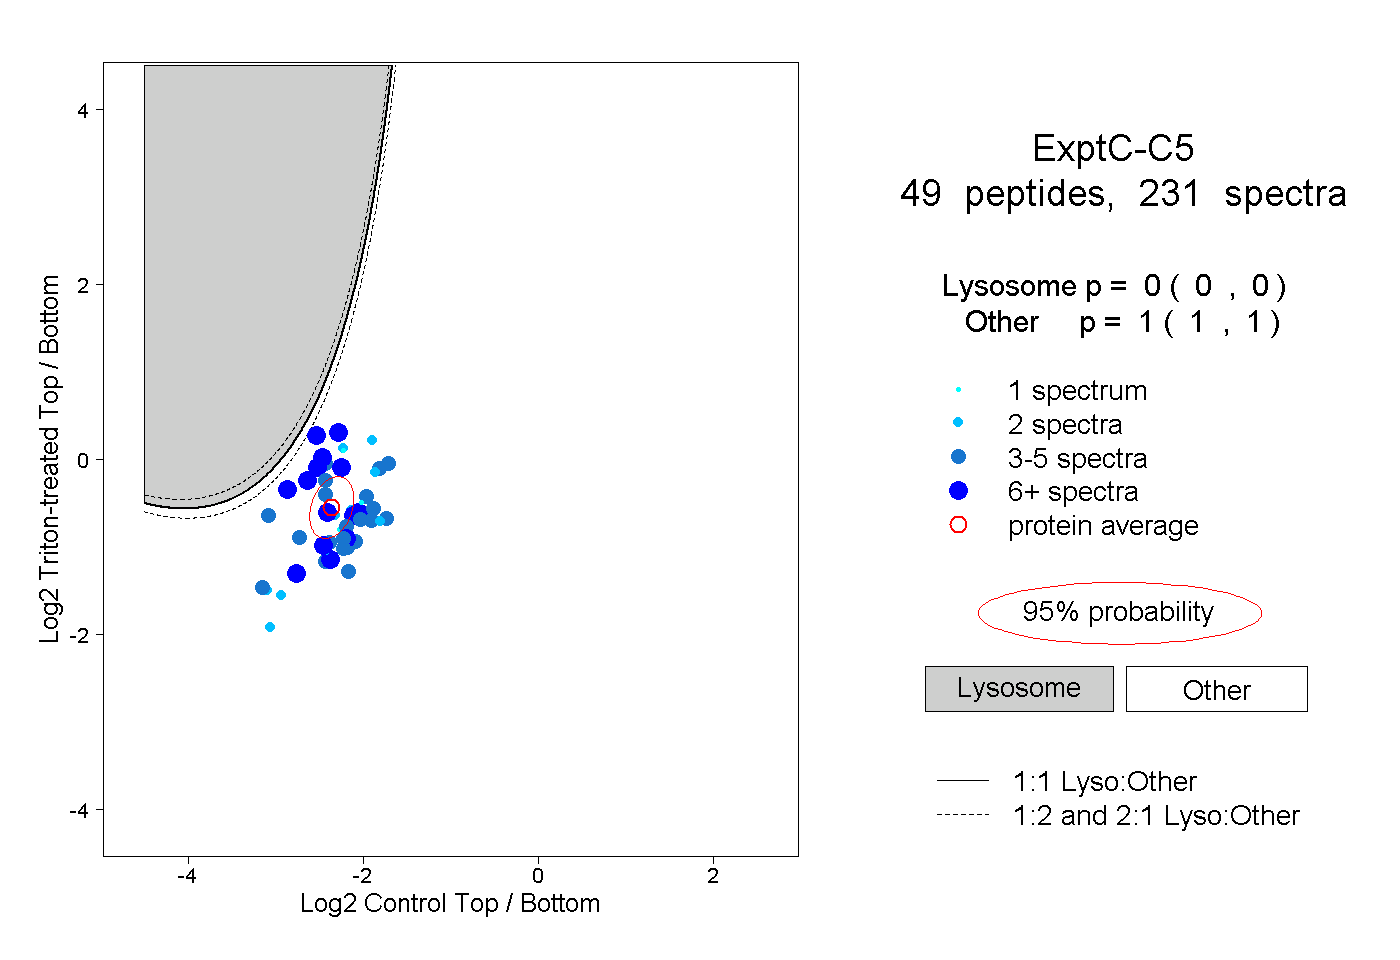 |
|
0.000
0.000 | 0.000 |
|
|
|
|
|
|
|
1.000
1.000 | 1.000 |
| | | Plot |
|
Lyso |
|
|
|
|
|
|
|
Other |
| Expt D |
10
peptides |
17
spectra |
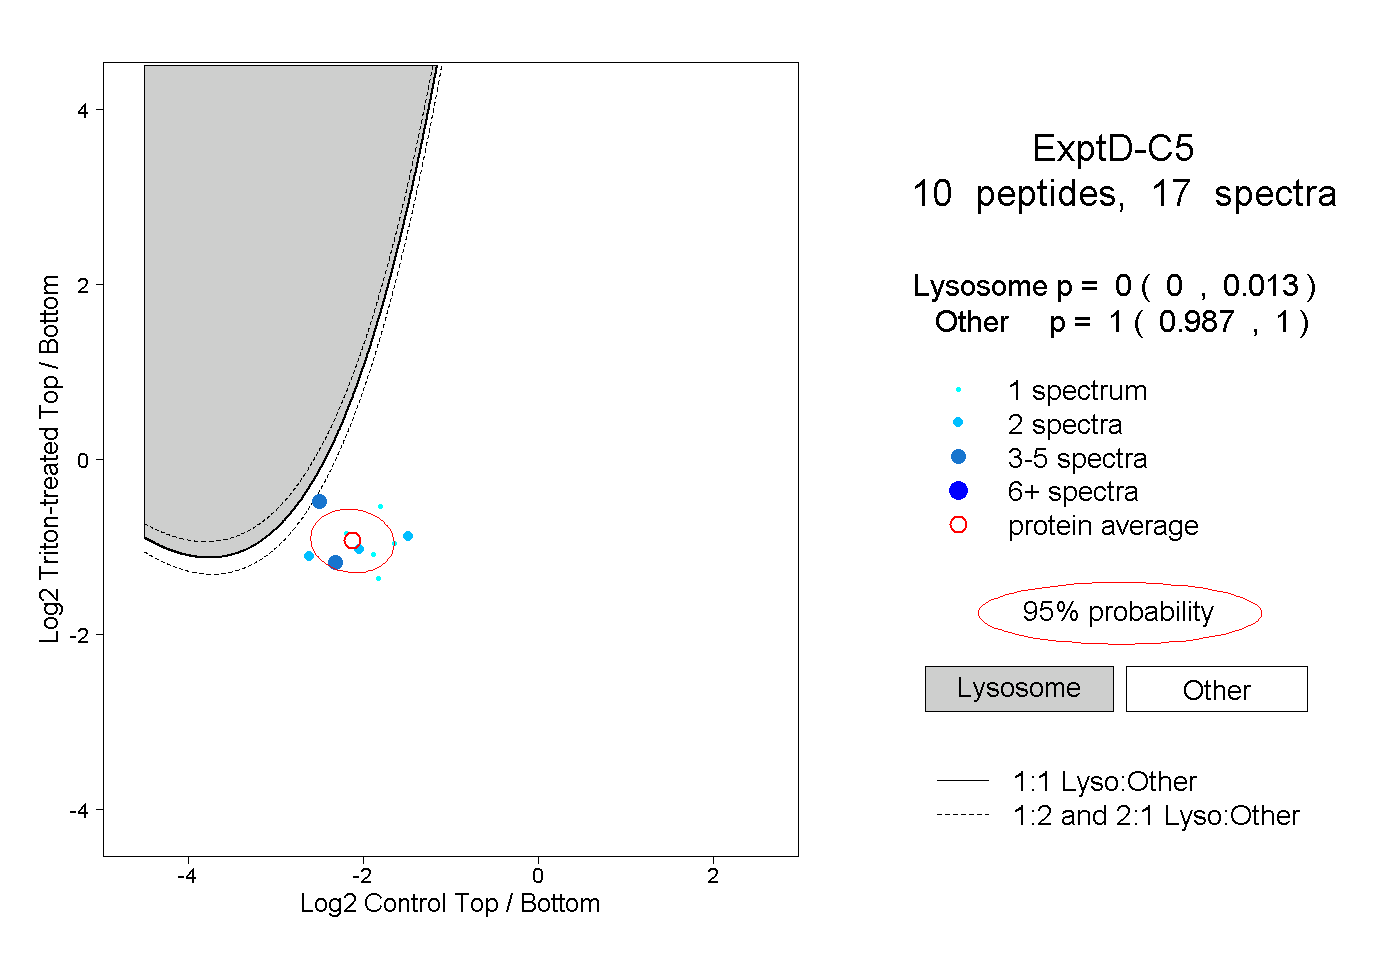 |
|
0.000
0.000 | 0.013 |
|
|
|
|
|
|
|
1.000
0.987 | 1.000 |
| 2 spectra, GVYGIVNR |
|
0.000 |
|
|
|
|
|
|
|
1.000 |
| 3 spectra, NFEITVK |
|
0.000 |
|
|
|
|
|
|
|
1.000 |
| 1 spectrum, IVQYGTK |
|
0.001 |
|
|
|
|
|
|
|
0.999 |
| 1 spectrum, ITSATEENIFVK |
|
0.000 |
|
|
|
|
|
|
|
1.000 |
| 2 spectra, EYVLPR |
|
0.009 |
|
|
|
|
|
|
|
0.991 |
| 1 spectrum, VTIGPHCIR |
|
0.000 |
|
|
|
|
|
|
|
1.000 |
| 1 spectrum, DFLCVR |
|
0.000 |
|
|
|
|
|
|
|
1.000 |
| 1 spectrum, IPLDLVPK |
|
0.000 |
|
|
|
|
|
|
|
1.000 |
| 2 spectra, TSVAEEFCSFYLK |
|
0.000 |
|
|
|
|
|
|
|
1.000 |
| 3 spectra, VFQAFDDK |
|
0.111 |
|
|
|
|
|
|
|
0.889 |