 33
33peptides
spectra
0.000 | 0.000
0.386 | 0.397
0.000 | 0.000
0.019 | 0.043
0.340 | 0.361
0.000 | 0.000
0.222 | 0.228
0.000 | 0.000
| Plot | Mito | Lyso | Perox | ER | Golgi | PM | Cytosol | Nucleus | |||||
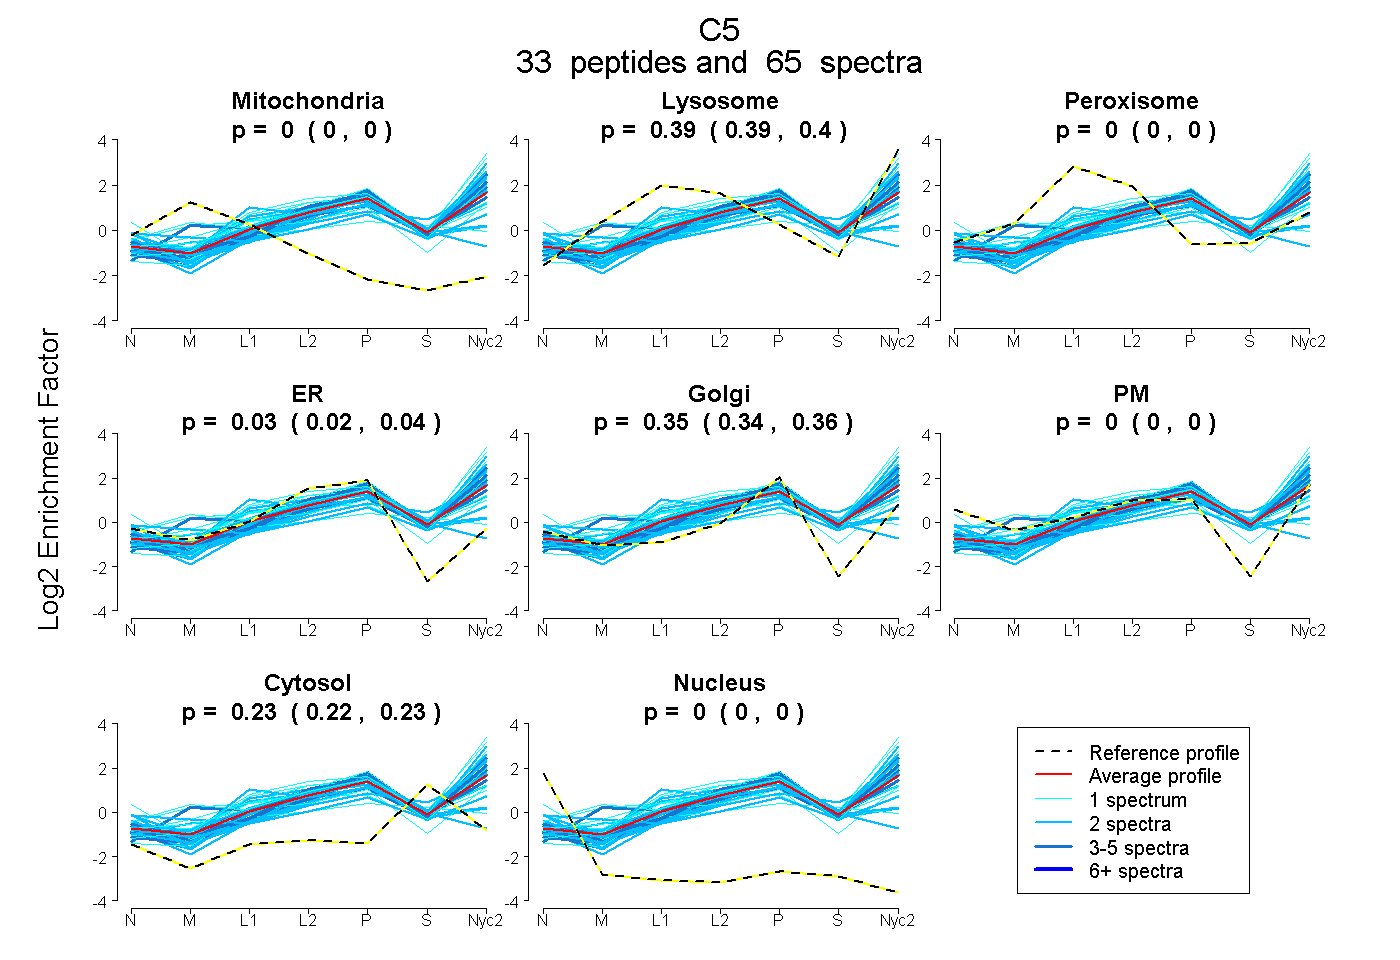
| Expt A |
33 peptides |
65 spectra |
|
0.000 0.000 | 0.000 |
0.392 0.386 | 0.397 |
0.000 0.000 | 0.000 |
0.031 0.019 | 0.043 |
0.351 0.340 | 0.361 |
0.000 0.000 | 0.000 |
0.225 0.222 | 0.228 |
0.000 0.000 | 0.000 |
| 2 spectra, ALLPVMK | 0.000 | 0.345 | 0.000 | 0.000 | 0.442 | 0.000 | 0.213 | 0.000 | ||
| 2 spectra, VLGQVNK | 0.000 | 0.043 | 0.090 | 0.000 | 0.200 | 0.348 | 0.318 | 0.000 | ||
| 4 spectra, GMLLGR | 0.000 | 0.301 | 0.000 | 0.000 | 0.460 | 0.000 | 0.238 | 0.000 | ||
| 2 spectra, EYVLPR | 0.000 | 0.602 | 0.000 | 0.000 | 0.327 | 0.000 | 0.071 | 0.000 | ||
| 2 spectra, VCEGAACK | 0.000 | 0.000 | 0.311 | 0.407 | 0.000 | 0.000 | 0.282 | 0.000 | ||
| 1 spectrum, QCTMIYSTSDTNLQR | 0.000 | 0.000 | 0.105 | 0.109 | 0.000 | 0.318 | 0.467 | 0.000 | ||
| 3 spectra, EGIDILTHLPK | 0.000 | 0.400 | 0.000 | 0.001 | 0.373 | 0.000 | 0.226 | 0.000 | ||
| 2 spectra, ADSFLLER | 0.000 | 0.375 | 0.000 | 0.000 | 0.433 | 0.000 | 0.192 | 0.000 | ||
| 2 spectra, SDLGCGAGGGR | 0.000 | 0.383 | 0.000 | 0.000 | 0.370 | 0.000 | 0.247 | 0.000 | ||
| 3 spectra, HNFSFK | 0.000 | 0.420 | 0.000 | 0.032 | 0.365 | 0.000 | 0.183 | 0.000 | ||
| 4 spectra, GTVYNYR | 0.000 | 0.389 | 0.000 | 0.085 | 0.275 | 0.050 | 0.201 | 0.000 | ||
| 2 spectra, GDPPIYR | 0.000 | 0.249 | 0.000 | 0.015 | 0.452 | 0.000 | 0.283 | 0.000 | ||
| 2 spectra, WLSEEQR | 0.000 | 0.484 | 0.000 | 0.000 | 0.322 | 0.000 | 0.194 | 0.000 | ||
| 1 spectrum, TSGTMFCVK | 0.000 | 0.405 | 0.000 | 0.357 | 0.000 | 0.000 | 0.239 | 0.000 | ||
| 2 spectra, DFLCVR | 0.000 | 0.094 | 0.146 | 0.470 | 0.042 | 0.000 | 0.248 | 0.000 | ||
| 3 spectra, GVYGIVNR | 0.000 | 0.373 | 0.000 | 0.000 | 0.384 | 0.000 | 0.243 | 0.000 | ||
| 2 spectra, DLQLLHQK | 0.000 | 0.288 | 0.000 | 0.000 | 0.443 | 0.000 | 0.269 | 0.000 | ||
| 1 spectrum, IPSNPK | 0.000 | 0.598 | 0.000 | 0.000 | 0.294 | 0.000 | 0.108 | 0.000 | ||
| 1 spectrum, MSAVEGICTPGSSAASPQTSR | 0.000 | 0.301 | 0.000 | 0.305 | 0.128 | 0.000 | 0.267 | 0.000 | ||
| 2 spectra, ITSATEENIFVK | 0.000 | 0.415 | 0.000 | 0.000 | 0.328 | 0.000 | 0.257 | 0.000 | ||
| 2 spectra, IVQYGTK | 0.000 | 0.276 | 0.000 | 0.000 | 0.178 | 0.149 | 0.397 | 0.000 | ||
| 1 spectrum, FSVSIEPESNFIGYK | 0.000 | 0.659 | 0.000 | 0.000 | 0.208 | 0.000 | 0.133 | 0.000 | ||
| 1 spectrum, EGLVSVMSYR | 0.000 | 0.391 | 0.000 | 0.000 | 0.400 | 0.000 | 0.209 | 0.000 | ||
| 2 spectra, TDAPELPEENQASK | 0.000 | 0.311 | 0.000 | 0.000 | 0.263 | 0.231 | 0.195 | 0.000 | ||
| 2 spectra, GASSSAWLTAFALR | 0.000 | 0.351 | 0.000 | 0.000 | 0.459 | 0.000 | 0.190 | 0.000 | ||
| 3 spectra, ITHYNYLILSK | 0.000 | 0.579 | 0.000 | 0.000 | 0.260 | 0.000 | 0.161 | 0.000 | ||
| 2 spectra, DVFLEMNIPYSVVR | 0.000 | 0.567 | 0.000 | 0.000 | 0.254 | 0.000 | 0.179 | 0.000 | ||
| 1 spectrum, YGVWTIK | 0.000 | 0.711 | 0.000 | 0.000 | 0.212 | 0.000 | 0.077 | 0.000 | ||
| 2 spectra, VTIGPHCIR | 0.000 | 0.129 | 0.000 | 0.460 | 0.074 | 0.000 | 0.337 | 0.000 | ||
| 1 spectrum, ETSYVNPIIK | 0.000 | 0.084 | 0.395 | 0.000 | 0.384 | 0.000 | 0.137 | 0.000 | ||
| 1 spectrum, SIVSALK | 0.069 | 0.237 | 0.119 | 0.000 | 0.417 | 0.077 | 0.081 | 0.000 | ||
| 1 spectrum, YTATLLDIYK | 0.000 | 0.465 | 0.000 | 0.005 | 0.388 | 0.000 | 0.143 | 0.000 | ||
| 3 spectra, VFQAFDDK | 0.000 | 0.414 | 0.000 | 0.000 | 0.405 | 0.000 | 0.181 | 0.000 |
| Plot | Mito | Lyso or Perox | ER | Golgi | PM | Cytosol | Nucleus | ||||||
| Expt B |
12 peptides |
18 spectra |
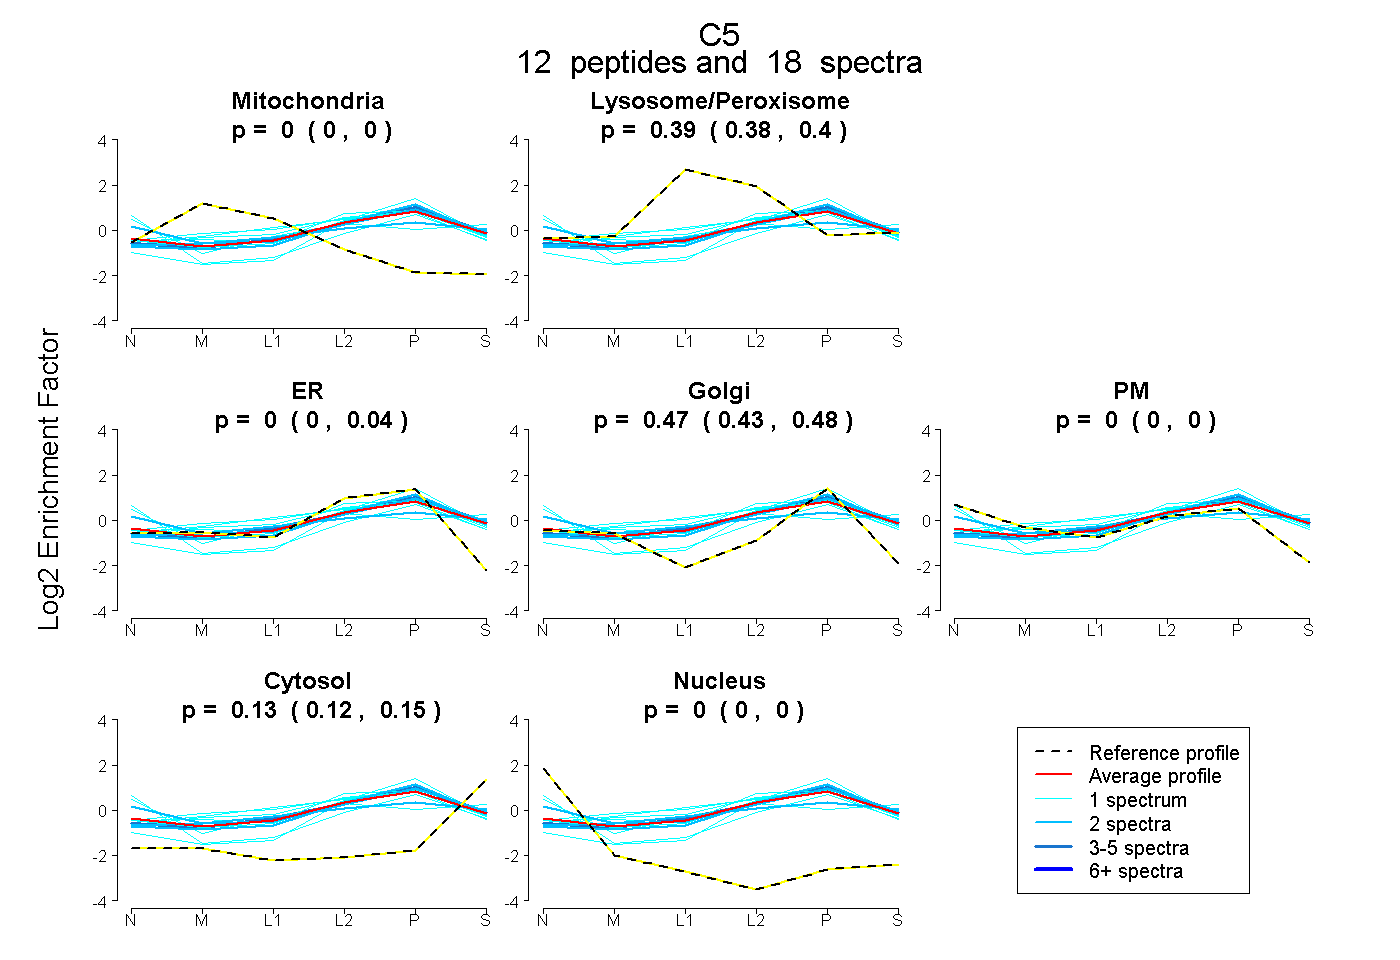 |
0.000 0.000 | 0.000 |
0.393 0.375 | 0.398 |
0.000 0.000 | 0.035 |
0.474 0.434 | 0.481 |
0.000 0.000 | 0.000 |
0.133 0.125 | 0.145 |
0.000 0.000 | 0.000 |
|||
| Plot | Lyso | Other | |||||||||||
| Expt C |
49 peptides |
231 spectra |
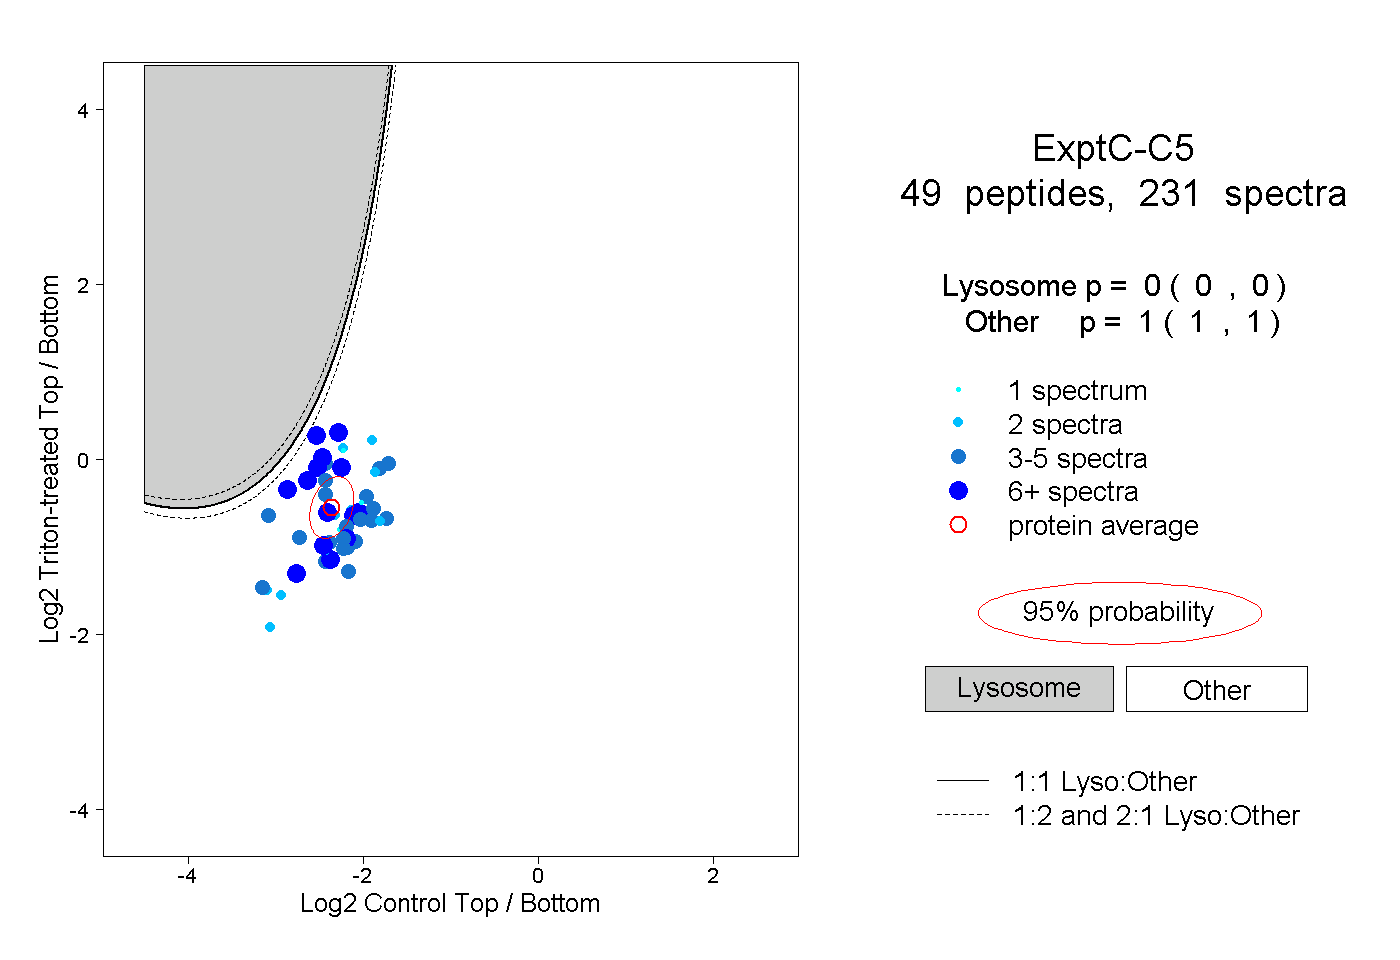 |
0.000 0.000 | 0.000 |
1.000 1.000 | 1.000 |
||||||||
| Plot | Lyso | Other | |||||||||||
| Expt D |
10 peptides |
17 spectra |
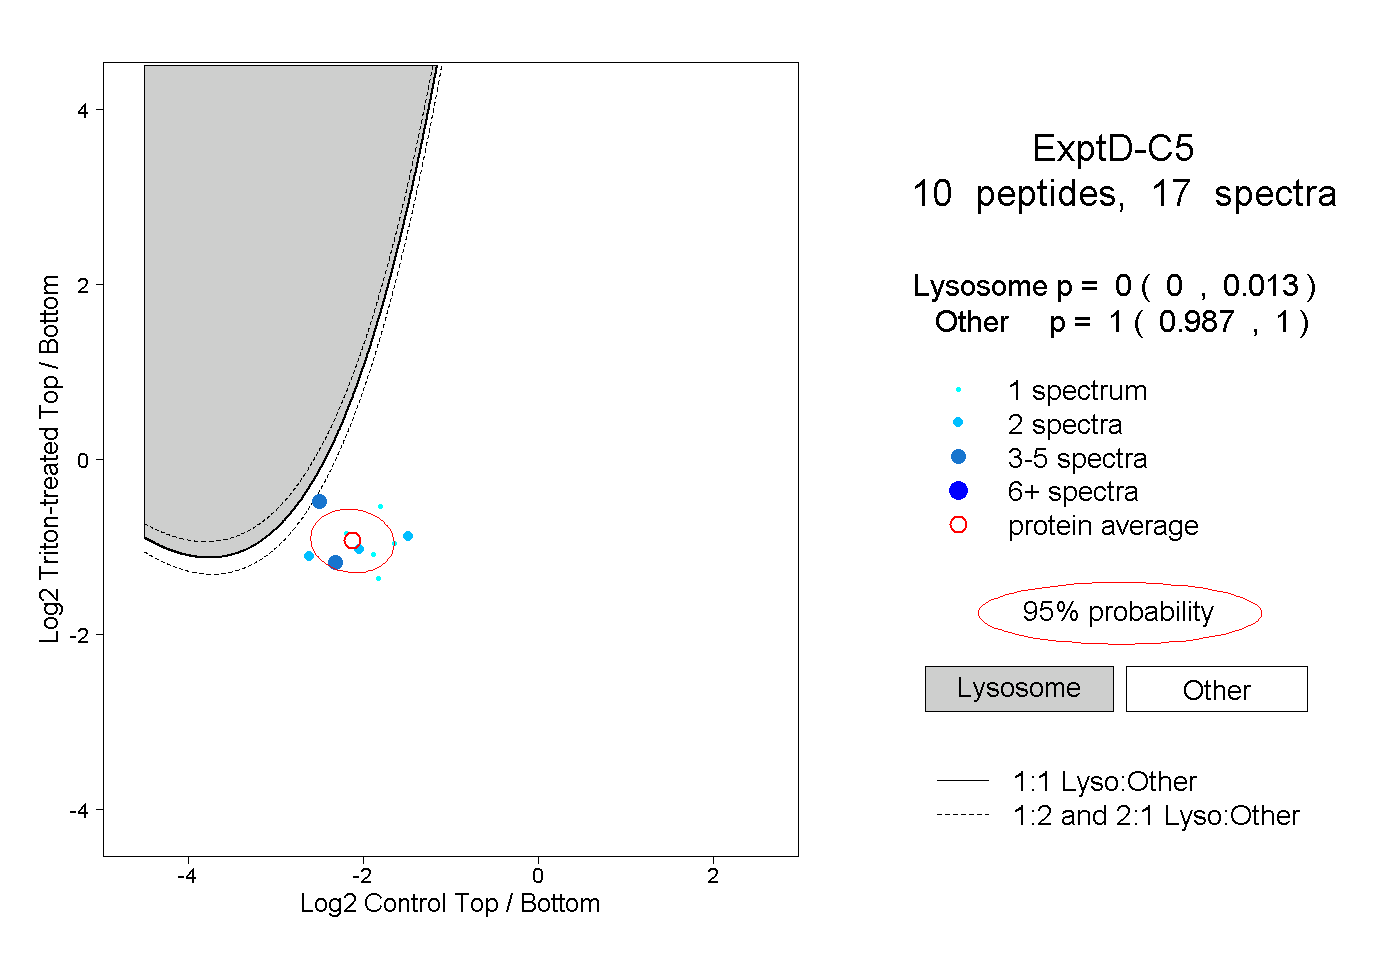 |
0.000 0.000 | 0.013 |
1.000 0.987 | 1.000 |