 14
14peptides
spectra
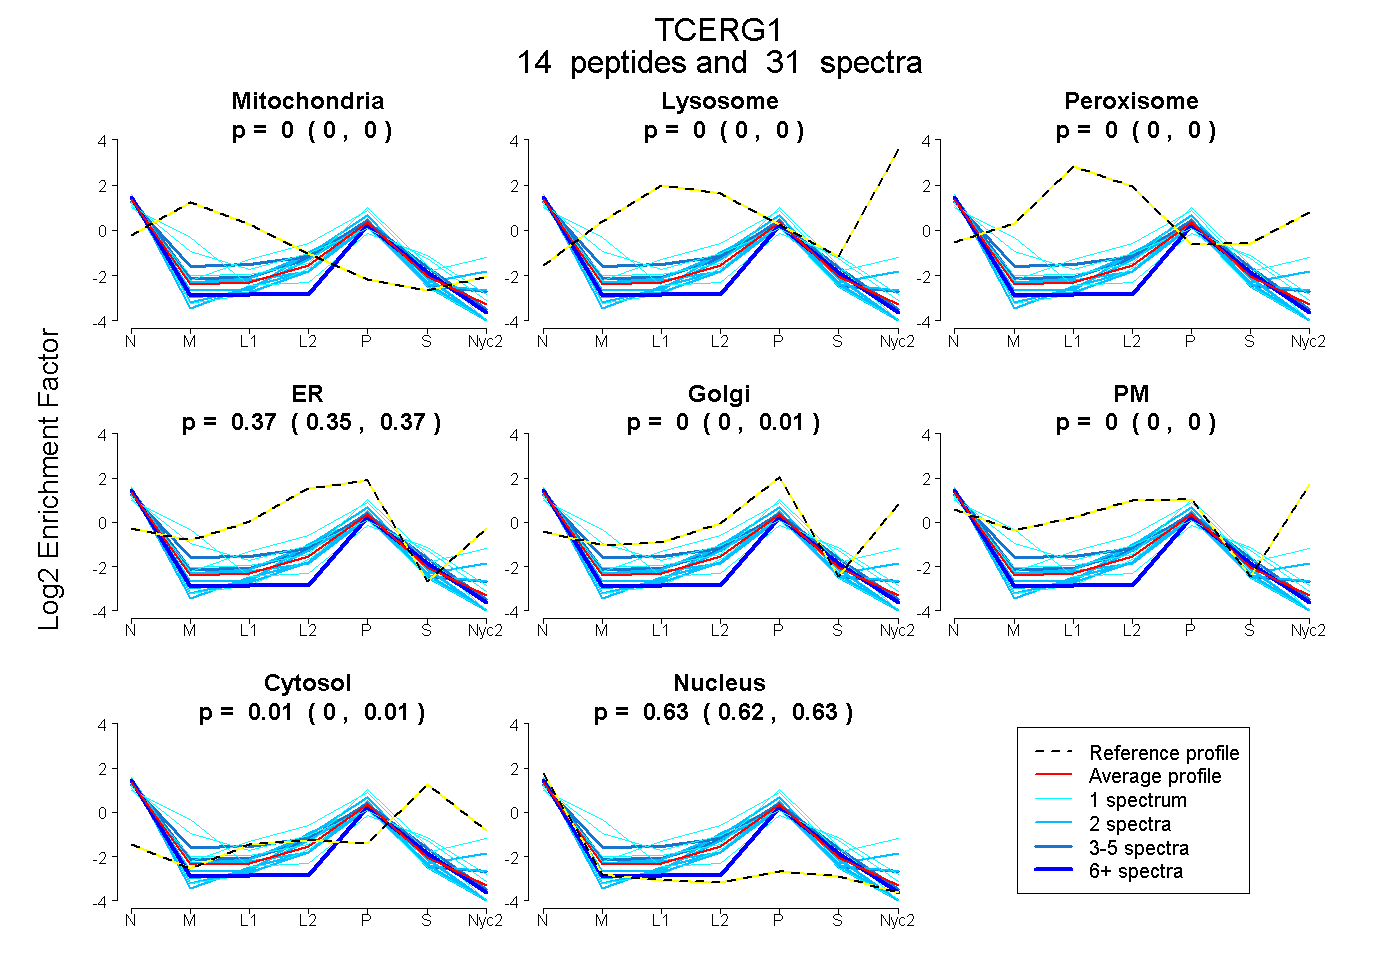
0.000 | 0.000
0.000 | 0.000
0.000 | 0.000
0.354 | 0.372
0.000 | 0.008
0.000 | 0.000
0.001 | 0.015
0.618 | 0.631
4peptides
spectra
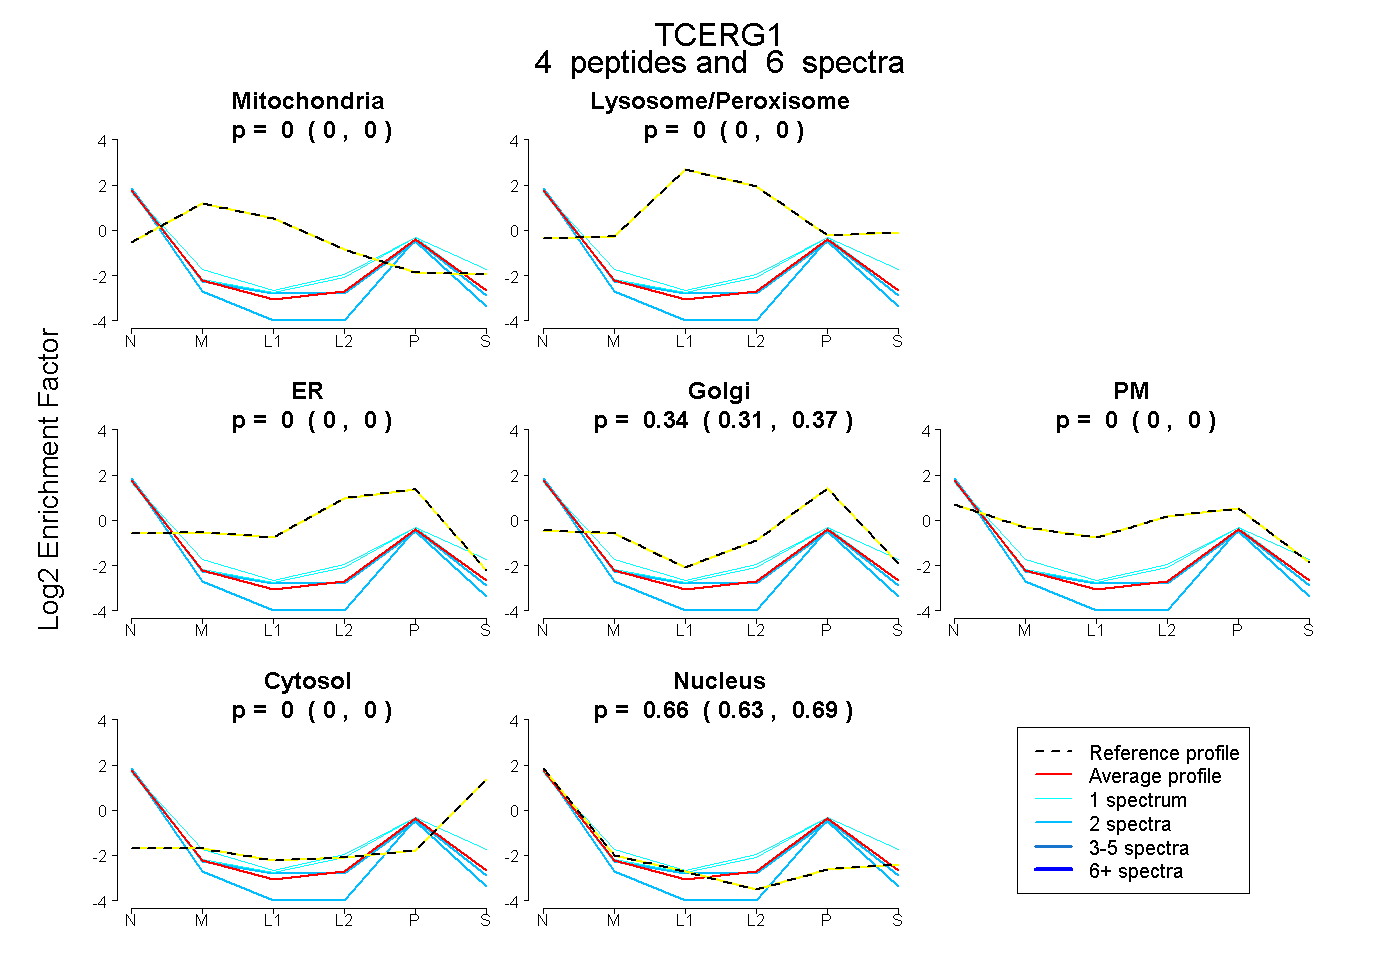
0.000 | 0.000
0.000 | 0.000
0.000 | 0.000
0.308 | 0.366
0.000 | 0.000
0.000 | 0.000
0.628 | 0.688
3peptides
spectra
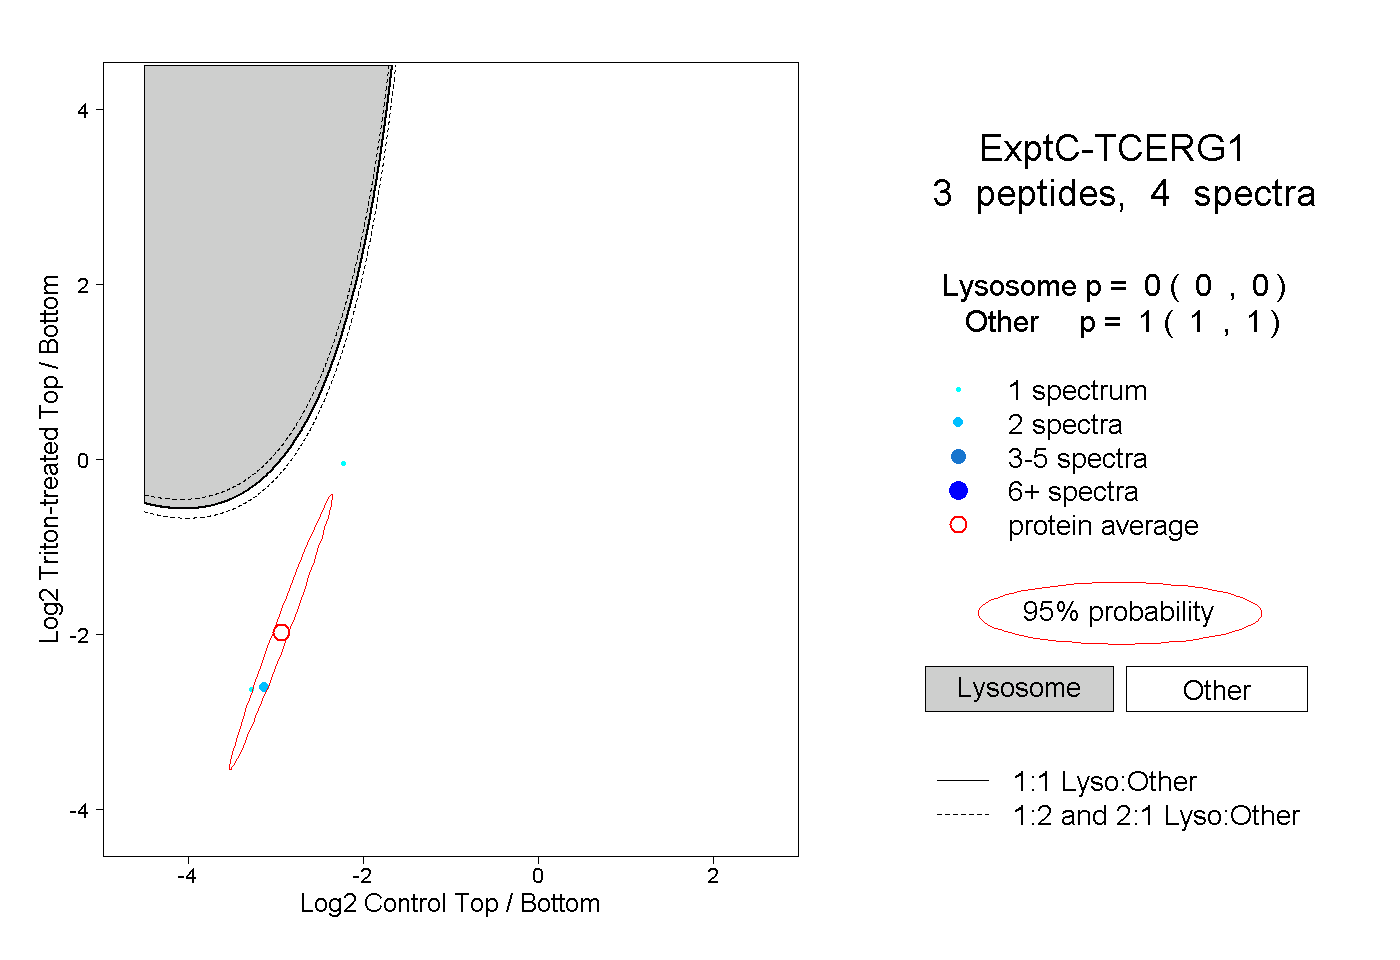
0.000 | 0.000
1.000 | 1.000