 14
14peptides
spectra
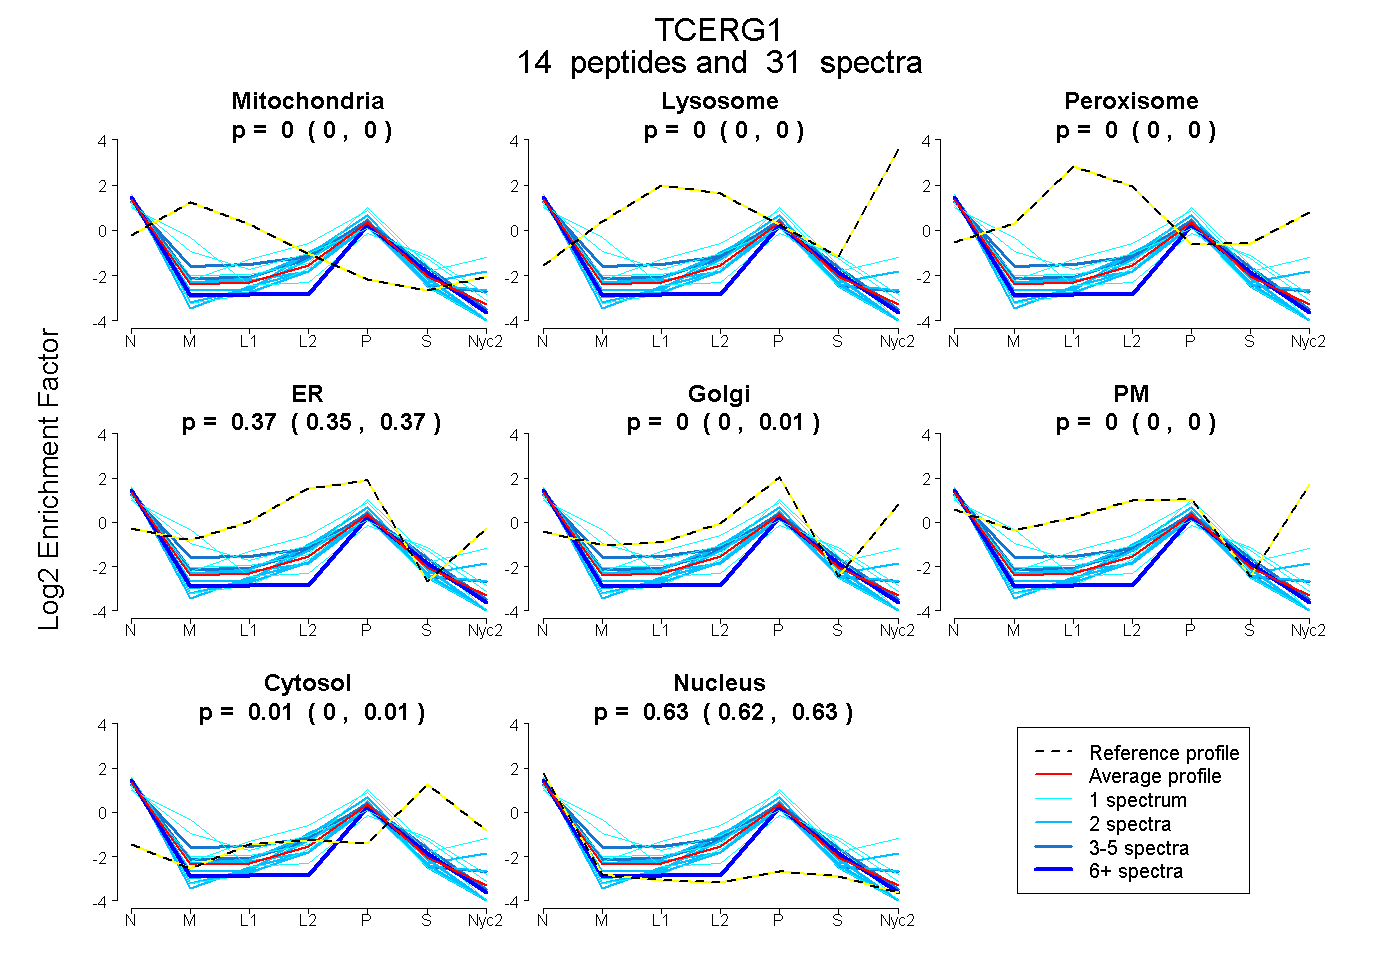
0.000 | 0.000
0.000 | 0.000
0.000 | 0.000
0.354 | 0.372
0.000 | 0.008
0.000 | 0.000
0.001 | 0.015
0.618 | 0.631
| Plot | Mito | Lyso | Perox | ER | Golgi | PM | Cytosol | Nucleus | |||||
| Expt A |
14 peptides |
31 spectra |
|
0.000 0.000 | 0.000 |
0.000 0.000 | 0.000 |
0.000 0.000 | 0.000 |
0.366 0.354 | 0.372 |
0.000 0.000 | 0.008 |
0.000 0.000 | 0.000 |
0.009 0.001 | 0.015 |
0.625 0.618 | 0.631 |
| 1 spectrum, GPPPPPTASEPTR | 0.000 | 0.000 | 0.000 | 0.265 | 0.000 | 0.000 | 0.000 | 0.735 | ||
| 4 spectra, EAAMEAEIK | 0.000 | 0.000 | 0.000 | 0.421 | 0.000 | 0.000 | 0.043 | 0.536 | ||
| 2 spectra, AIVPLEAR | 0.000 | 0.000 | 0.000 | 0.285 | 0.000 | 0.000 | 0.000 | 0.715 | ||
| 2 spectra, EFEEYIR | 0.000 | 0.000 | 0.000 | 0.306 | 0.000 | 0.000 | 0.000 | 0.694 | ||
| 2 spectra, LIVAYVDDLDR | 0.000 | 0.000 | 0.000 | 0.273 | 0.000 | 0.000 | 0.000 | 0.727 | ||
| 1 spectrum, YLLLNPK | 0.071 | 0.000 | 0.000 | 0.370 | 0.000 | 0.000 | 0.113 | 0.446 | ||
| 1 spectrum, MMEEAK | 0.000 | 0.000 | 0.000 | 0.313 | 0.296 | 0.000 | 0.065 | 0.326 | ||
| 1 spectrum, LSMWDRPDDLIGR | 0.193 | 0.000 | 0.000 | 0.000 | 0.231 | 0.000 | 0.126 | 0.449 | ||
| 3 spectra, ALLSDMVR | 0.000 | 0.000 | 0.000 | 0.386 | 0.053 | 0.000 | 0.000 | 0.562 | ||
| 2 spectra, AVDSSSMR | 0.000 | 0.000 | 0.000 | 0.399 | 0.000 | 0.000 | 0.000 | 0.601 | ||
| 1 spectrum, TLESTWEKPQELK | 0.000 | 0.000 | 0.000 | 0.398 | 0.000 | 0.000 | 0.040 | 0.562 | ||
| 7 spectra, VFFYNPTTR | 0.000 | 0.000 | 0.000 | 0.000 | 0.231 | 0.000 | 0.030 | 0.739 | ||
| 2 spectra, EALFNEFVAAAR | 0.000 | 0.000 | 0.000 | 0.245 | 0.139 | 0.000 | 0.000 | 0.616 | ||
| 2 spectra, ATFSEFAAK | 0.000 | 0.000 | 0.000 | 0.133 | 0.339 | 0.000 | 0.000 | 0.528 |
| Plot | Mito | Lyso or Perox | ER | Golgi | PM | Cytosol | Nucleus | ||||||
| Expt B |
4 peptides |
6 spectra |
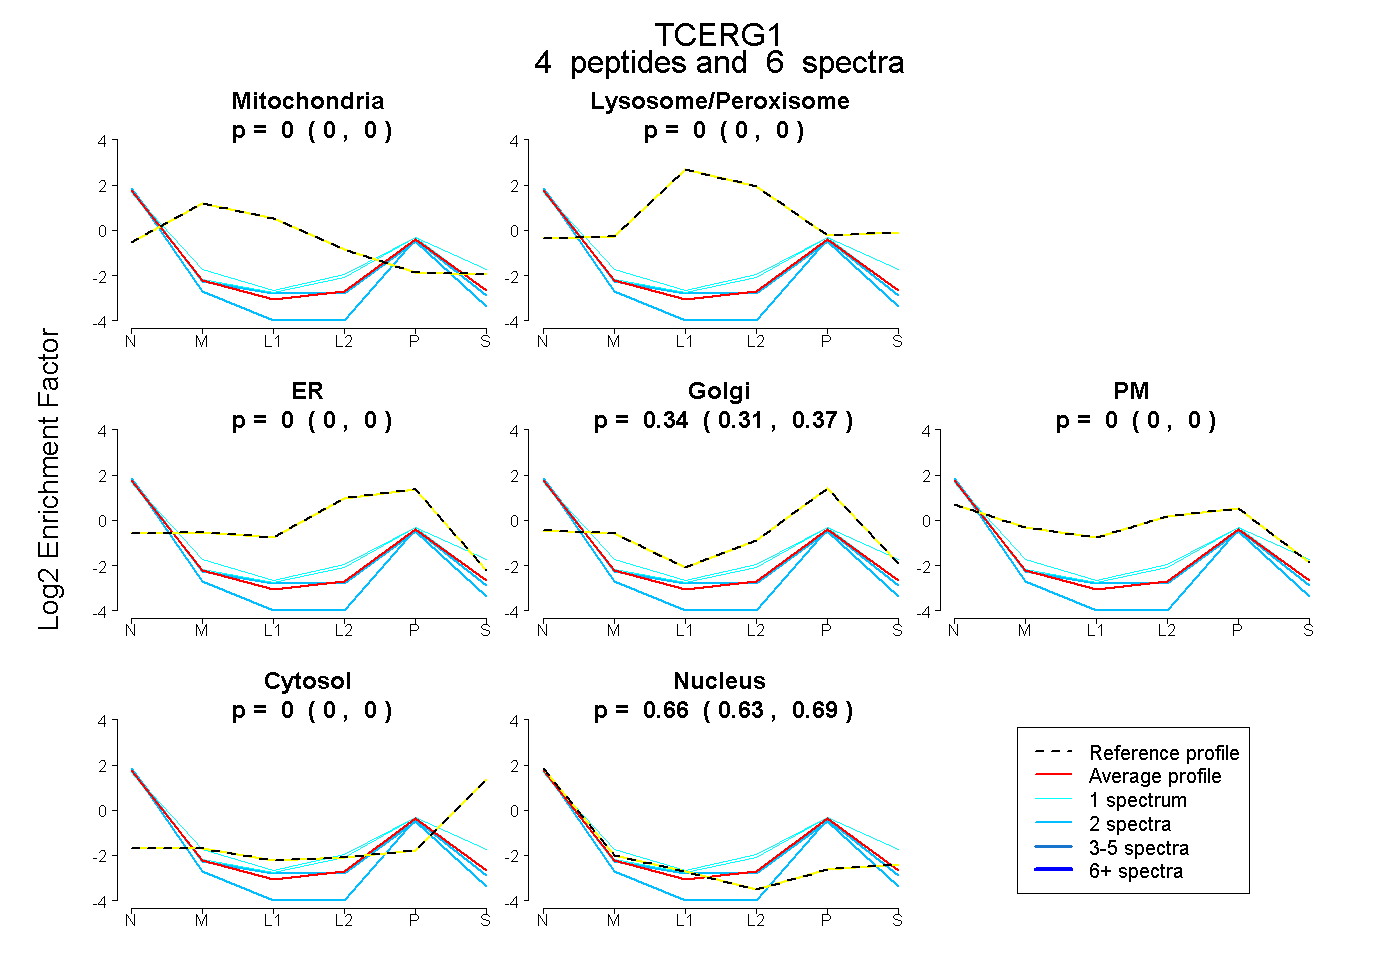 |
0.000 0.000 | 0.000 |
0.000 0.000 | 0.000 |
0.000 0.000 | 0.000 |
0.340 0.308 | 0.366 |
0.000 0.000 | 0.000 |
0.000 0.000 | 0.000 |
0.660 0.628 | 0.688 |
|||
| Plot | Lyso | Other | |||||||||||
| Expt C |
3 peptides |
4 spectra |
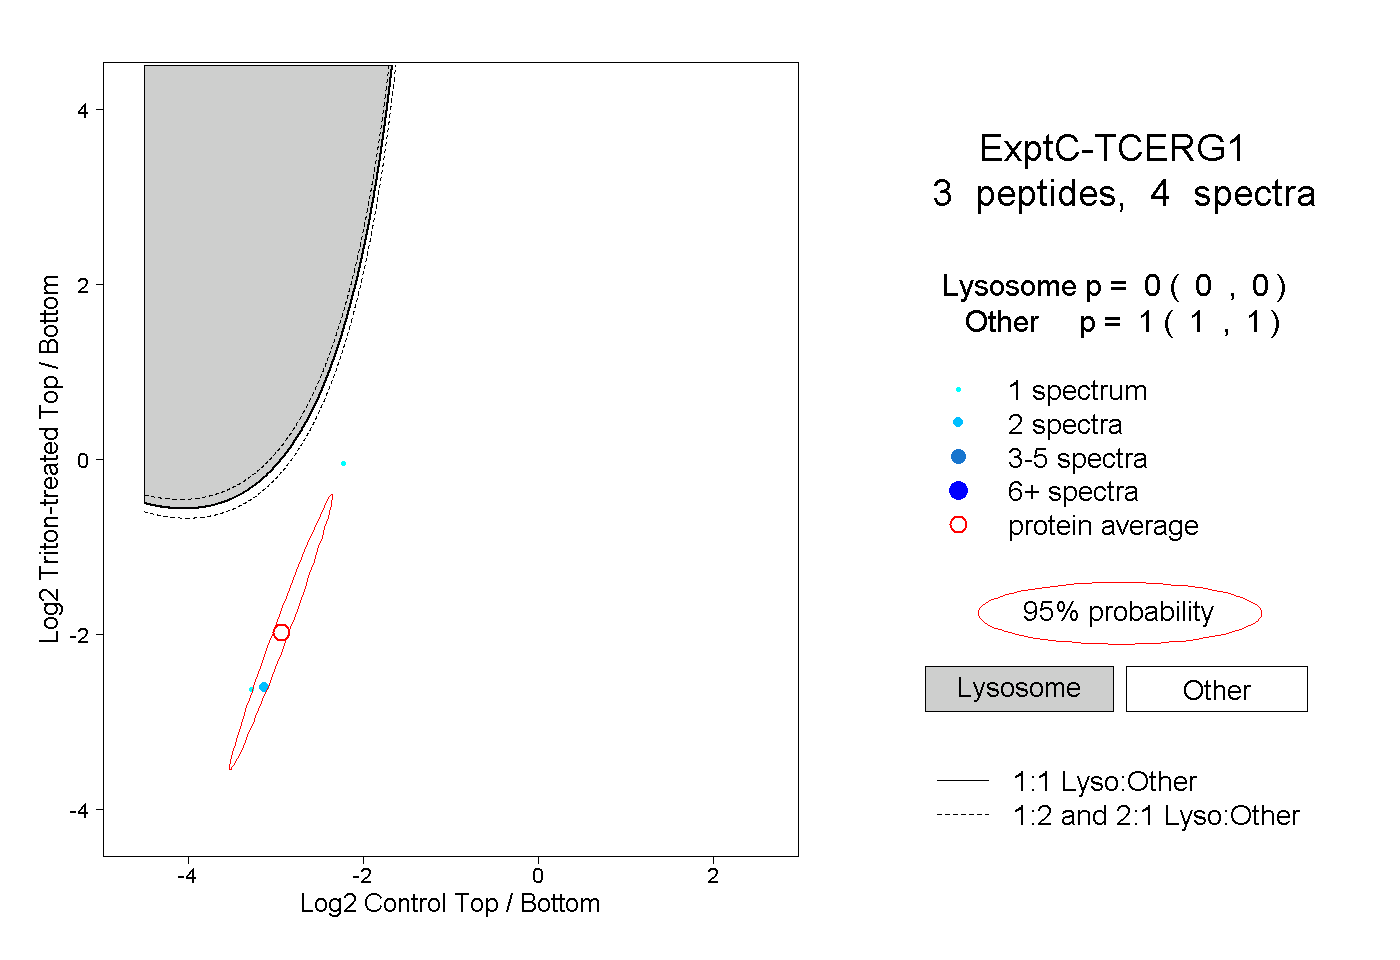 |
0.000 0.000 | 0.000 |
1.000 1.000 | 1.000 |