TCERG1
[ENSRNOP00000025467]
Main page
| | | Plot |
Mito |
Lyso |
|
Perox |
ER |
Golgi |
PM |
Cytosol |
Nucleus |
|
| Expt A |
 14
14
peptides |
31
spectra |
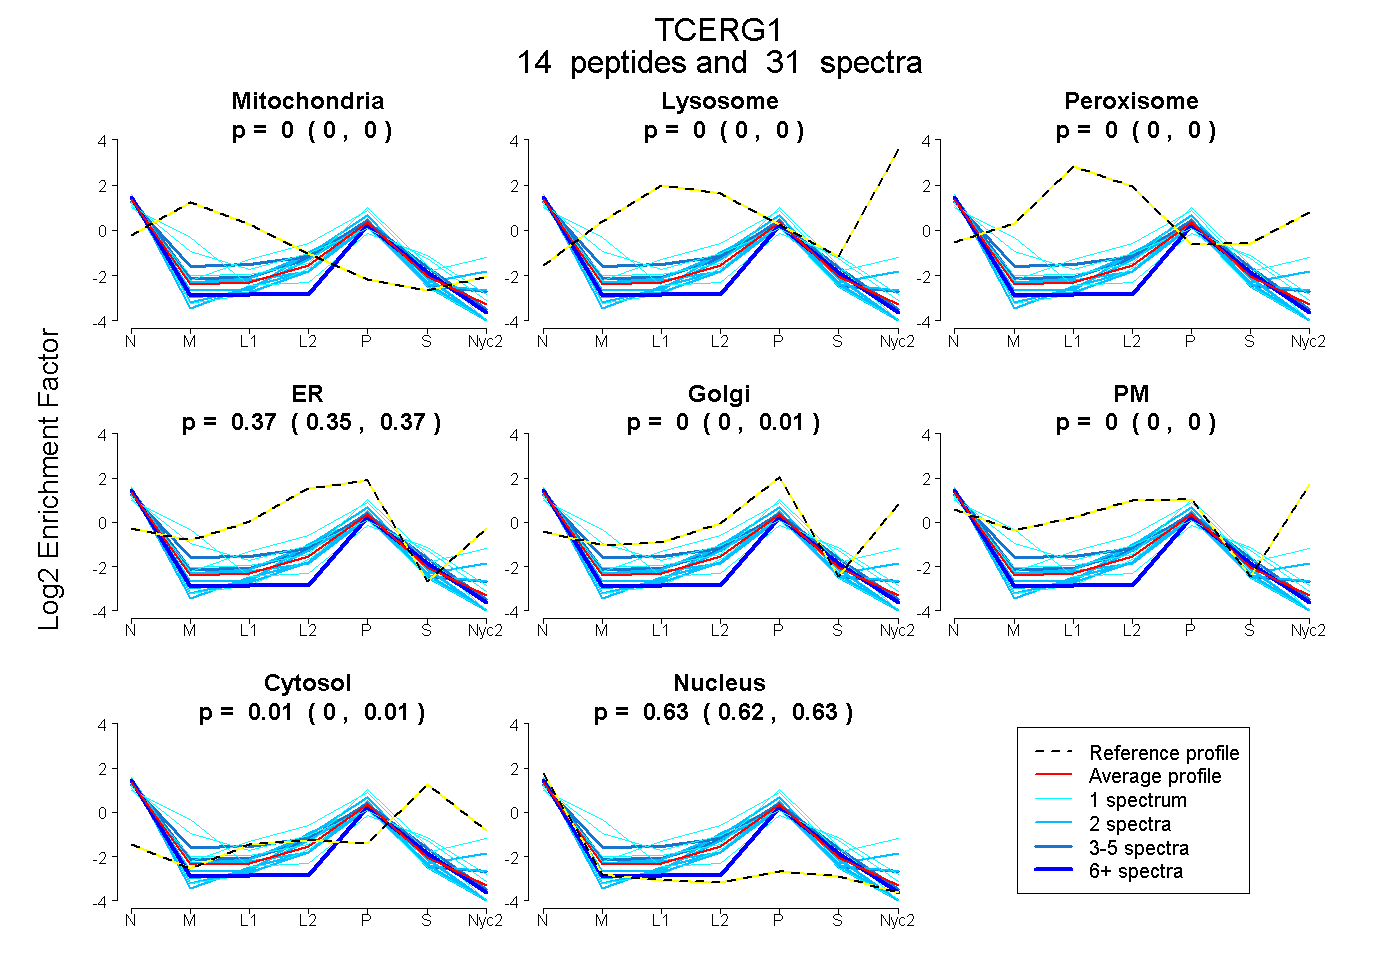 |
0.000
0.000 | 0.000 |
0.000
0.000 | 0.000 |
|
0.000
0.000 | 0.000 |
0.366
0.354 | 0.372 |
0.000
0.000 | 0.008 |
0.000
0.000 | 0.000 |
0.009
0.001 | 0.015 |
0.625
0.618 | 0.631 |
|
| | | Plot |
Mito |
|
Lyso or Perox |
|
ER |
Golgi |
PM |
Cytosol |
Nucleus |
|
| Expt B |
4
peptides |
6
spectra |
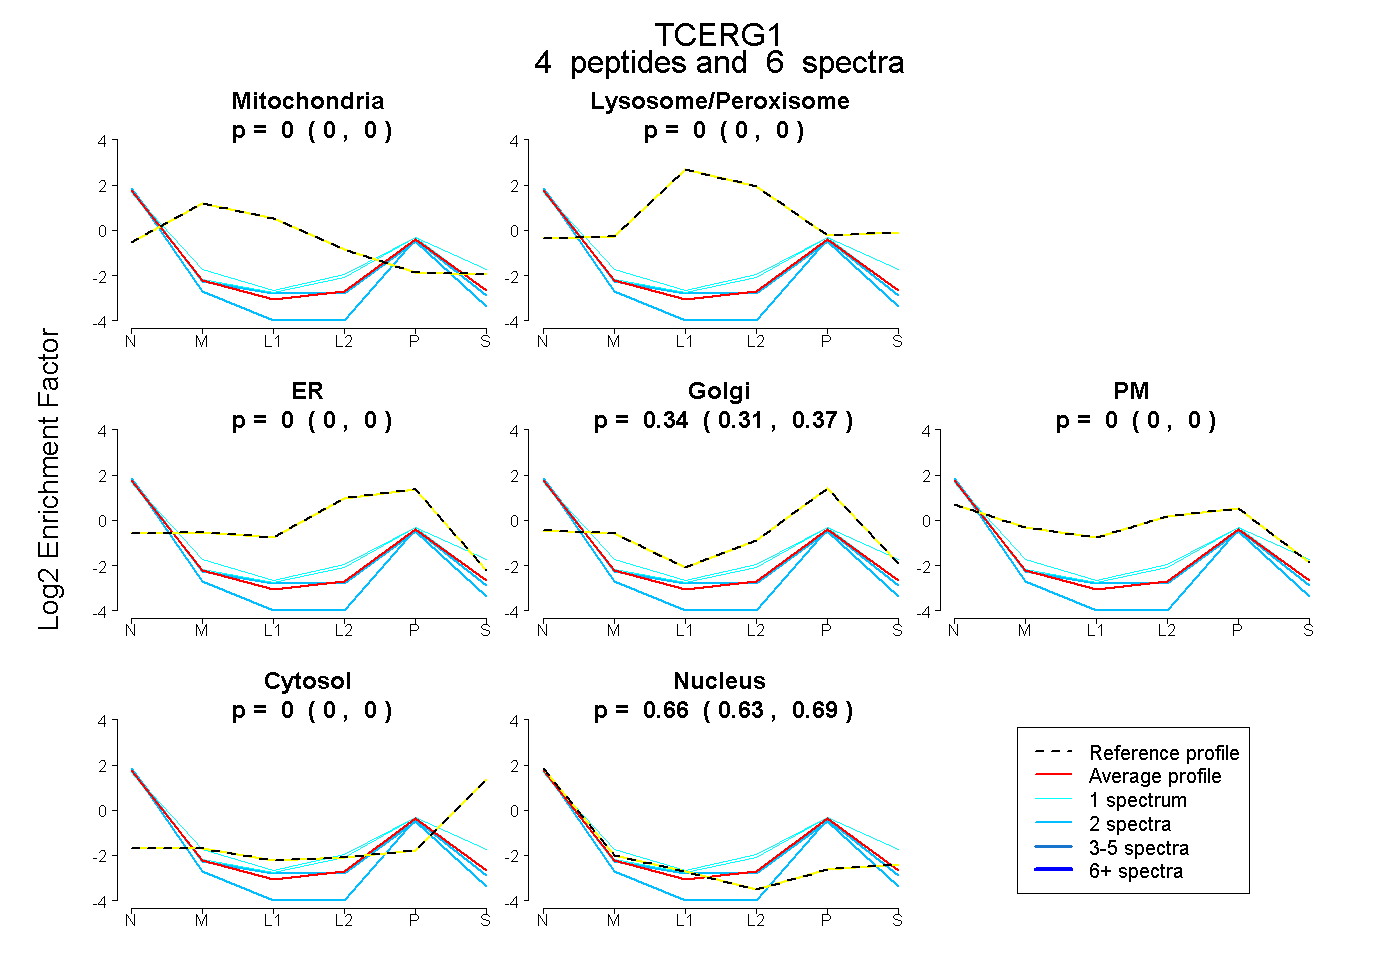 |
0.000
0.000 | 0.000 |
|
0.000
0.000 | 0.000 |
|
0.000
0.000 | 0.000 |
0.340
0.308 | 0.366 |
0.000
0.000 | 0.000 |
0.000
0.000 | 0.000 |
0.660
0.628 | 0.688 |
|
| 2 spectra, VFFYNPTTR |
0.000 |
|
0.000 |
|
0.000 |
0.180 |
0.000 |
0.000 |
0.820 |
|
| 1 spectrum, EALFNEFVAAAR |
0.000 |
|
0.000 |
|
0.000 |
0.338 |
0.116 |
0.000 |
0.546 |
|
| 2 spectra, AIVPLEAR |
0.000 |
|
0.000 |
|
0.000 |
0.310 |
0.000 |
0.000 |
0.690 |
|
| 1 spectrum, EFEEYIR |
0.000 |
|
0.000 |
|
0.000 |
0.396 |
0.036 |
0.000 |
0.568 |
|
| | | Plot |
|
Lyso |
|
|
|
|
|
|
|
Other |
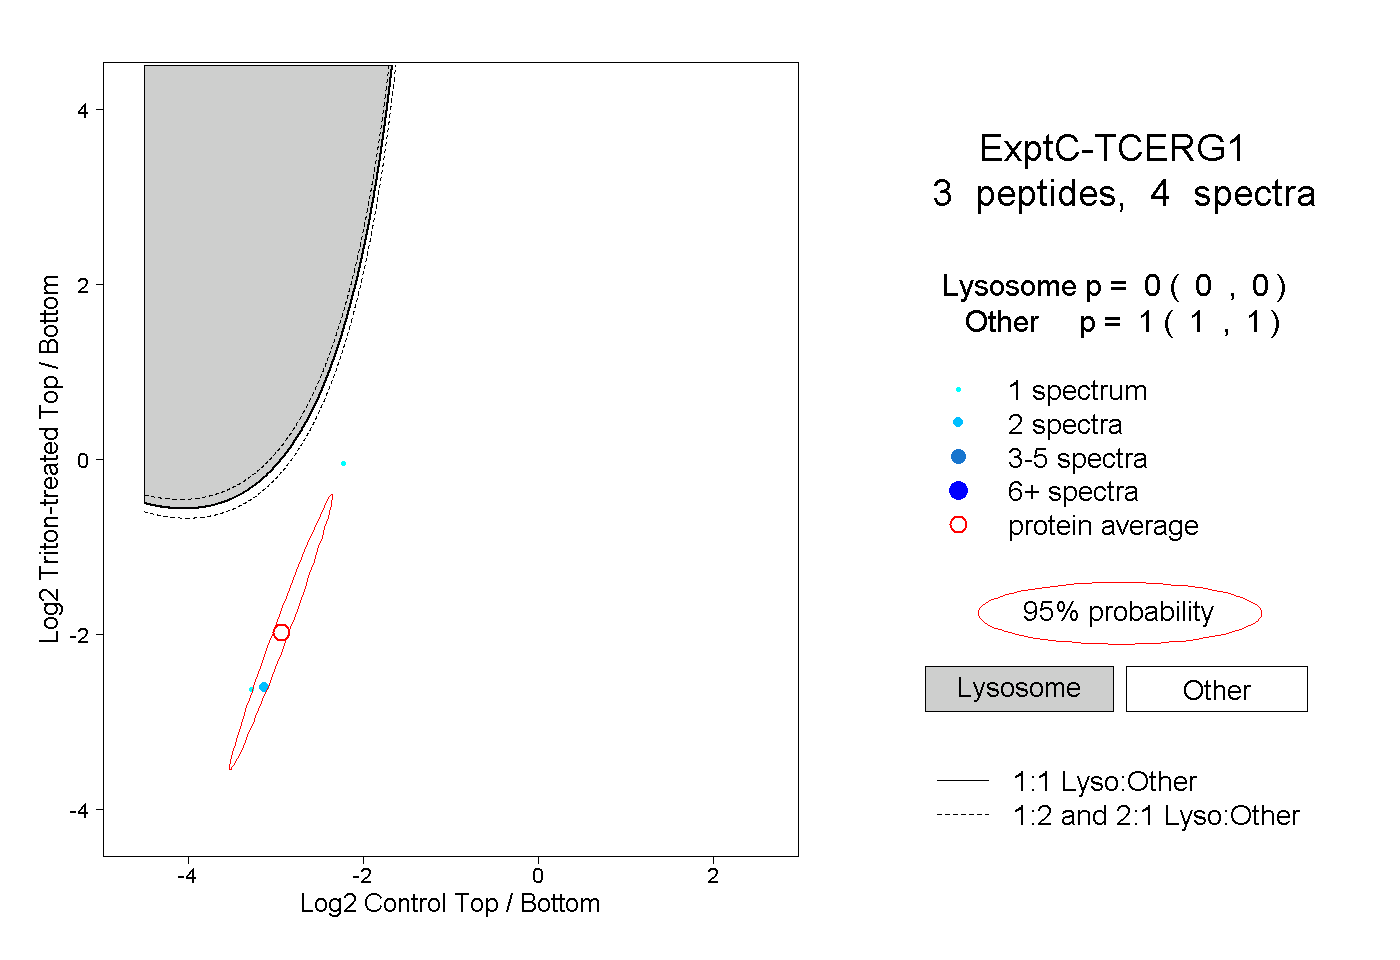
| Expt C |
3
peptides |
4
spectra |
 |
|
0.000
0.000 | 0.000 |
|
|
|
|
|
|
|
1.000
1.000 | 1.000 |