 20
20peptides
spectra
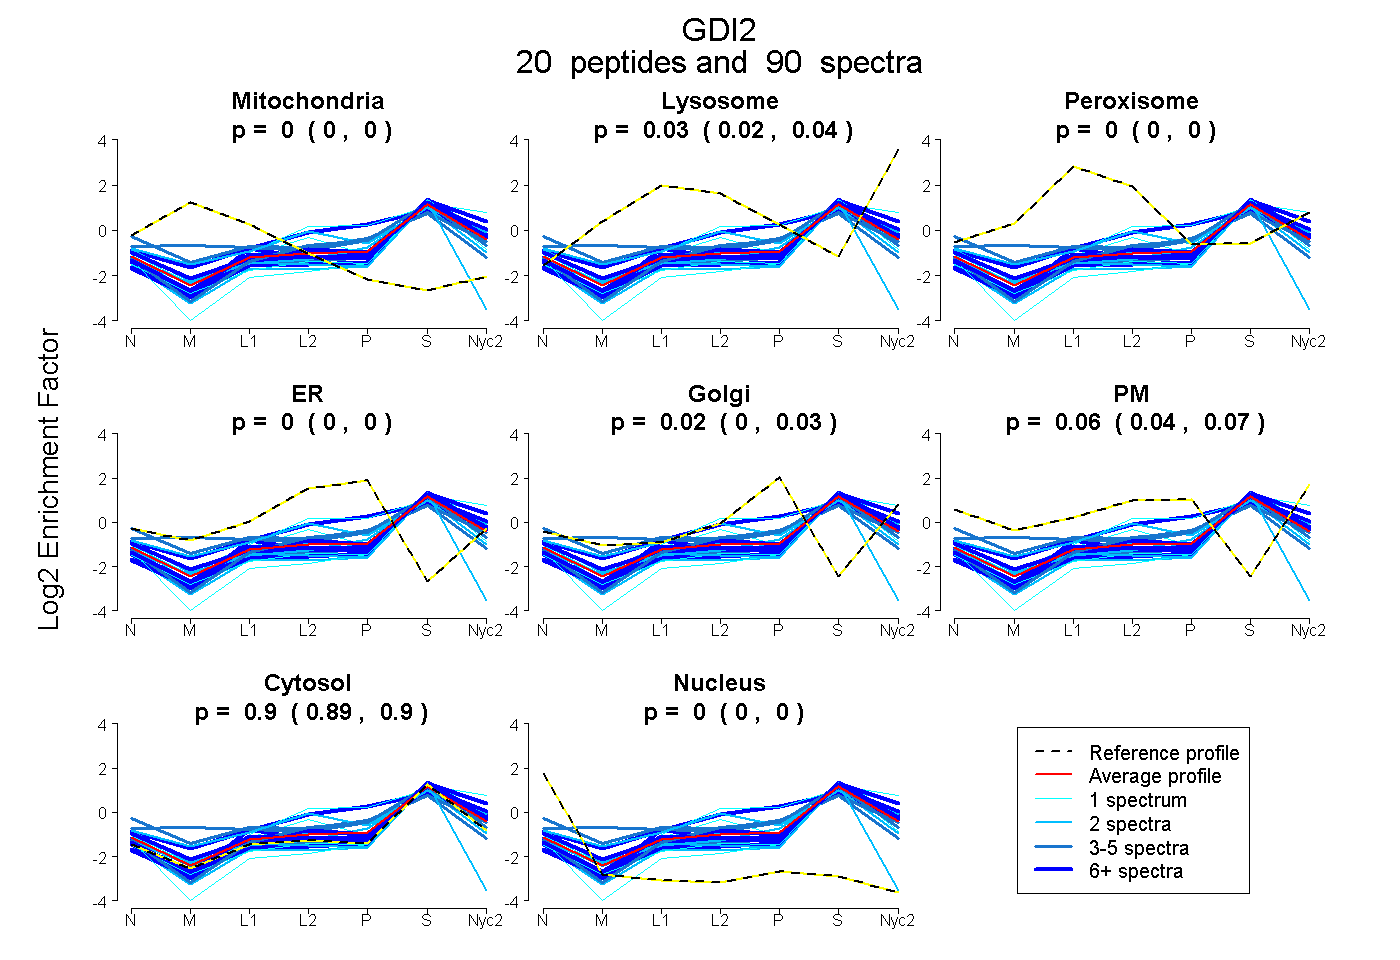
0.000 | 0.000
0.025 | 0.037
0.000 | 0.000
0.000 | 0.000
0.005 | 0.027
0.041 | 0.067
0.892 | 0.900
0.000 | 0.000
11peptides
spectra
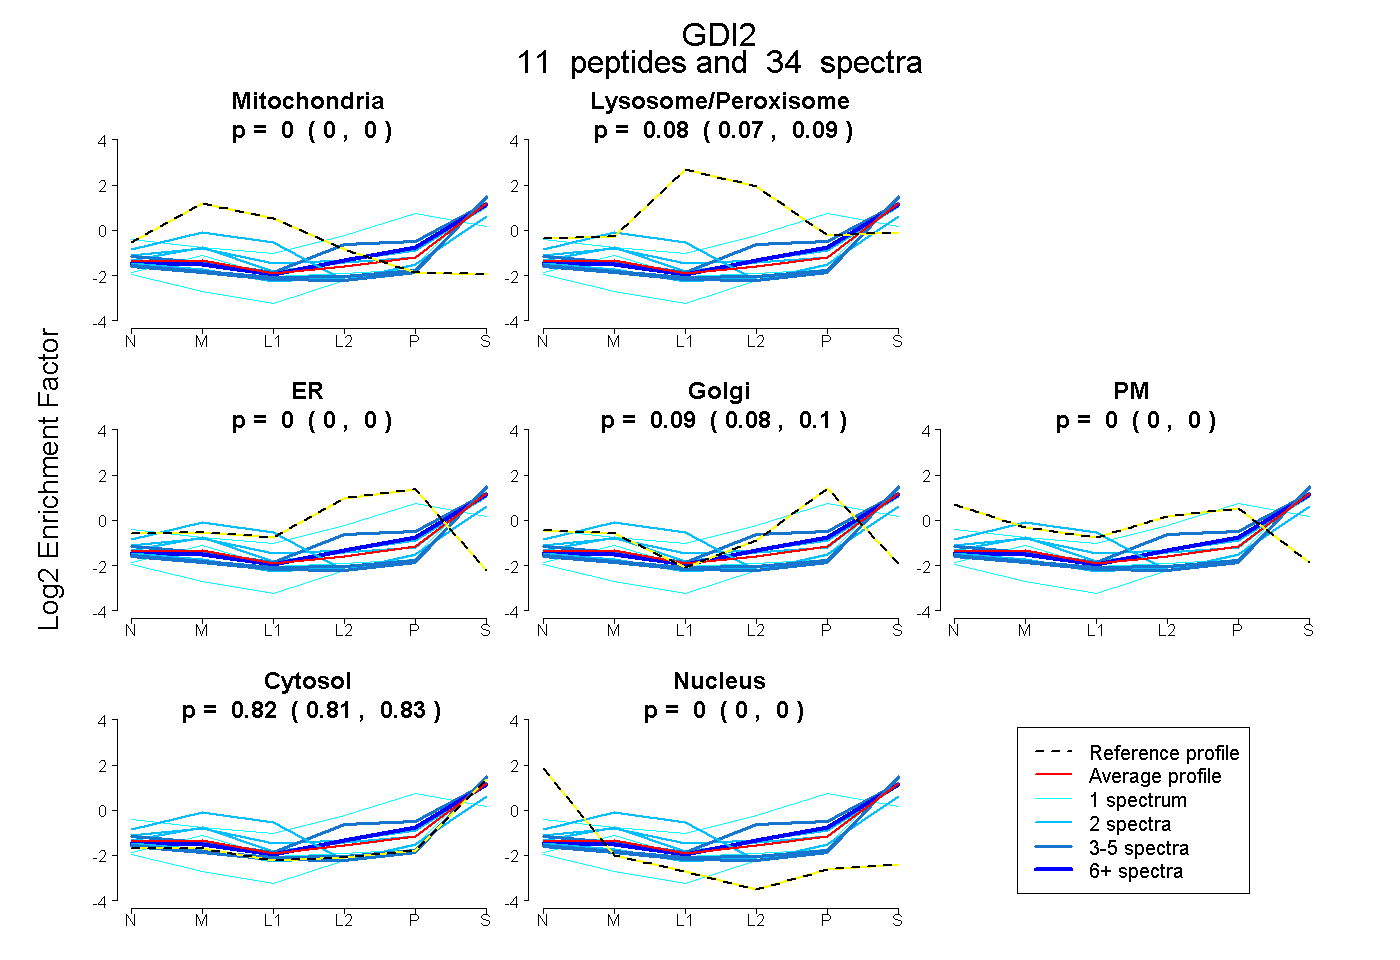
0.000 | 0.000
0.072 | 0.089
0.000 | 0.000
0.081 | 0.104
0.000 | 0.000
0.814 | 0.834
0.000 | 0.000
17peptides
spectra
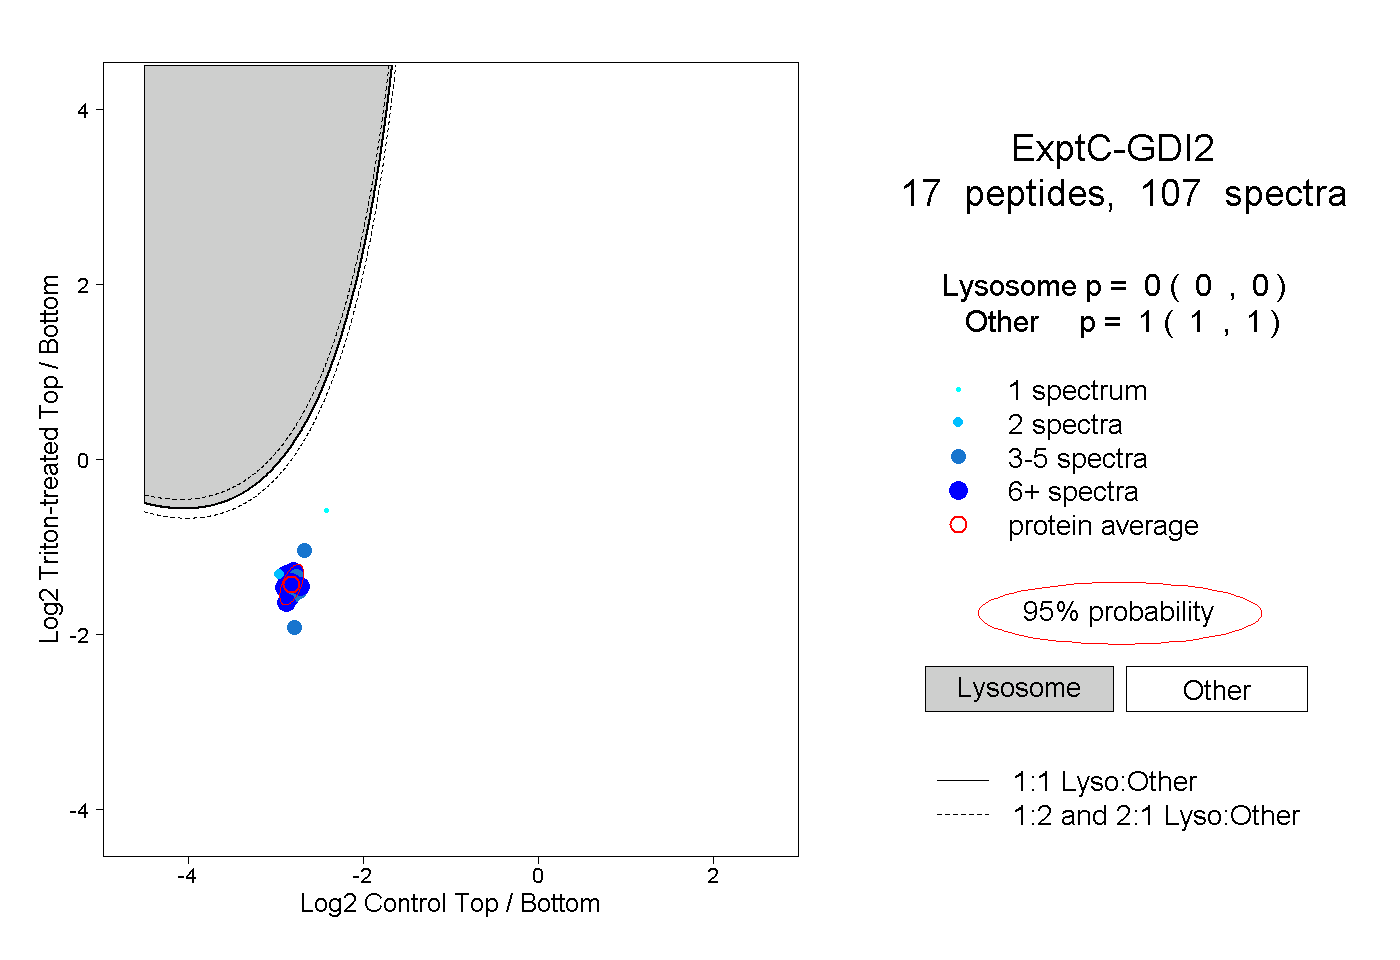
0.000 | 0.000
1.000 | 1.000
5peptides
spectra
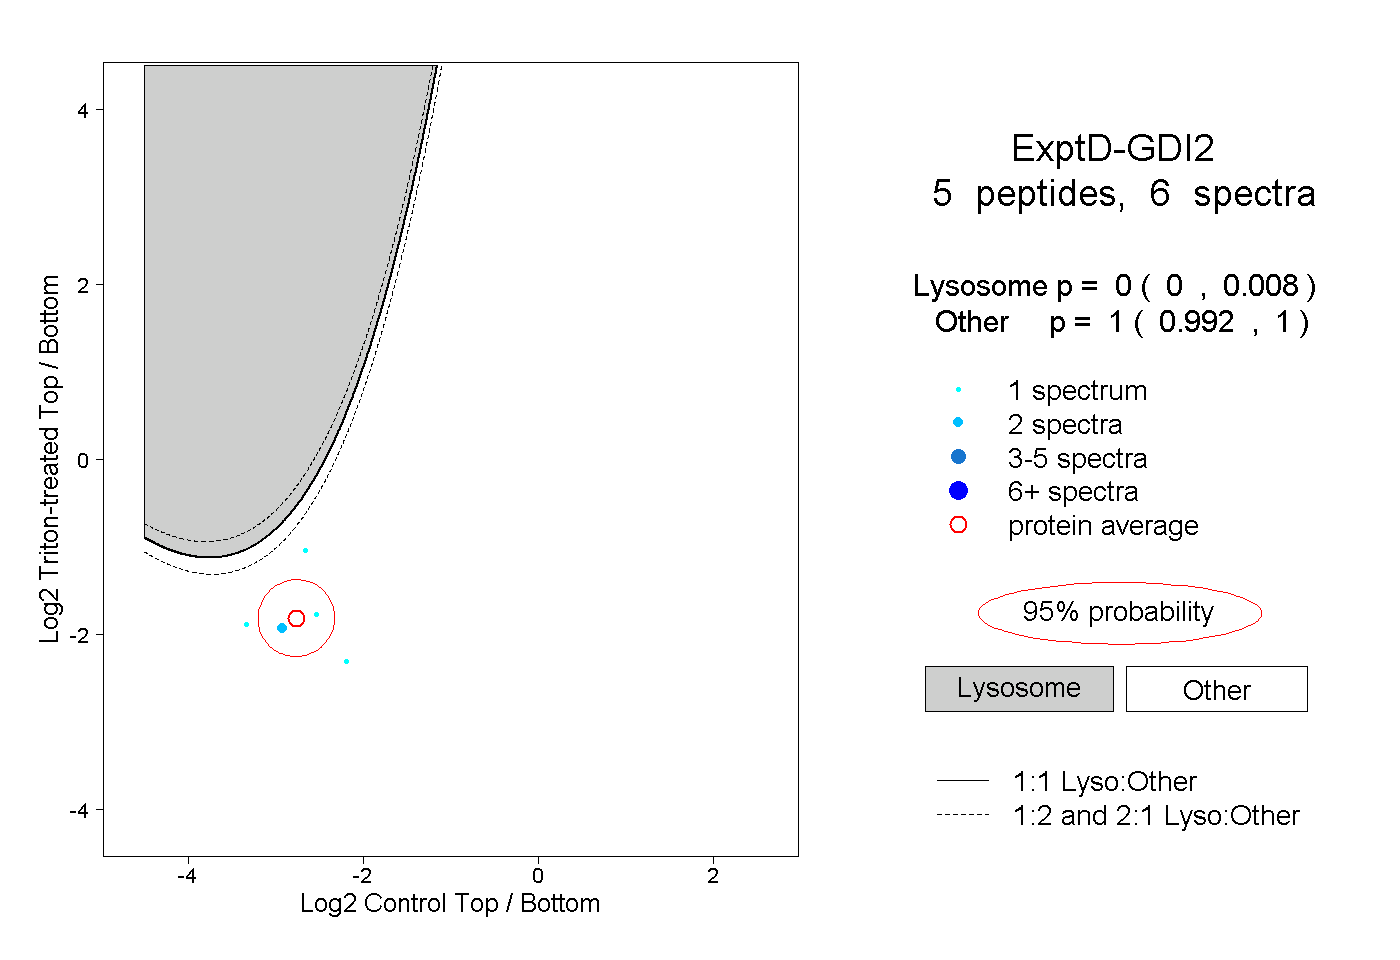
0.000 | 0.008
0.992 | 1.000