 6
6peptides
spectra
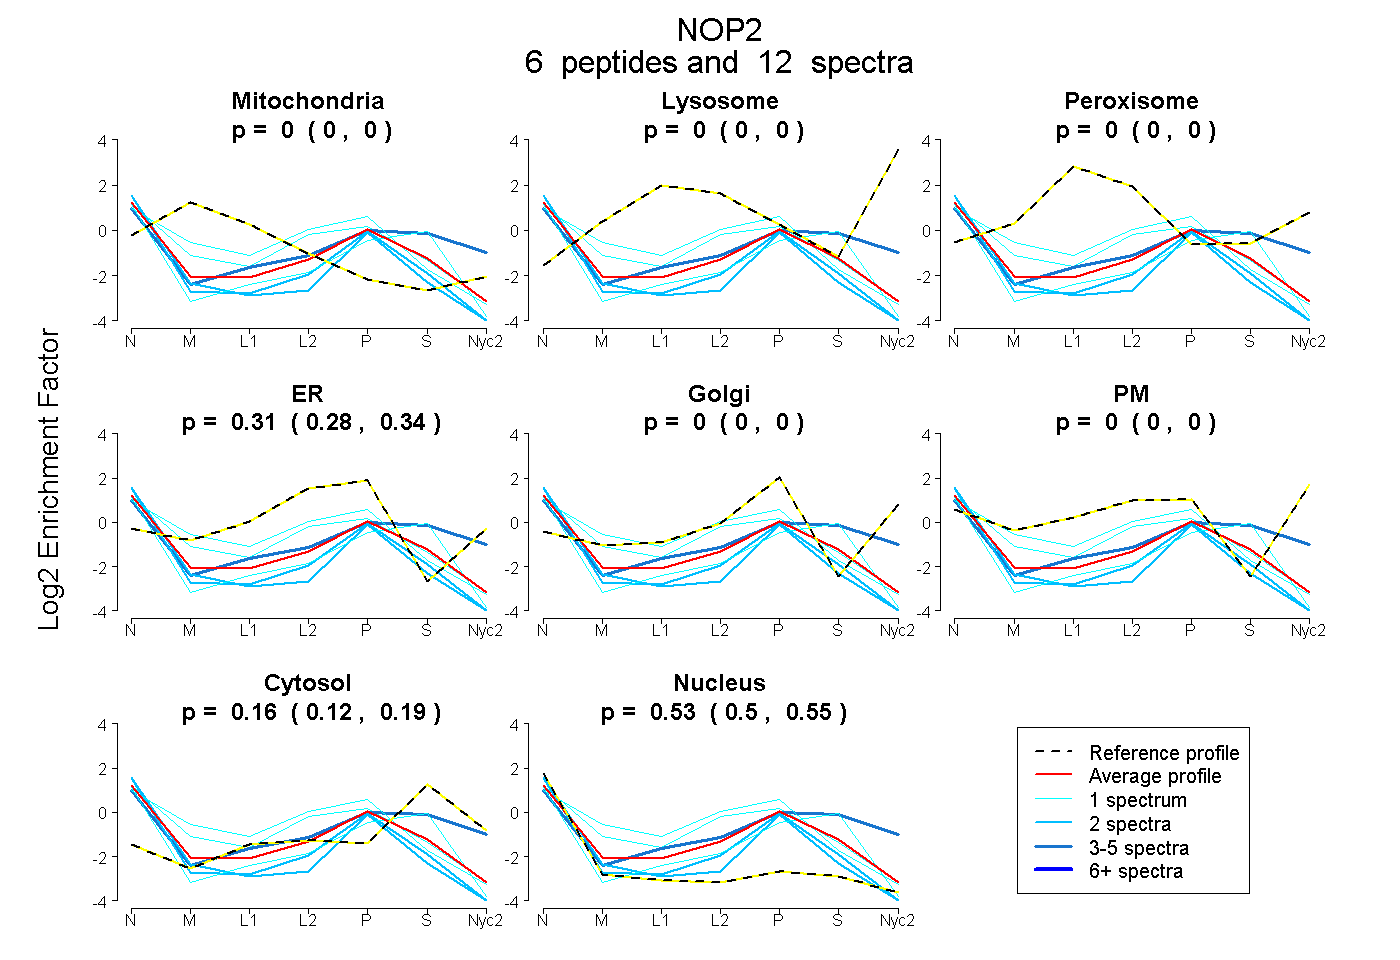
0.000 | 0.000
0.000 | 0.000
0.000 | 0.000
0.284 | 0.340
0.000 | 0.000
0.000 | 0.000
0.120 | 0.193
0.495 | 0.553
3peptides
spectra
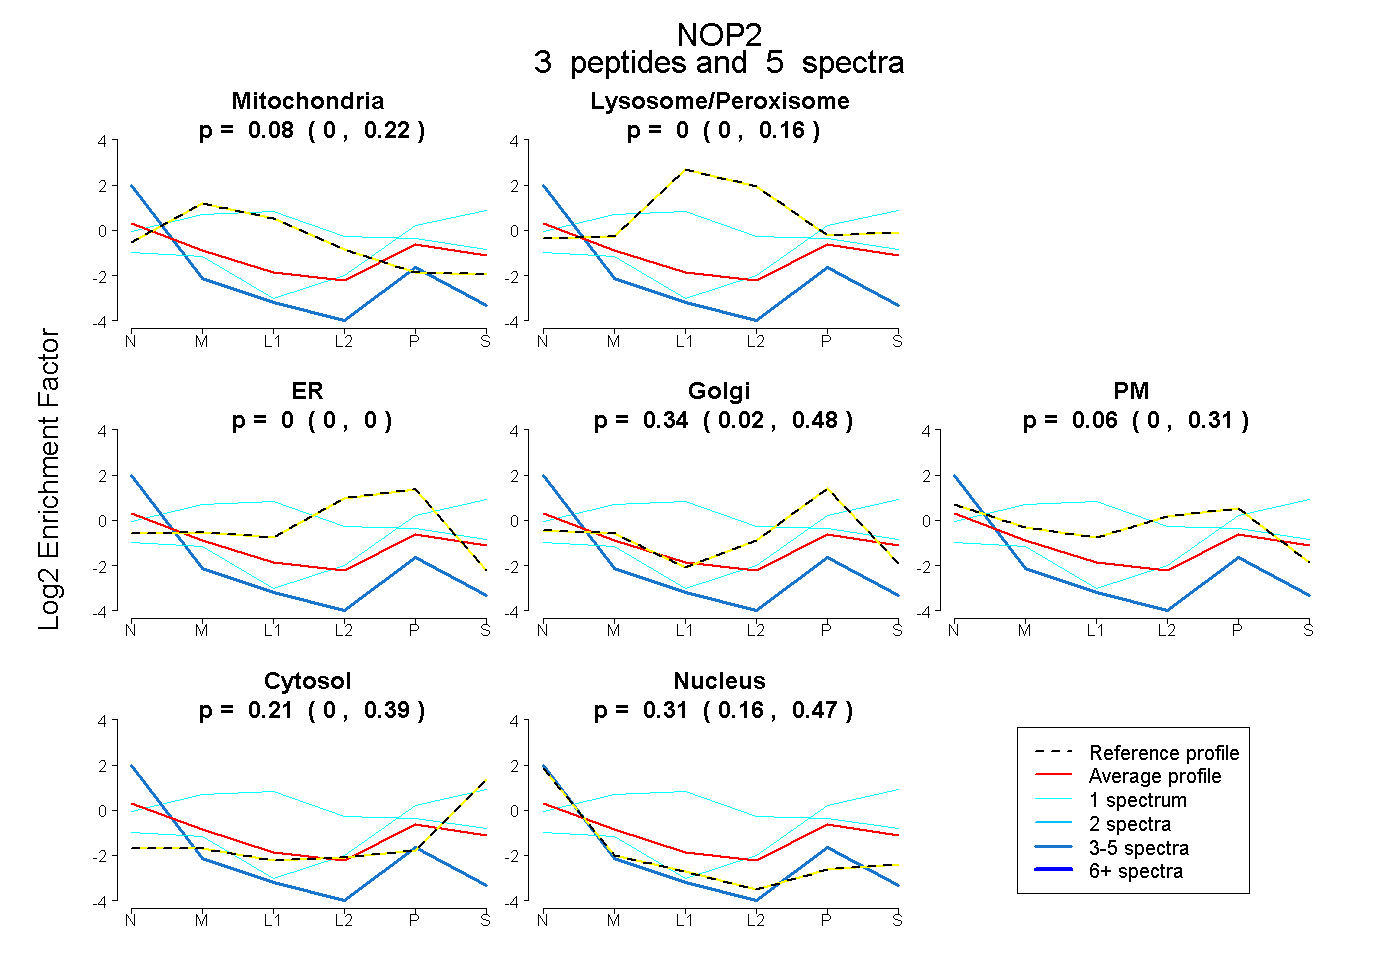
0.000 | 0.217
0.000 | 0.165
0.000 | 0.000
0.023 | 0.482
0.000 | 0.313
0.000 | 0.388
0.165 | 0.472
1peptide
spectra
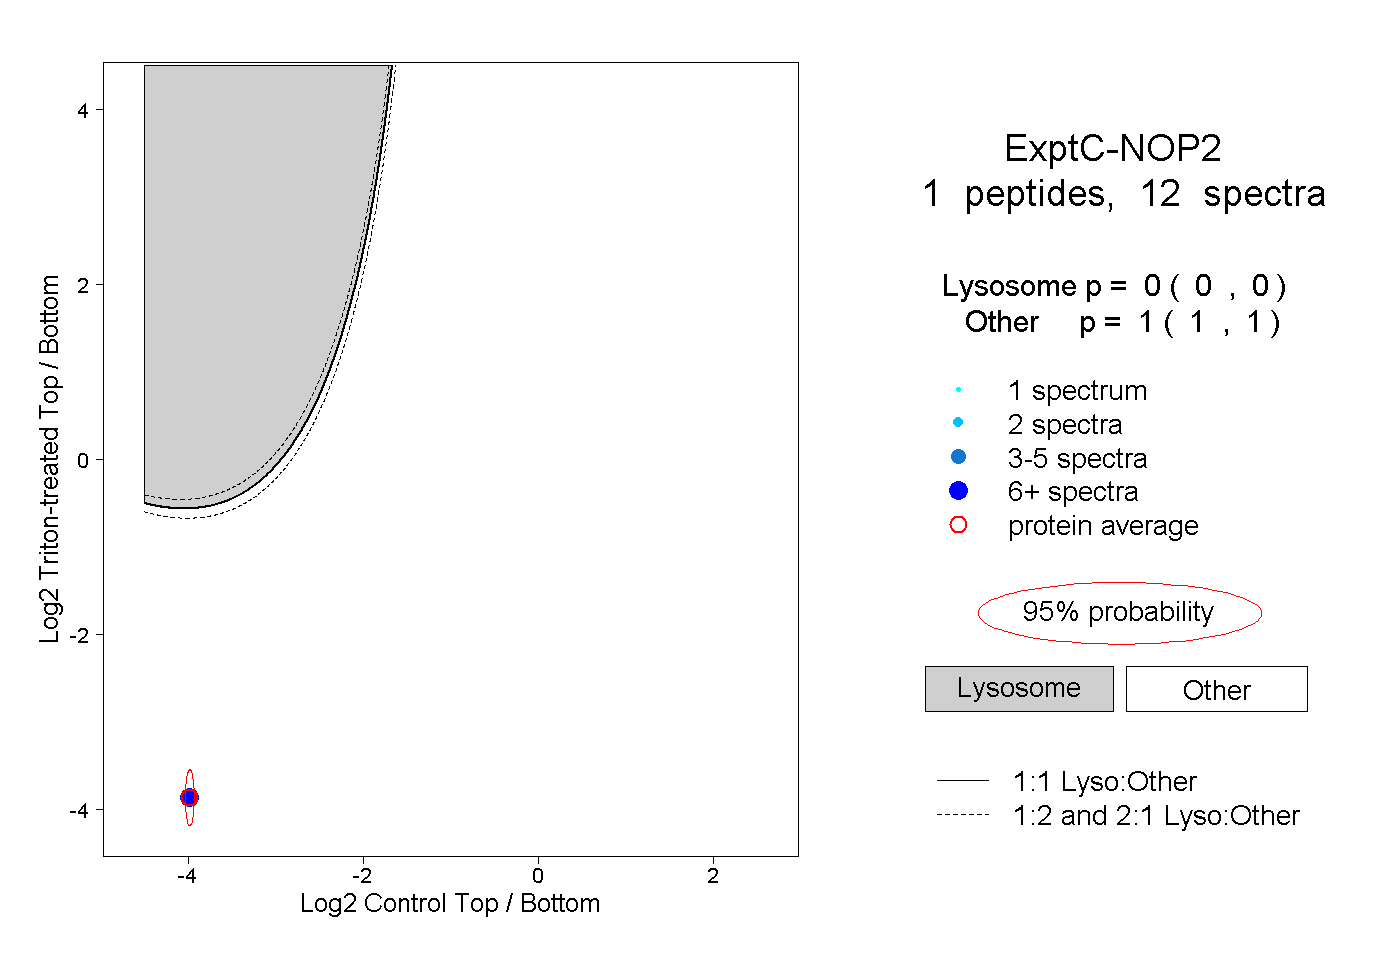
0.000 | 0.000
1.000 | 1.000