 6
6peptides
spectra
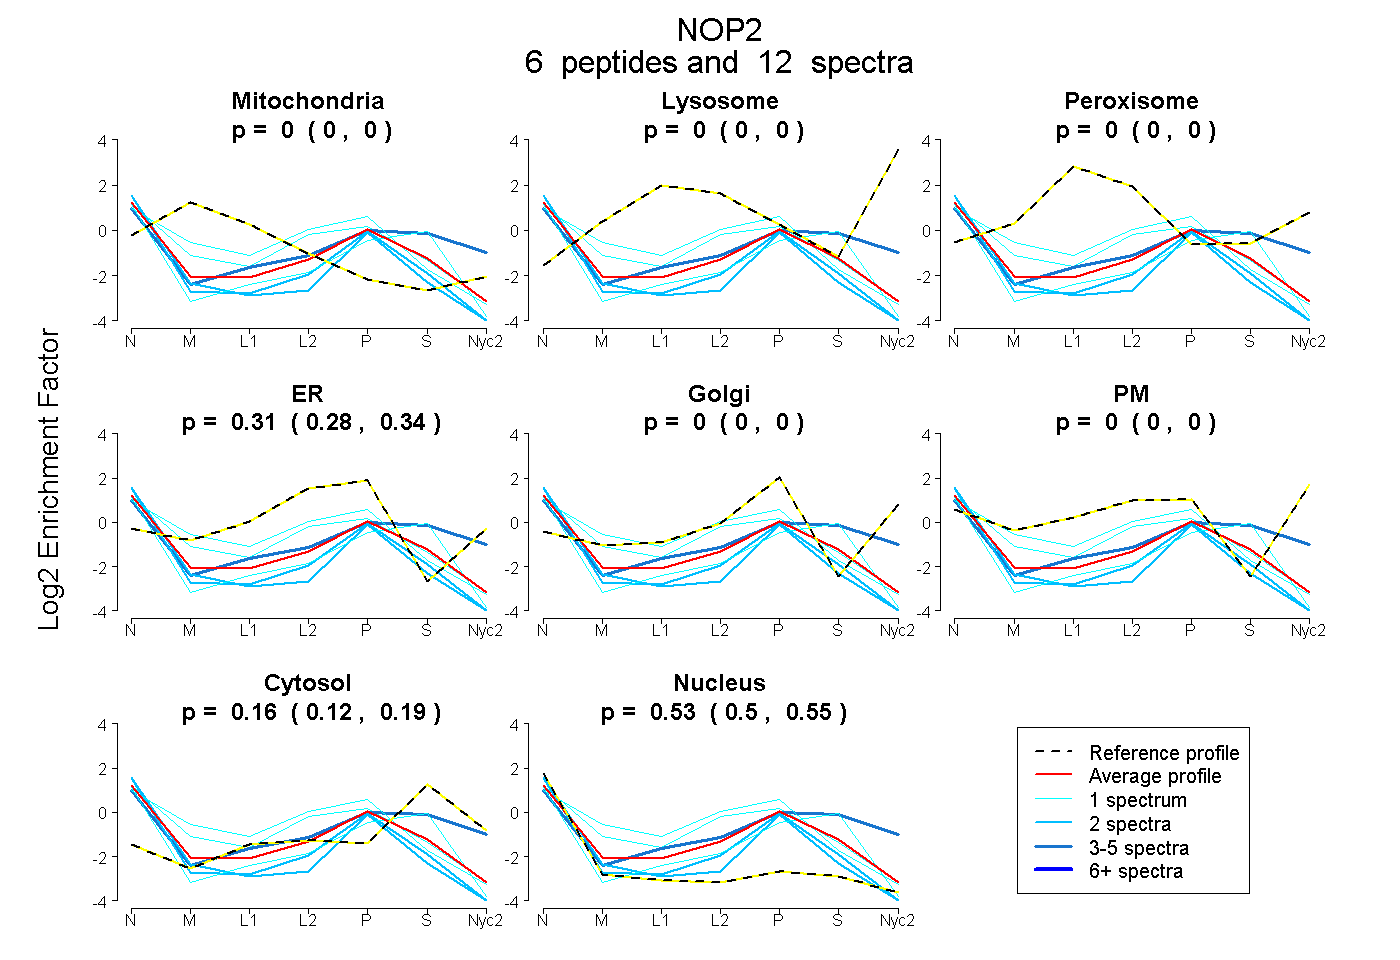
0.000 | 0.000
0.000 | 0.000
0.000 | 0.000
0.284 | 0.340
0.000 | 0.000
0.000 | 0.000
0.120 | 0.193
0.495 | 0.553
| Plot | Mito | Lyso | Perox | ER | Golgi | PM | Cytosol | Nucleus | |||||
| Expt A |
6 peptides |
12 spectra |
|
0.000 0.000 | 0.000 |
0.000 0.000 | 0.000 |
0.000 0.000 | 0.000 |
0.314 0.284 | 0.340 |
0.000 0.000 | 0.000 |
0.000 0.000 | 0.000 |
0.160 0.120 | 0.193 |
0.526 0.495 | 0.553 |
| 2 spectra, DLAQALINR | 0.000 | 0.000 | 0.000 | 0.238 | 0.000 | 0.000 | 0.021 | 0.740 | ||
| 1 spectrum, QQLVGQQHSK | 0.135 | 0.000 | 0.000 | 0.530 | 0.000 | 0.000 | 0.000 | 0.335 | ||
| 1 spectrum, AHGAAK | 0.025 | 0.000 | 0.000 | 0.471 | 0.000 | 0.000 | 0.082 | 0.422 | ||
| 1 spectrum, NTGVILANDANAER | 0.000 | 0.000 | 0.000 | 0.051 | 0.000 | 0.000 | 0.407 | 0.542 | ||
| 2 spectra, IQDIVGVLR | 0.000 | 0.000 | 0.000 | 0.133 | 0.080 | 0.000 | 0.000 | 0.787 | ||
| 5 spectra, DFGAQR | 0.000 | 0.000 | 0.000 | 0.000 | 0.174 | 0.145 | 0.439 | 0.242 |
| Plot | Mito | Lyso or Perox | ER | Golgi | PM | Cytosol | Nucleus | ||||||
| Expt B |
3 peptides |
5 spectra |
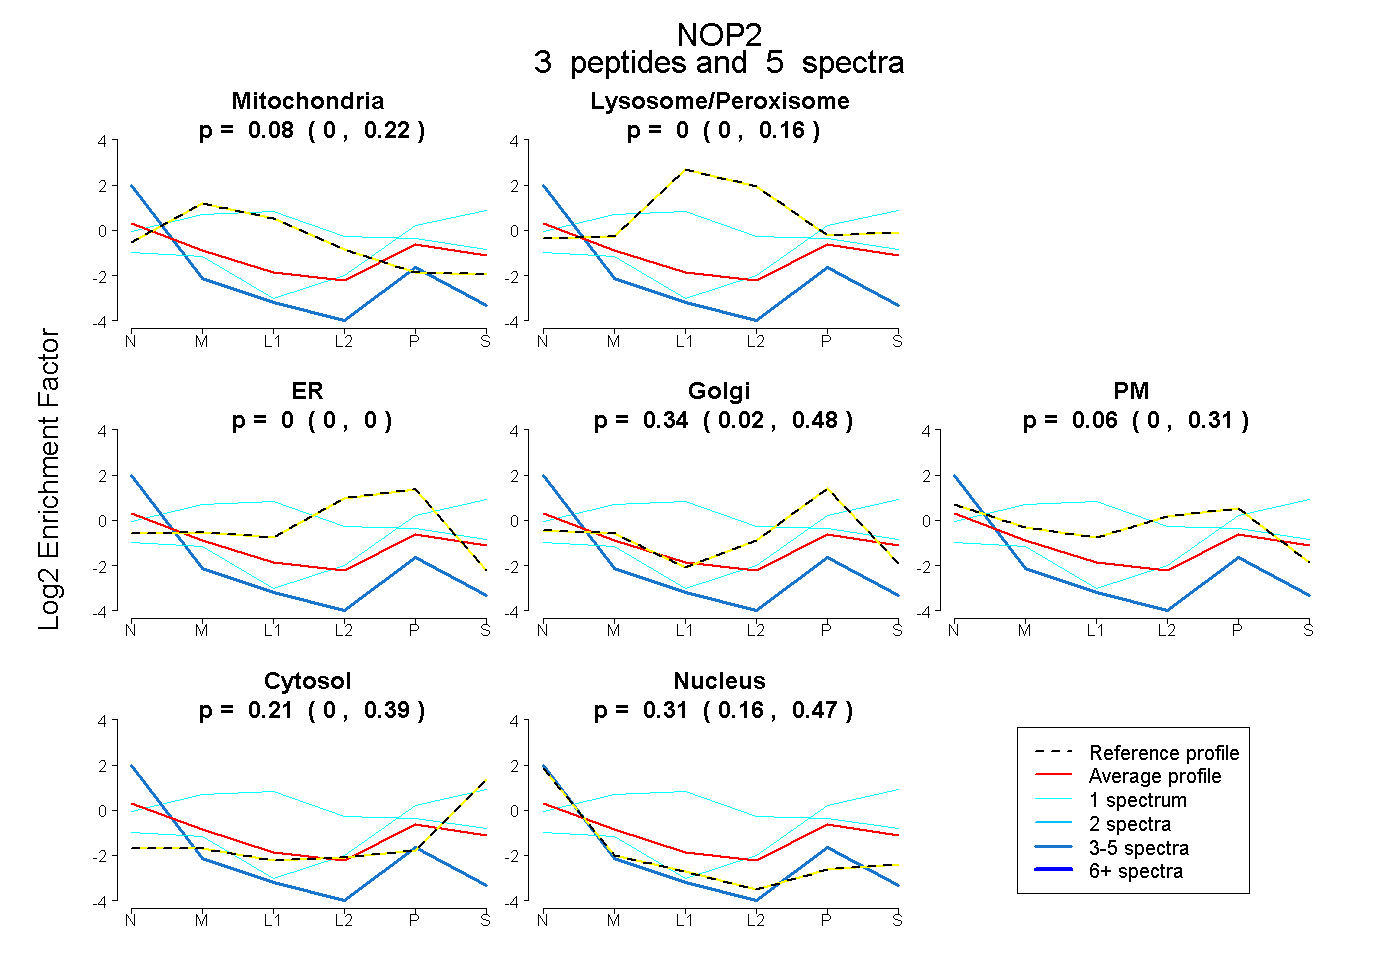 |
0.084 0.000 | 0.217 |
0.000 0.000 | 0.165 |
0.000 0.000 | 0.000 |
0.338 0.023 | 0.482 |
0.057 0.000 | 0.313 |
0.208 0.000 | 0.388 |
0.313 0.165 | 0.472 |
|||
| Plot | Lyso | Other | |||||||||||
| Expt C |
1 peptide |
12 spectra |
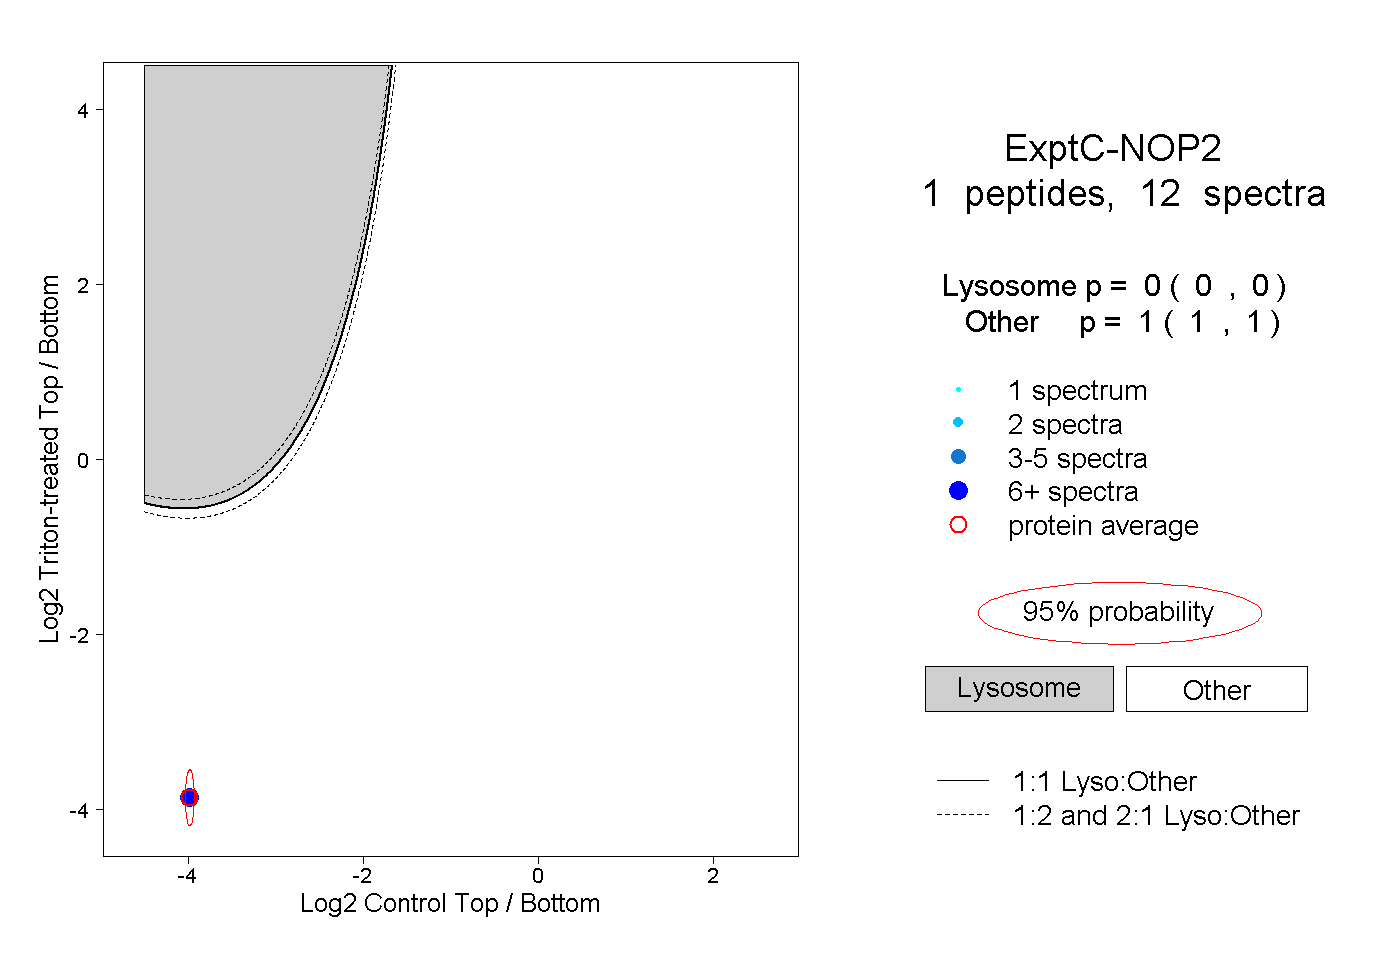 |
0.000 0.000 | 0.000 |
1.000 1.000 | 1.000 |