NOP2
[ENSRNOP00000024938]
Main page
| | | Plot |
Mito |
Lyso |
|
Perox |
ER |
Golgi |
PM |
Cytosol |
Nucleus |
|
| Expt A |
 6
6
peptides |
12
spectra |
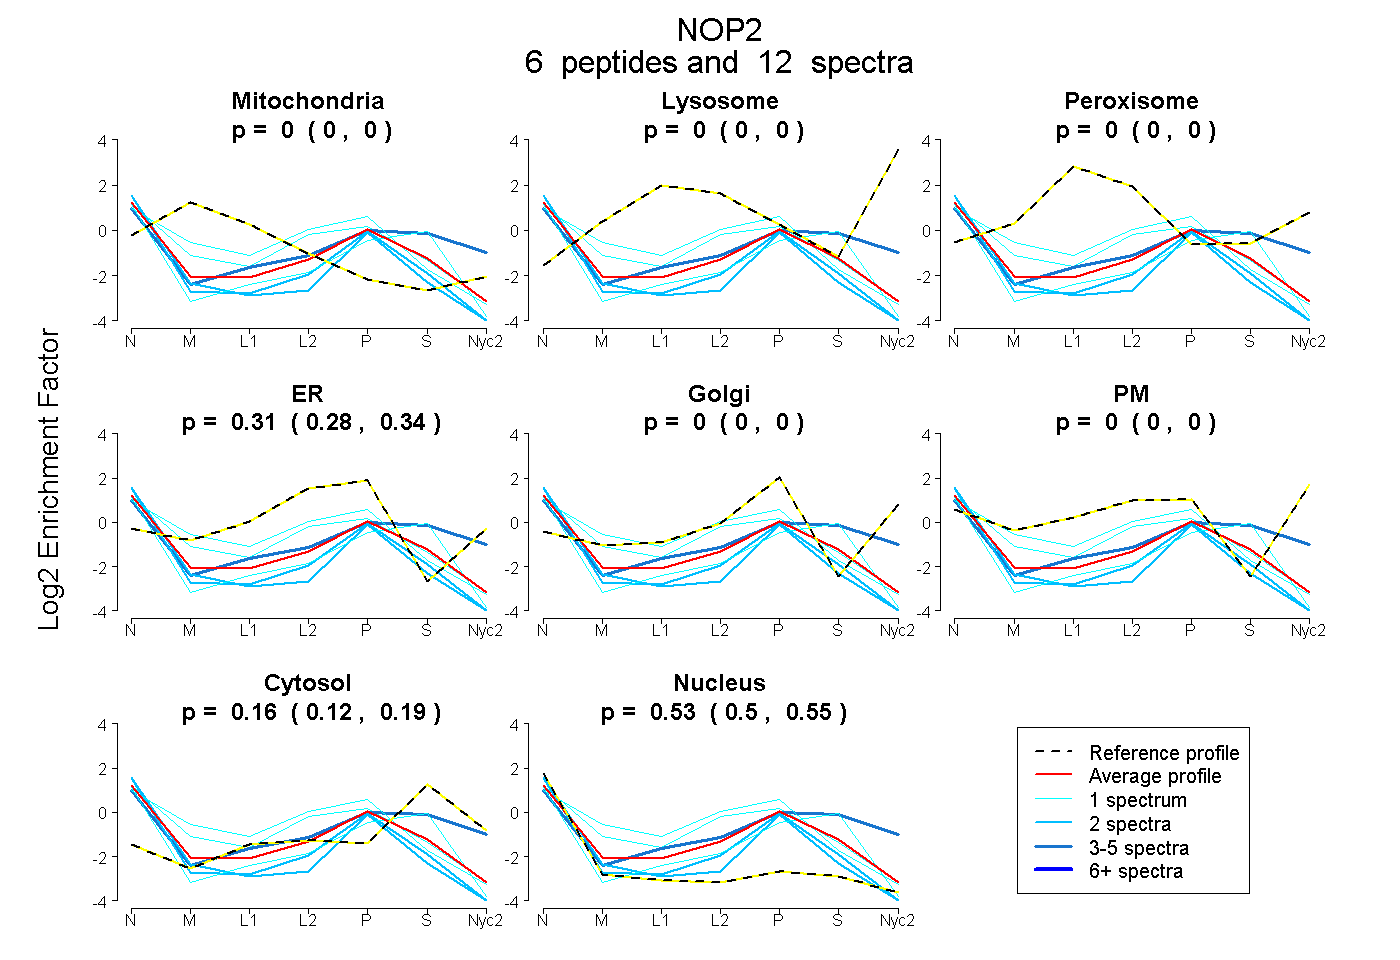 |
0.000
0.000 | 0.000 |
0.000
0.000 | 0.000 |
|
0.000
0.000 | 0.000 |
0.314
0.284 | 0.340 |
0.000
0.000 | 0.000 |
0.000
0.000 | 0.000 |
0.160
0.120 | 0.193 |
0.526
0.495 | 0.553 |
|
| | | Plot |
Mito |
|
Lyso or Perox |
|
ER |
Golgi |
PM |
Cytosol |
Nucleus |
|
| Expt B |
3
peptides |
5
spectra |
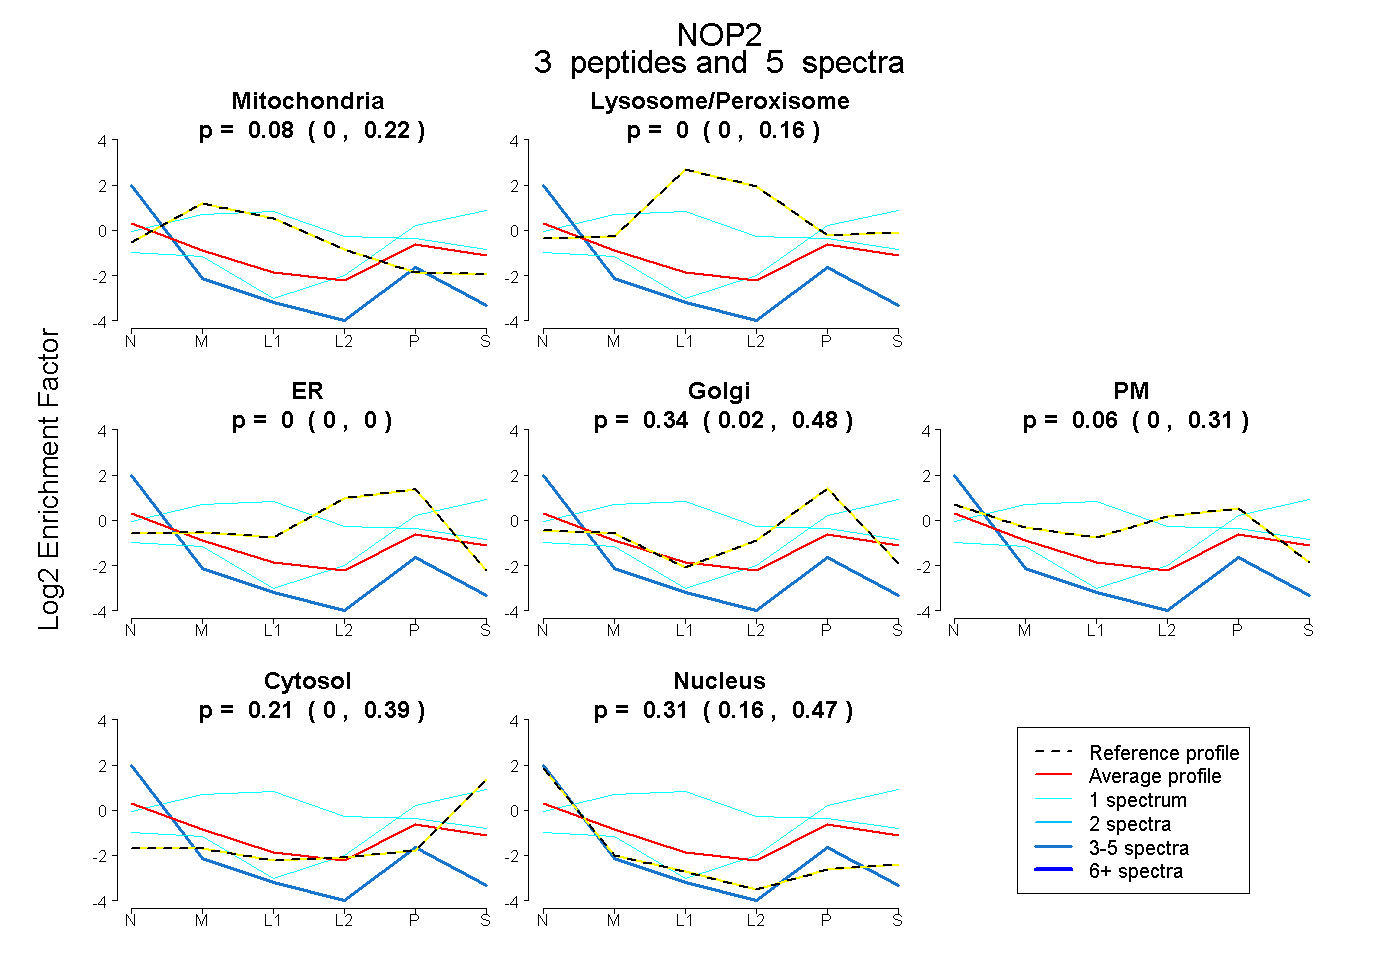 |
0.084
0.000 | 0.217 |
|
0.000
0.000 | 0.165 |
|
0.000
0.000 | 0.000 |
0.338
0.023 | 0.482 |
0.057
0.000 | 0.313 |
0.208
0.000 | 0.388 |
0.313
0.165 | 0.472 |
|
| 1 spectrum, QQLVGQQHSK |
0.000 |
|
0.000 |
|
0.000 |
0.368 |
0.000 |
0.632 |
0.000 |
|
| 3 spectra, IQDIVGVLR |
0.000 |
|
0.000 |
|
0.000 |
0.044 |
0.000 |
0.000 |
0.956 |
|
| 1 spectrum, GAETELIR |
0.431 |
|
0.317 |
|
0.000 |
0.126 |
0.099 |
0.027 |
0.000 |
|
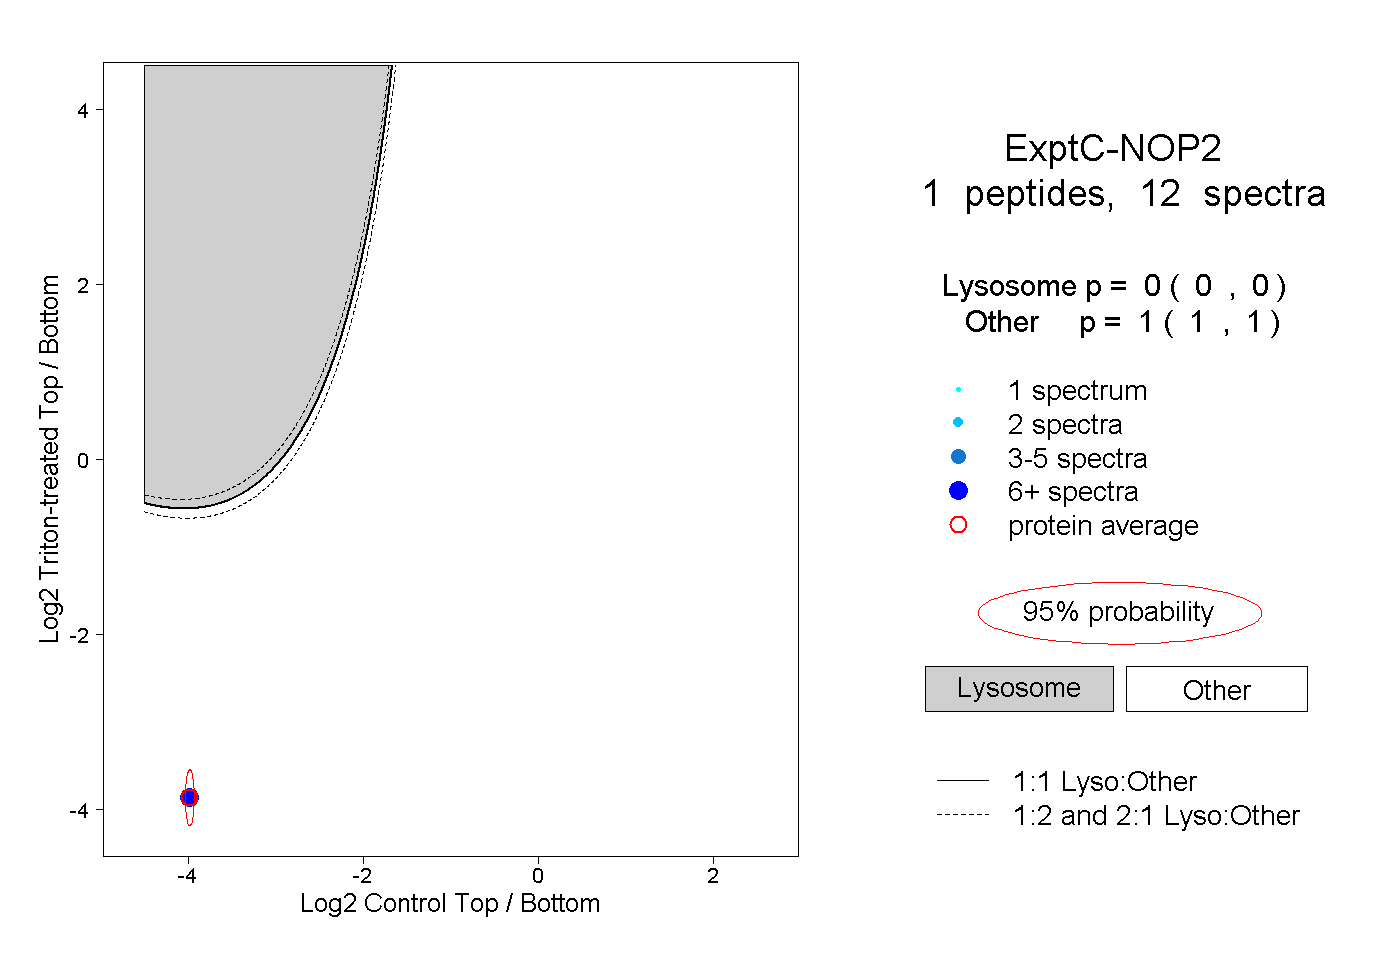
| | | Plot |
|
Lyso |
|
|
|
|
|
|
|
Other |
| Expt C |
1
peptide |
12
spectra |
 |
|
0.000
0.000 | 0.000 |
|
|
|
|
|
|
|
1.000
1.000 | 1.000 |