 13
13peptides
spectra
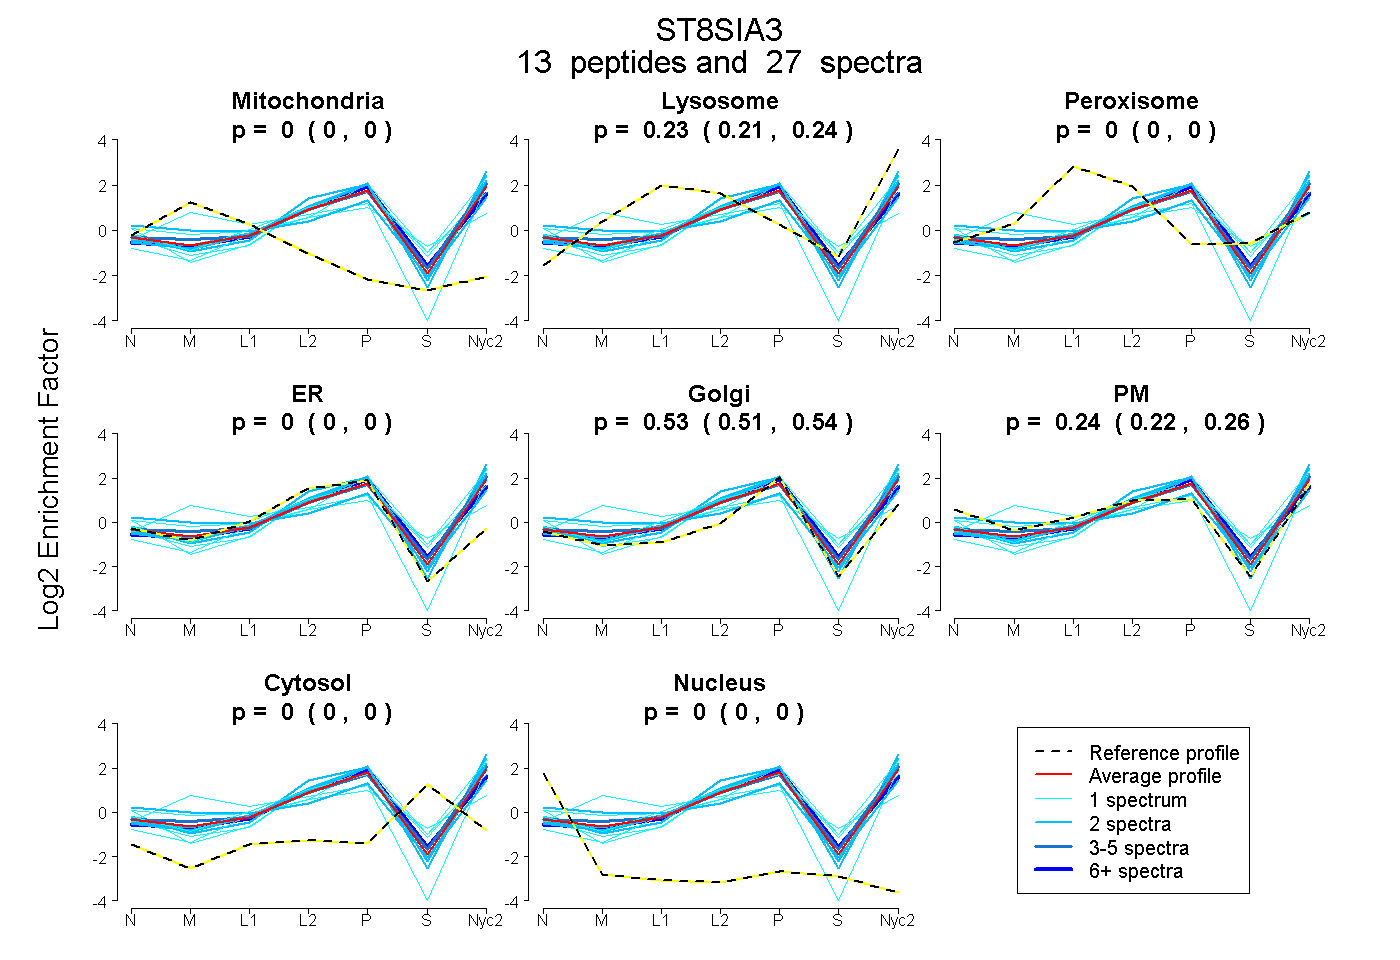
0.000 | 0.000
0.214 | 0.237
0.000 | 0.000
0.000 | 0.000
0.514 | 0.543
0.220 | 0.263
0.000 | 0.000
0.000 | 0.000
2peptides
spectra
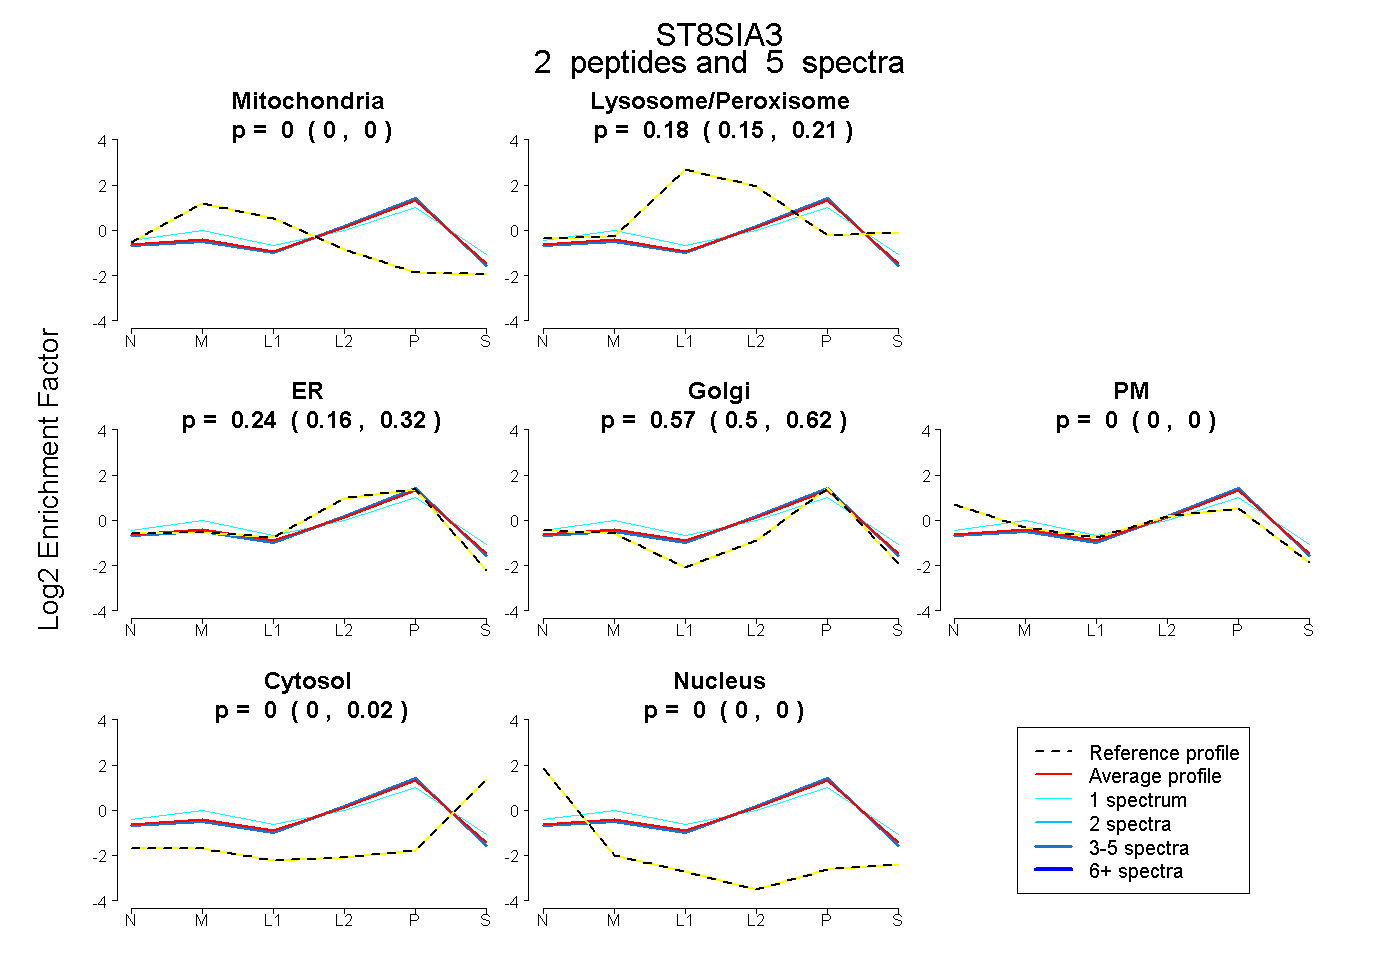
0.000 | 0.000
0.146 | 0.209
0.164 | 0.320
0.501 | 0.616
0.000 | 0.000
0.000 | 0.016
0.000 | 0.000
11peptides
spectra
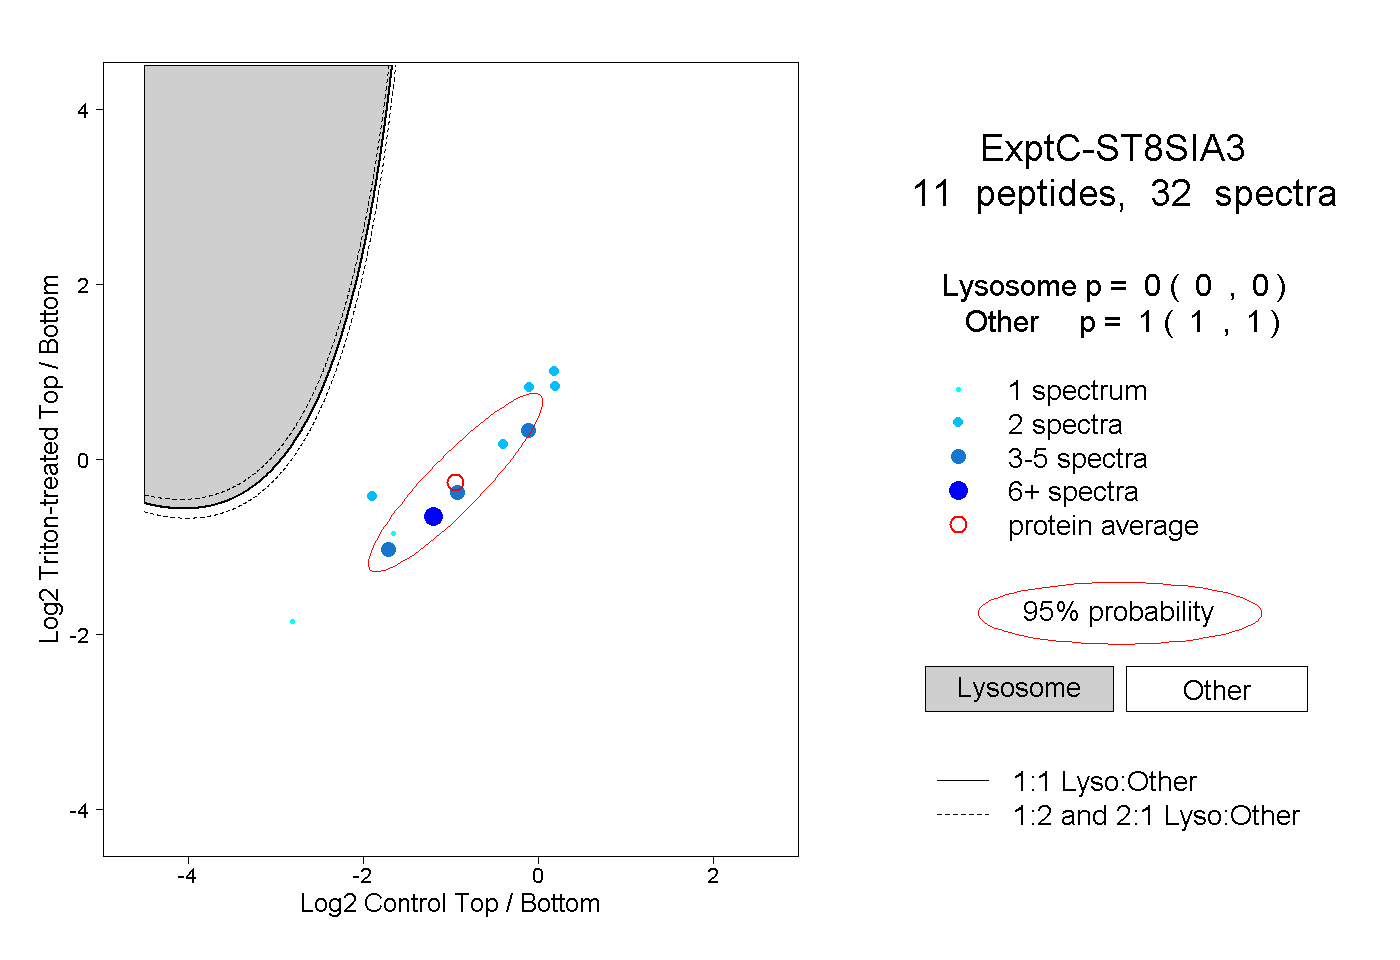
0.000 | 0.000
1.000 | 1.000