ST8SIA3
[ENSRNOP00000024752]
Main page
| | | Plot |
Mito |
Lyso |
|
Perox |
ER |
Golgi |
PM |
Cytosol |
Nucleus |
|
| Expt A |
 13
13
peptides |
27
spectra |
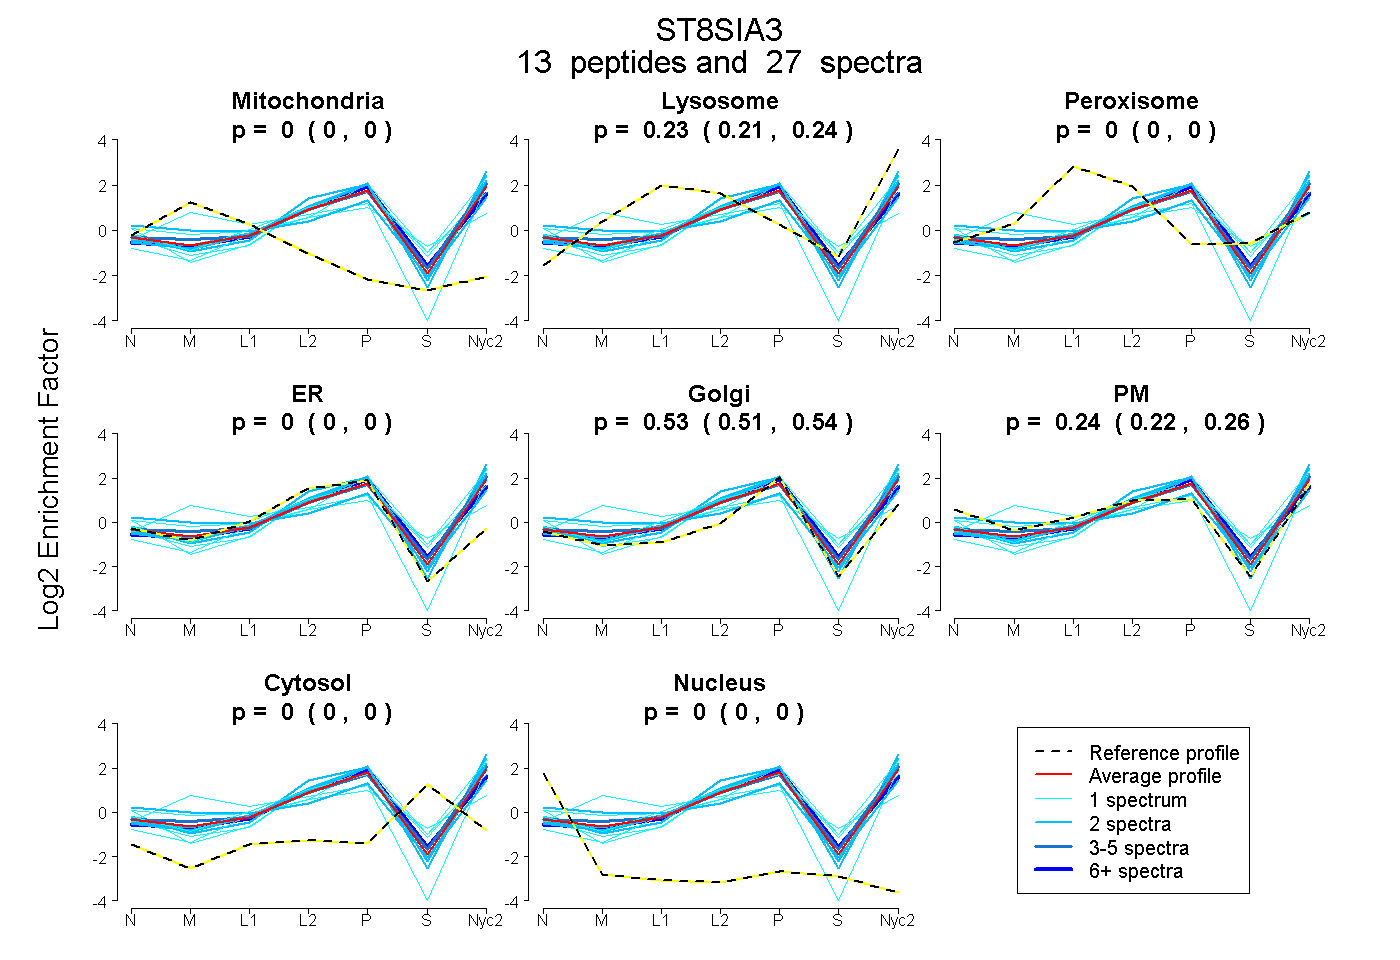 |
0.000
0.000 | 0.000 |
0.227
0.214 | 0.237 |
|
0.000
0.000 | 0.000 |
0.000
0.000 | 0.000 |
0.529
0.514 | 0.543 |
0.244
0.220 | 0.263 |
0.000
0.000 | 0.000 |
0.000
0.000 | 0.000 |
|
| | | Plot |
Mito |
|
Lyso or Perox |
|
ER |
Golgi |
PM |
Cytosol |
Nucleus |
|
| Expt B |
2
peptides |
5
spectra |
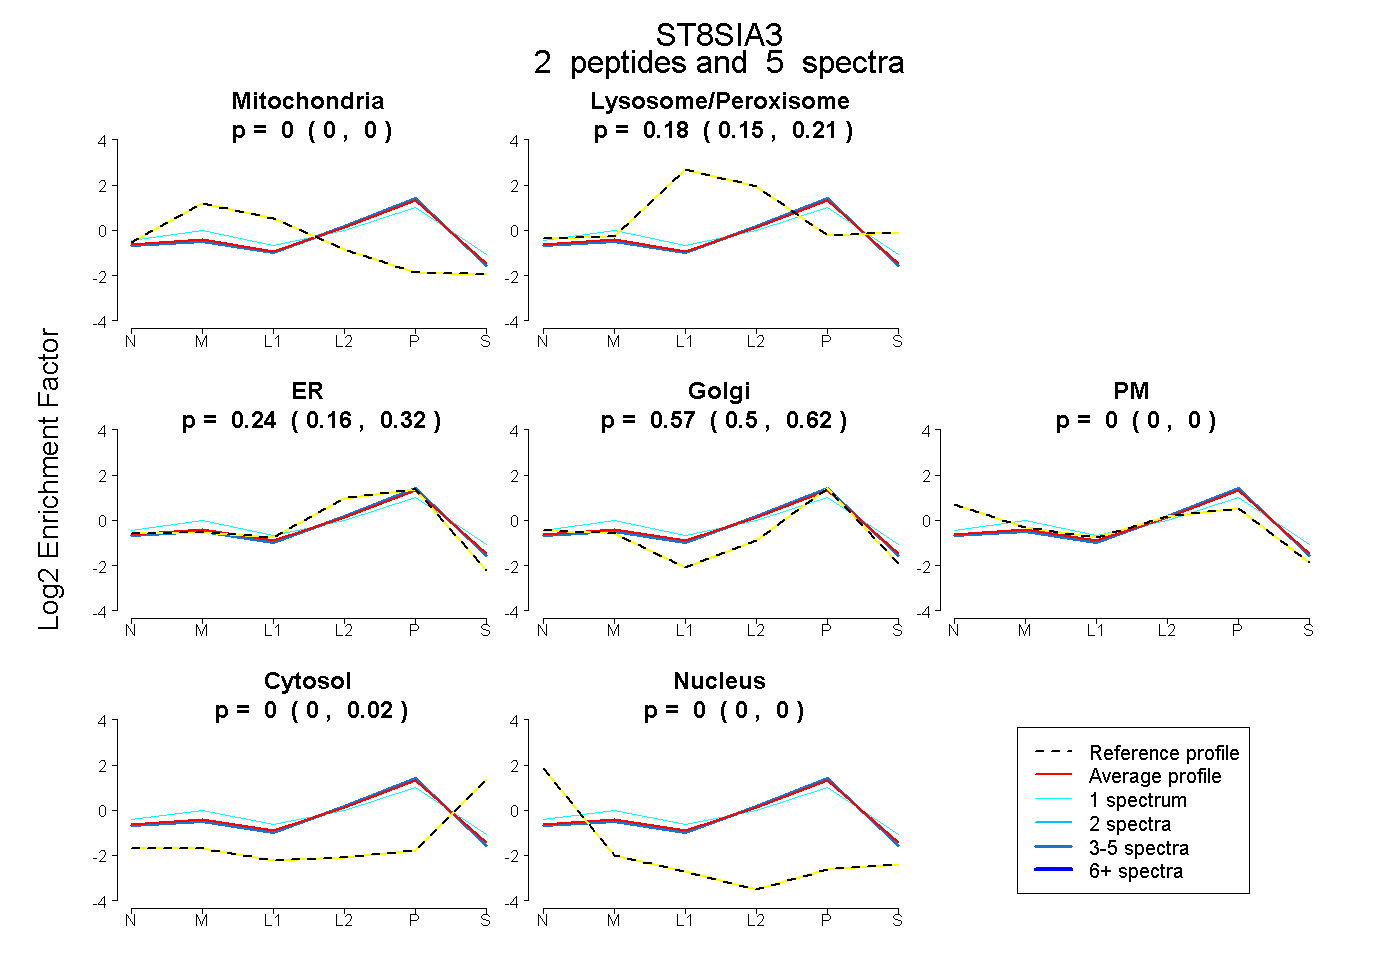 |
0.000
0.000 | 0.000 |
|
0.184
0.146 | 0.209 |
|
0.241
0.164 | 0.320 |
0.575
0.501 | 0.616 |
0.000
0.000 | 0.000 |
0.000
0.000 | 0.016 |
0.000
0.000 | 0.000 |
|
| | | Plot |
|
Lyso |
|
|
|
|
|
|
|
Other |
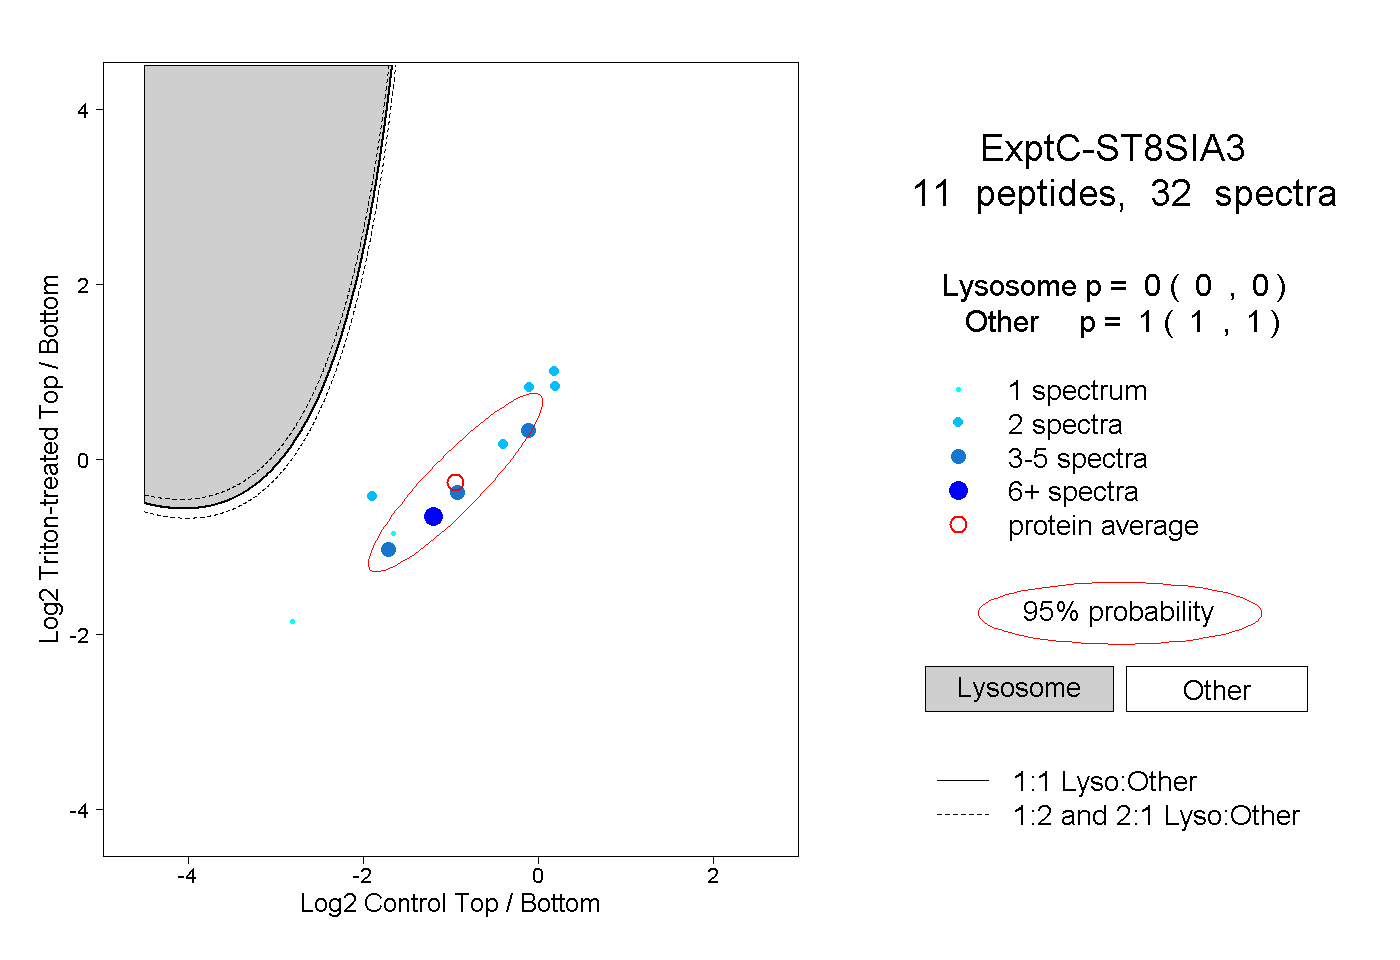
| Expt C |
11
peptides |
32
spectra |
 |
|
0.000
0.000 | 0.000 |
|
|
|
|
|
|
|
1.000
1.000 | 1.000 |
| 2 spectra, SDFVFR |
|
0.000 |
|
|
|
|
|
|
|
1.000 |
| 2 spectra, LTLSHCA |
|
0.000 |
|
|
|
|
|
|
|
1.000 |
| 1 spectrum, EDLPYHYYDK |
|
0.000 |
|
|
|
|
|
|
|
1.000 |
| 2 spectra, YYNNLLTIQDR |
|
0.000 |
|
|
|
|
|
|
|
1.000 |
| 2 spectra, ENIFTTPK |
|
0.000 |
|
|
|
|
|
|
|
1.000 |
| 3 spectra, QEILQHVDVIK |
|
0.000 |
|
|
|
|
|
|
|
1.000 |
| 4 spectra, TAFLHQR |
|
0.000 |
|
|
|
|
|
|
|
1.000 |
| 1 spectrum, SLLPDVSPILNK |
|
0.000 |
|
|
|
|
|
|
|
1.000 |
| 9 spectra, TLVDFFVEHR |
|
0.000 |
|
|
|
|
|
|
|
1.000 |
| 2 spectra, YVFSISNNFR |
|
0.000 |
|
|
|
|
|
|
|
1.000 |
| 4 spectra, YASPGAPR |
|
0.000 |
|
|
|
|
|
|
|
1.000 |