 10
10peptides
spectra
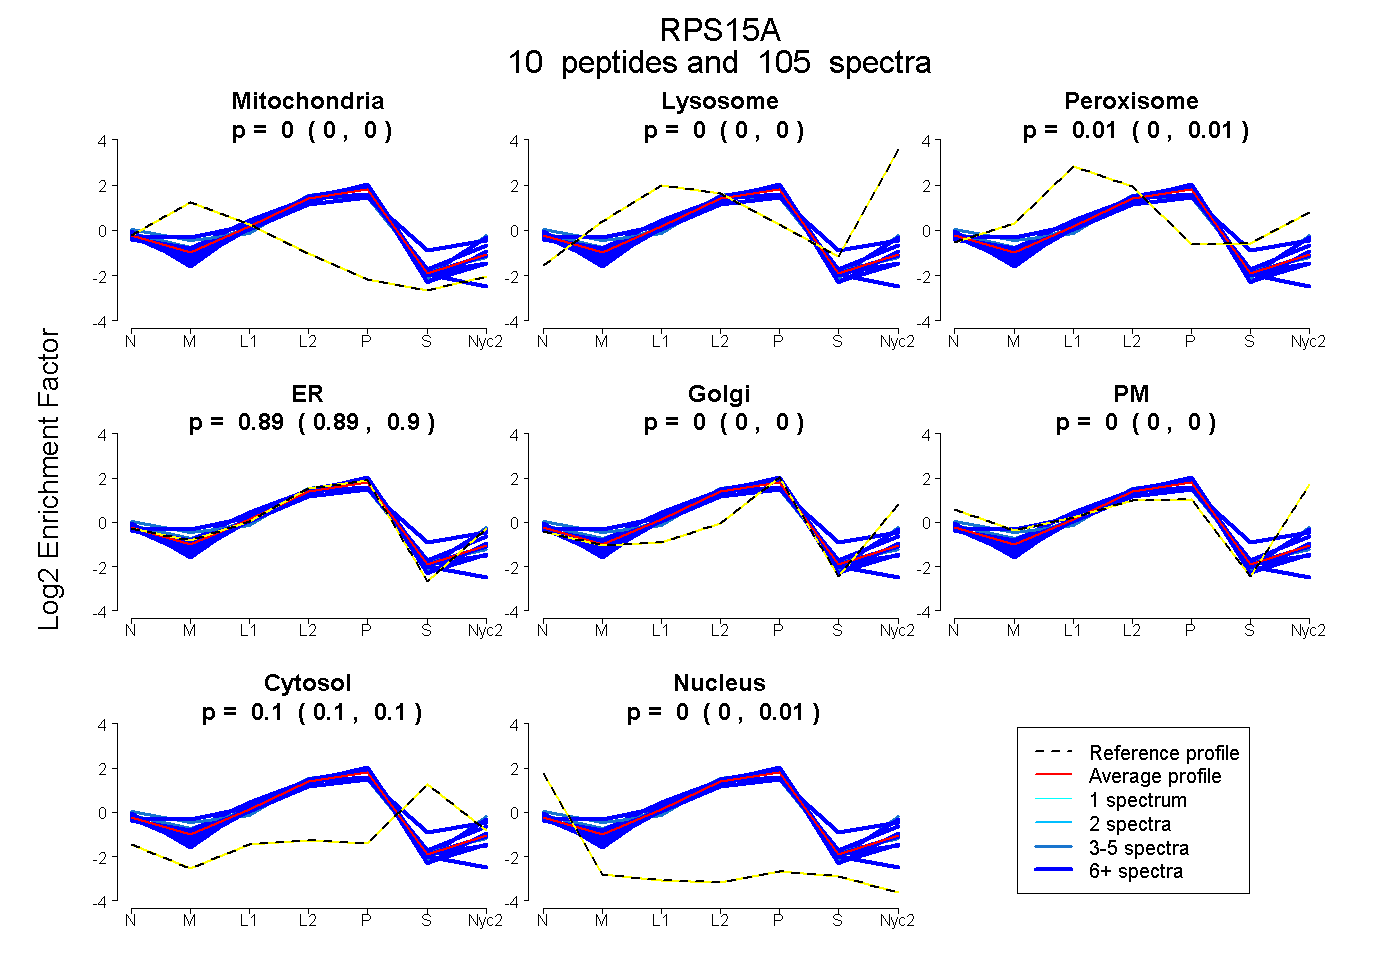
0.000 | 0.000
0.000 | 0.000
0.002 | 0.008
0.889 | 0.895
0.000 | 0.000
0.000 | 0.000
0.095 | 0.103
0.000 | 0.006
9peptides
spectra
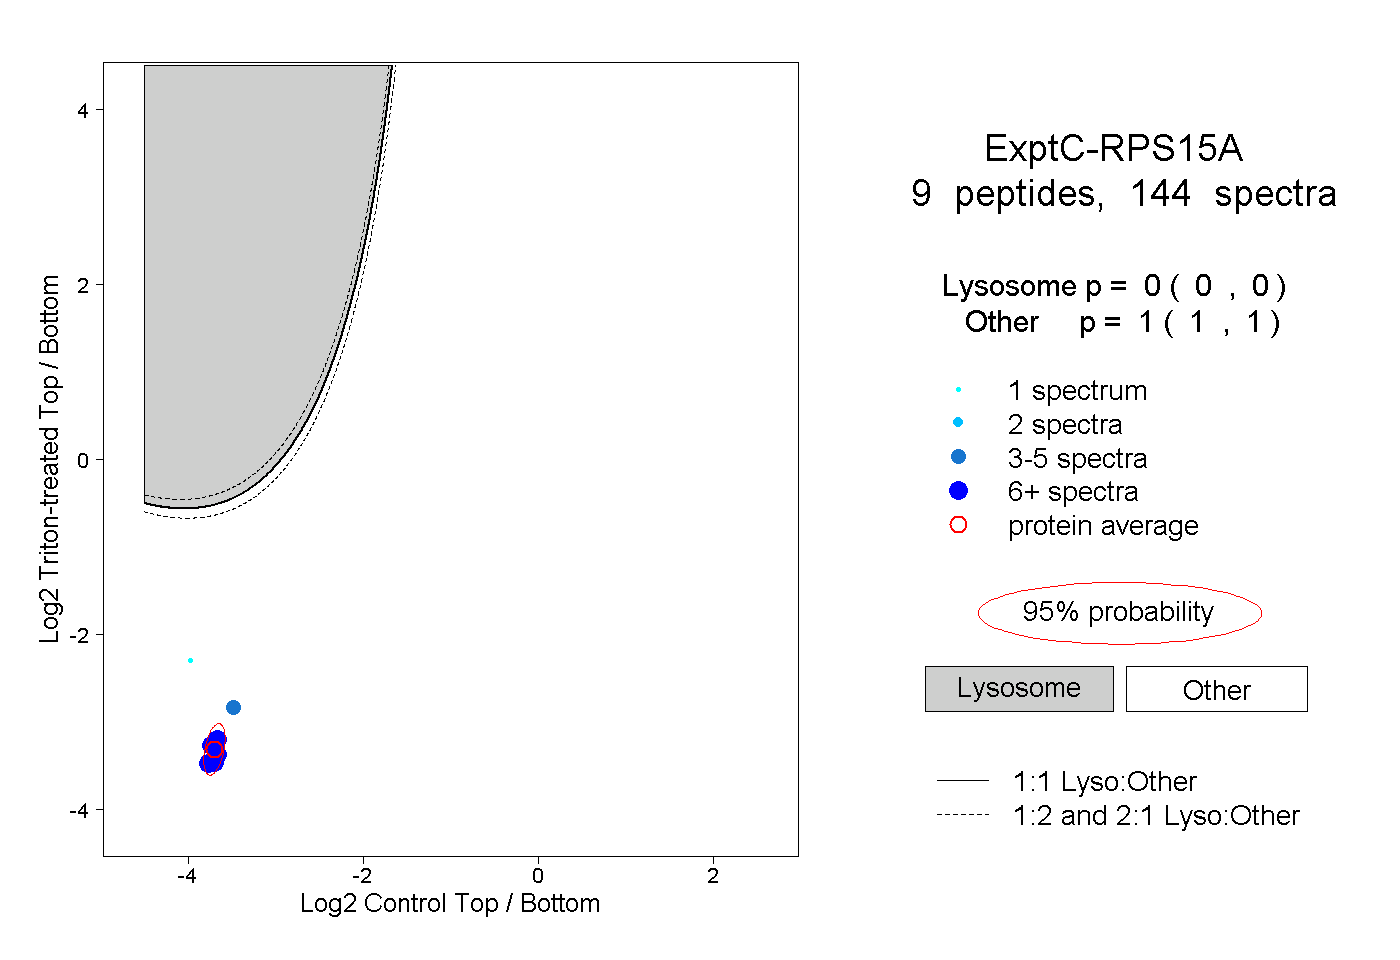
0.000 | 0.000
1.000 | 1.000
3peptides
spectra
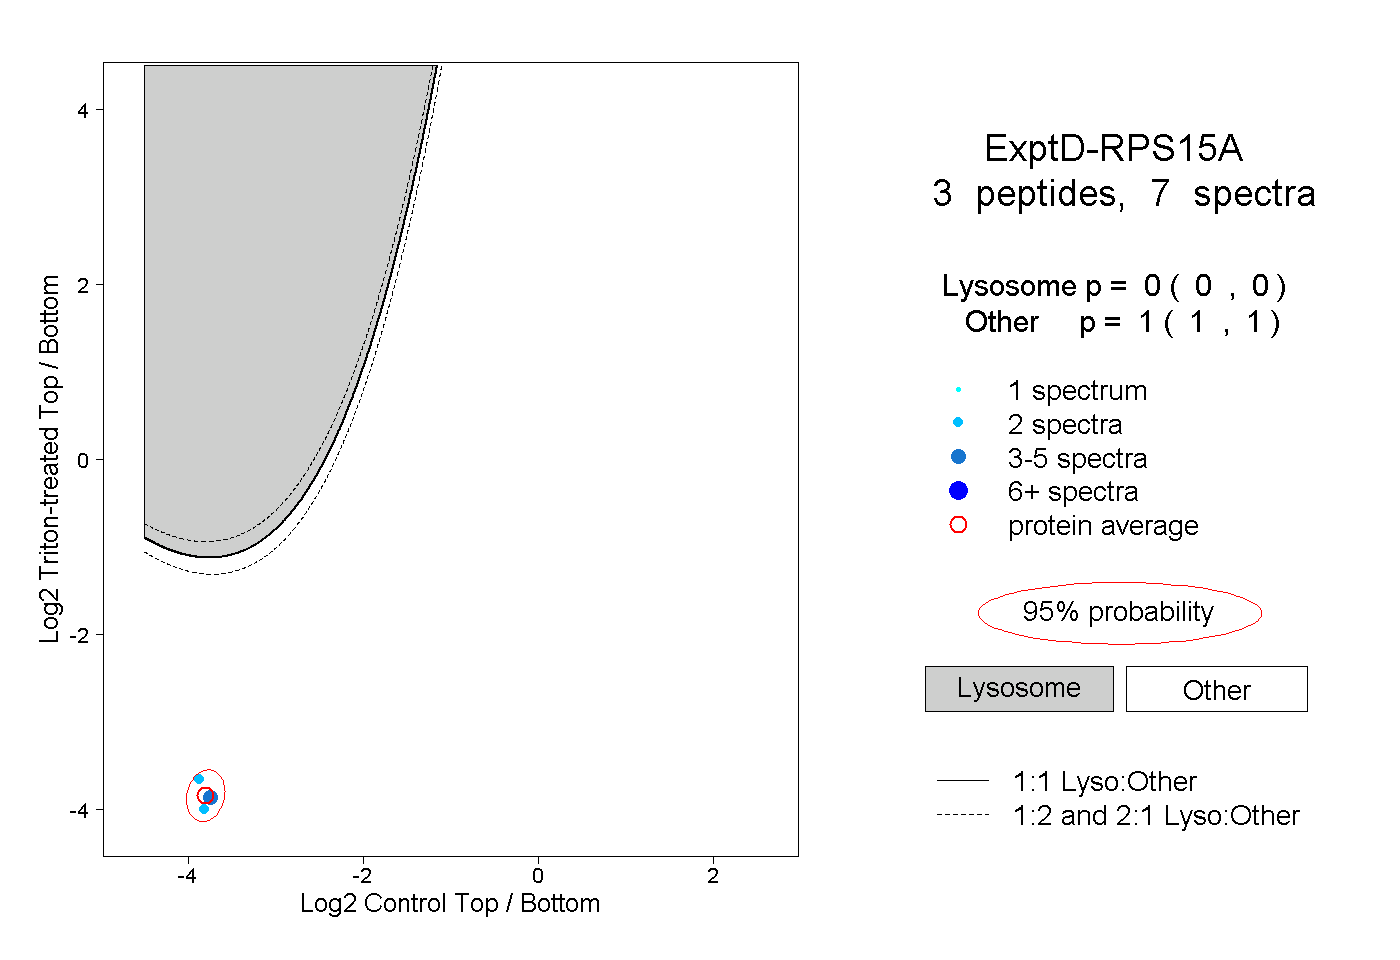
0.000 | 0.000
1.000 | 1.000