 10
10peptides
spectra
0.000 | 0.000
0.000 | 0.000
0.002 | 0.008
0.889 | 0.895
0.000 | 0.000
0.000 | 0.000
0.095 | 0.103
0.000 | 0.006
| Plot | Mito | Lyso | Perox | ER | Golgi | PM | Cytosol | Nucleus | |||||
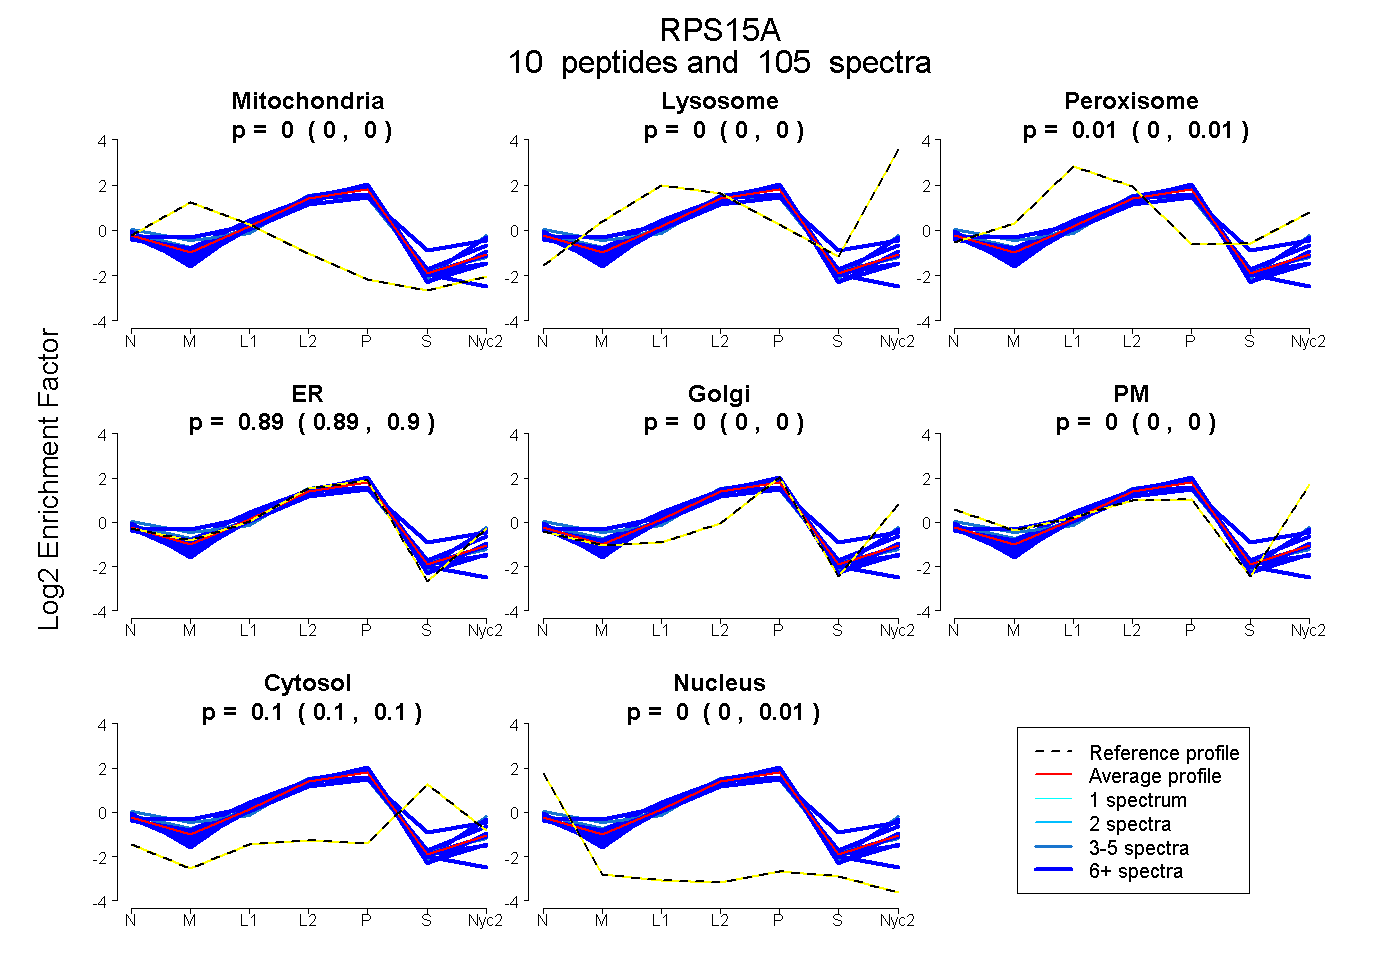
| Expt A |
10 peptides |
105 spectra |
|
0.000 0.000 | 0.000 |
0.000 0.000 | 0.000 |
0.005 0.002 | 0.008 |
0.892 0.889 | 0.895 |
0.000 0.000 | 0.000 |
0.000 0.000 | 0.000 |
0.100 0.095 | 0.103 |
0.003 0.000 | 0.006 |
| 8 spectra, QFGFIVLTTSAGIMDHEEAR | 0.000 | 0.000 | 0.117 | 0.672 | 0.000 | 0.000 | 0.210 | 0.000 | ||
| 15 spectra, MNVLADALK | 0.000 | 0.000 | 0.000 | 0.892 | 0.000 | 0.000 | 0.086 | 0.022 | ||
| 7 spectra, SINNAEK | 0.000 | 0.000 | 0.000 | 0.914 | 0.000 | 0.000 | 0.050 | 0.036 | ||
| 5 spectra, FDVQLK | 0.000 | 0.000 | 0.051 | 0.894 | 0.000 | 0.021 | 0.034 | 0.000 | ||
| 15 spectra, WQNNLLPSR | 0.039 | 0.000 | 0.111 | 0.785 | 0.000 | 0.000 | 0.065 | 0.000 | ||
| 11 spectra, CGVISPR | 0.000 | 0.000 | 0.000 | 0.928 | 0.000 | 0.000 | 0.014 | 0.058 | ||
| 4 spectra, HGYIGEFEIIDDHR | 0.096 | 0.000 | 0.000 | 0.828 | 0.000 | 0.000 | 0.073 | 0.003 | ||
| 8 spectra, QVLIRPCSK | 0.000 | 0.000 | 0.000 | 0.864 | 0.000 | 0.000 | 0.020 | 0.116 | ||
| 9 spectra, FLTVMMK | 0.000 | 0.000 | 0.095 | 0.864 | 0.000 | 0.000 | 0.041 | 0.000 | ||
| 23 spectra, IVVNLTGR | 0.000 | 0.000 | 0.000 | 0.901 | 0.000 | 0.000 | 0.093 | 0.006 |
| Plot | Lyso | Other | |||||||||||
| Expt C |
9 peptides |
144 spectra |
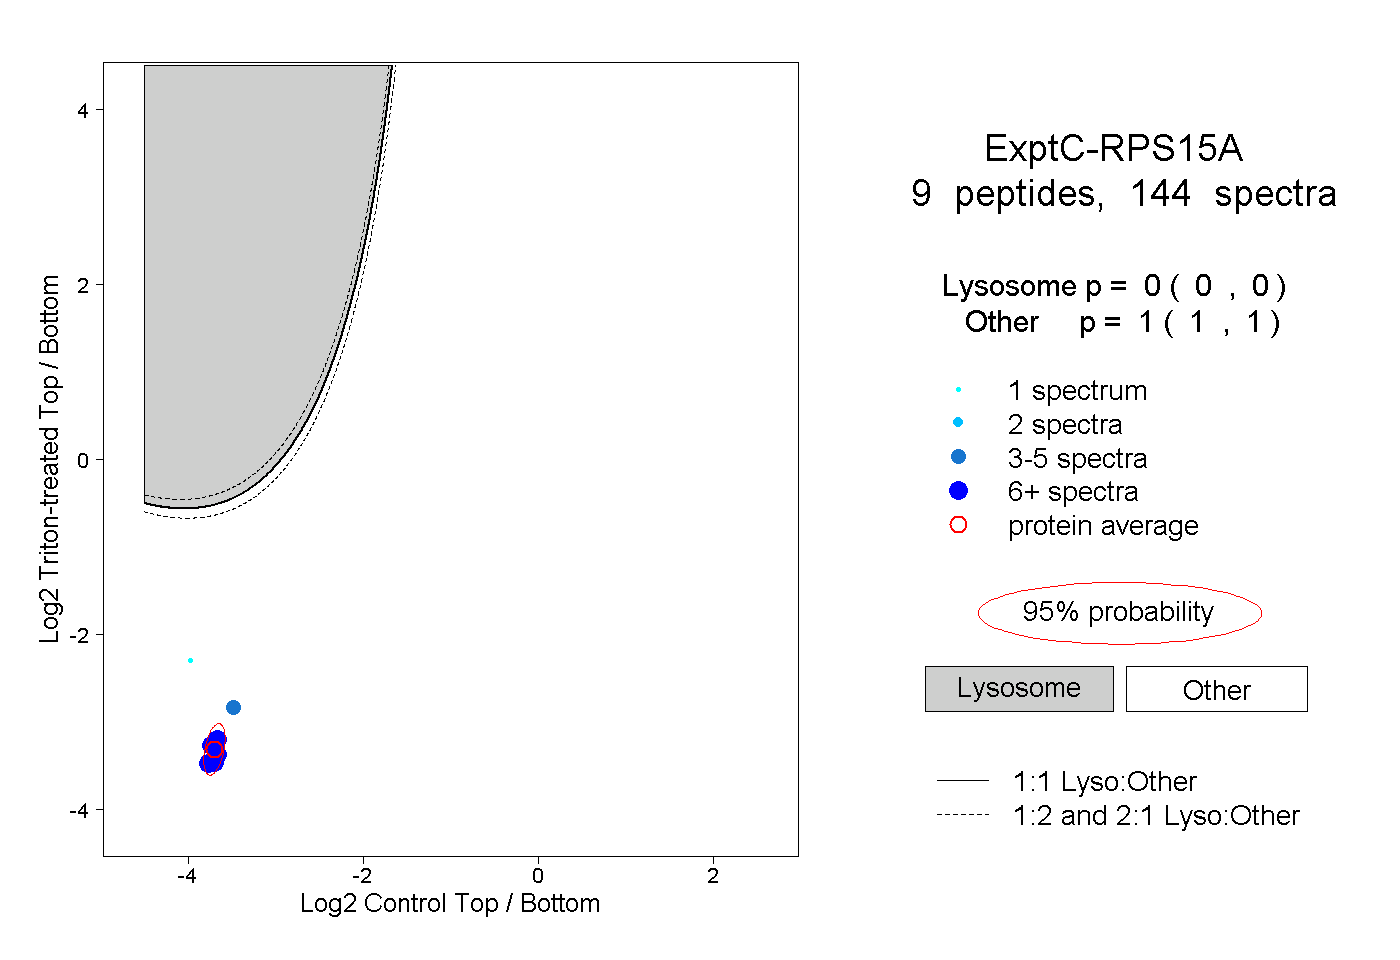 |
0.000 0.000 | 0.000 |
1.000 1.000 | 1.000 |
||||||||
| Plot | Lyso | Other | |||||||||||
| Expt D |
3 peptides |
7 spectra |
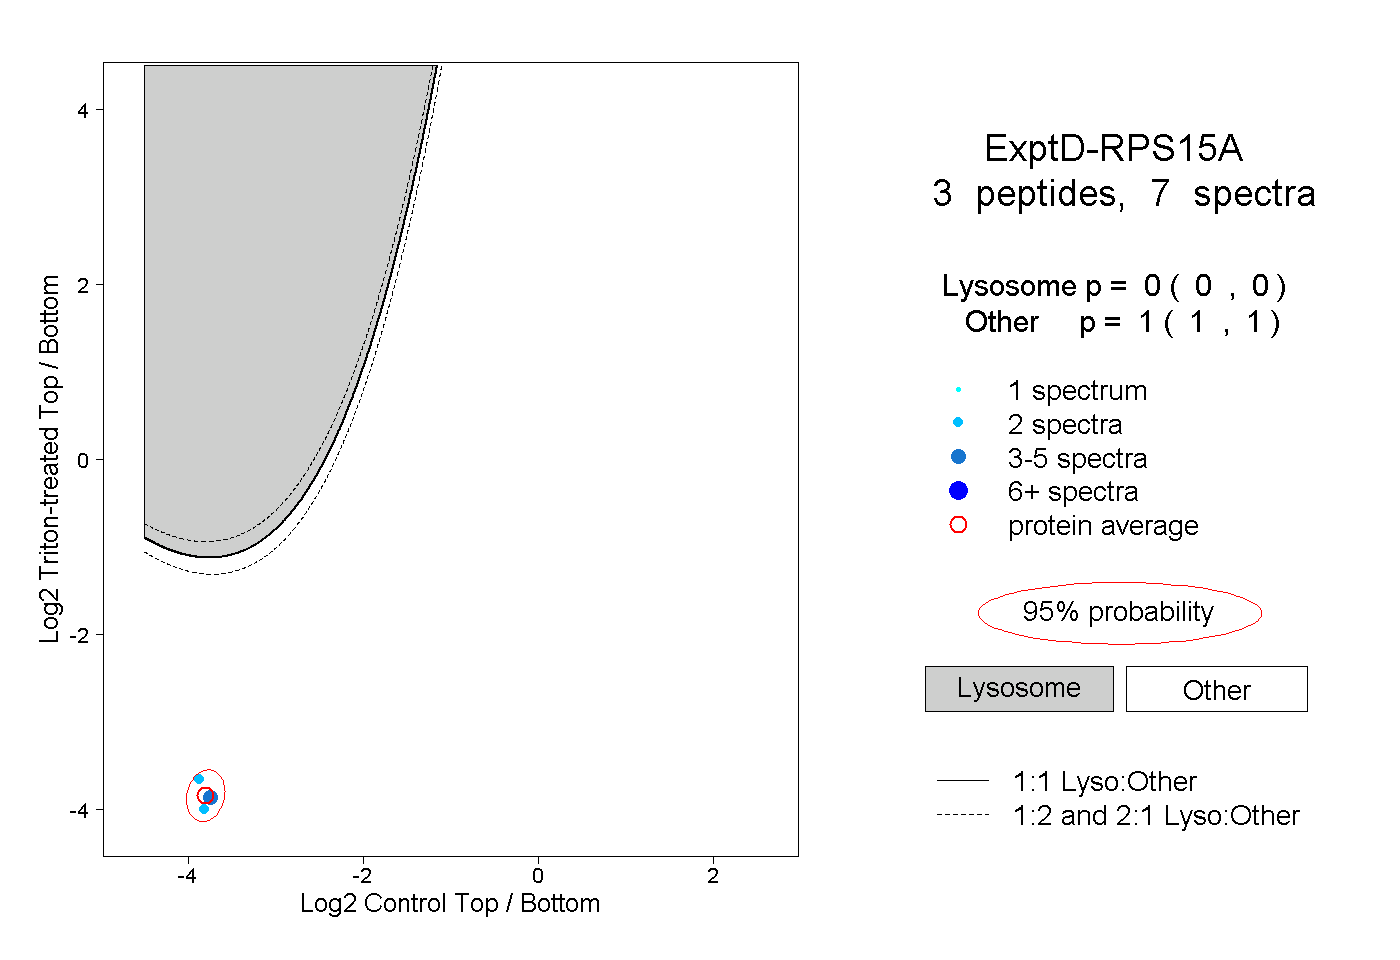 |
0.000 0.000 | 0.000 |
1.000 1.000 | 1.000 |