 10
10peptides
spectra
0.000 | 0.000
0.000 | 0.000
0.002 | 0.008
0.889 | 0.895
0.000 | 0.000
0.000 | 0.000
0.095 | 0.103
0.000 | 0.006
9peptides
spectra
0.000 | 0.000
1.000 | 1.000
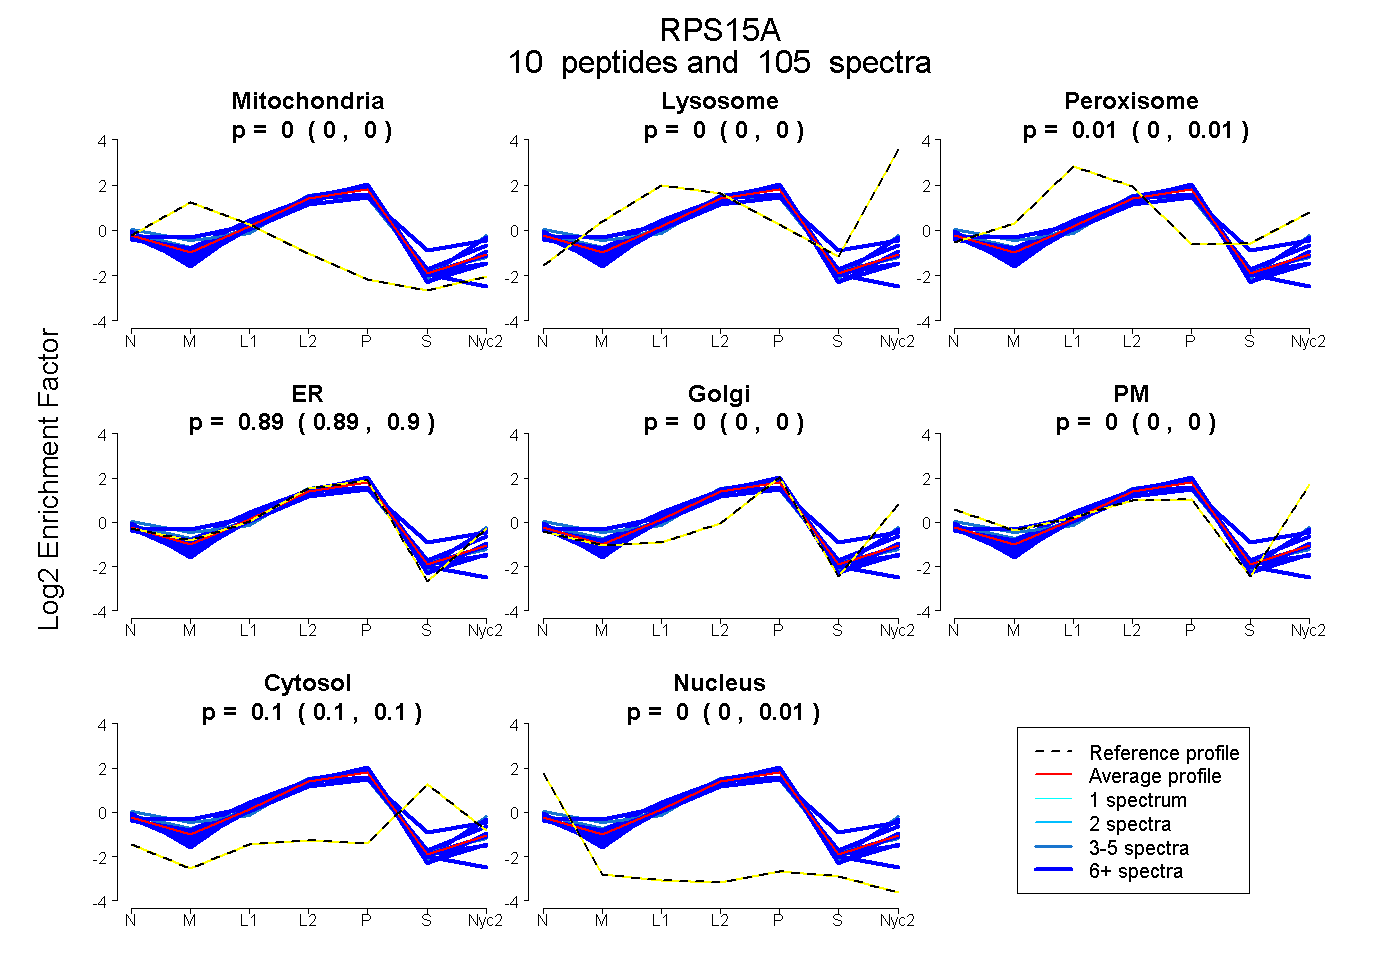
| Plot | Mito | Lyso | Perox | ER | Golgi | PM | Cytosol | Nucleus | |||||
| Expt A |
10 peptides |
105 spectra |
|
0.000 0.000 | 0.000 |
0.000 0.000 | 0.000 |
0.005 0.002 | 0.008 |
0.892 0.889 | 0.895 |
0.000 0.000 | 0.000 |
0.000 0.000 | 0.000 |
0.100 0.095 | 0.103 |
0.003 0.000 | 0.006 |
||
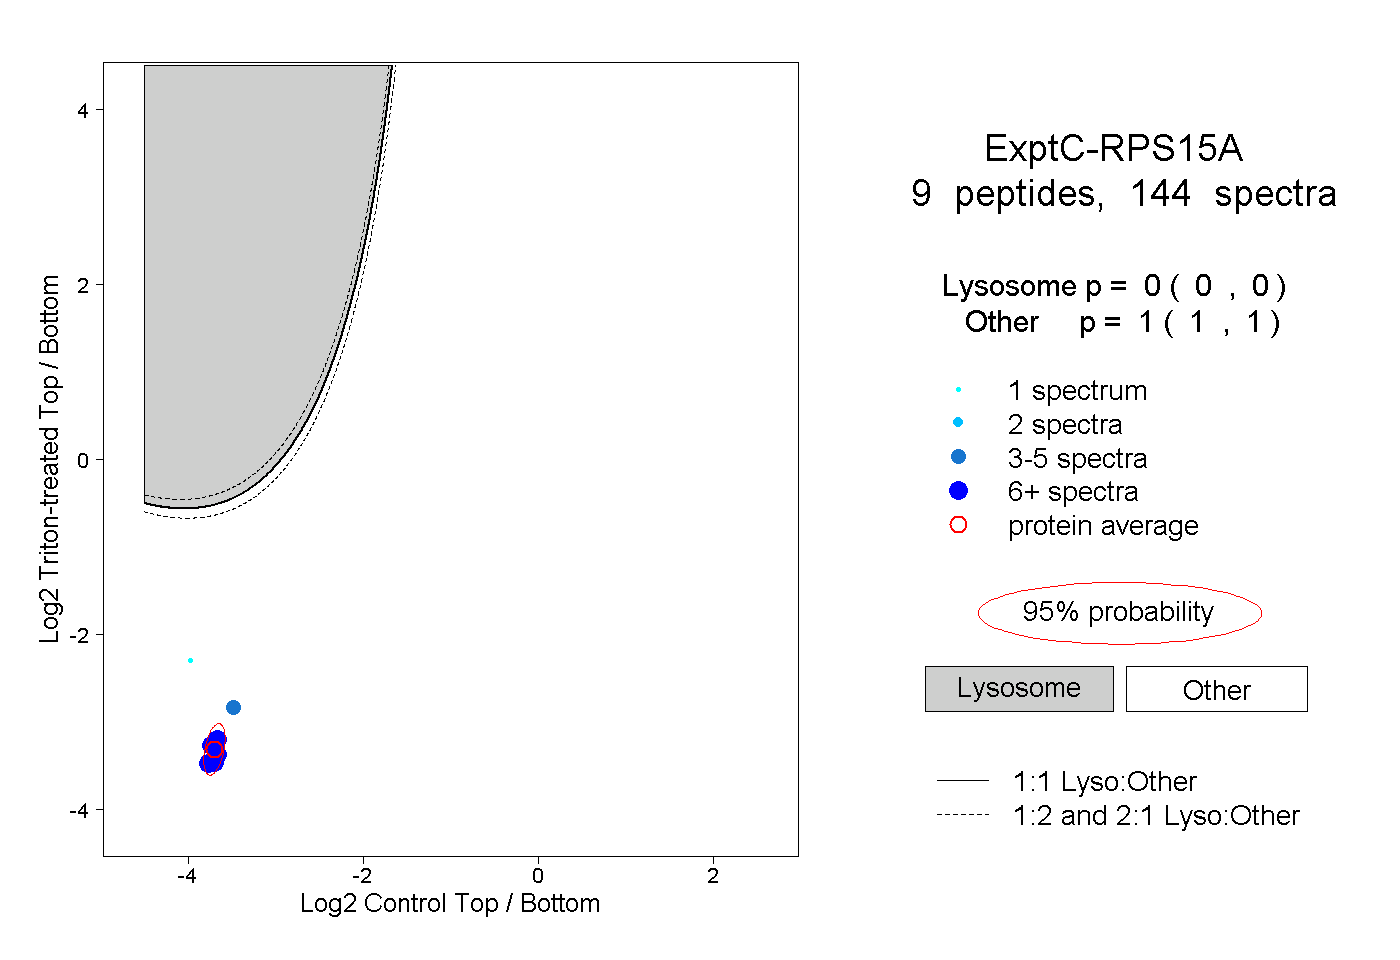
| Plot | Lyso | Other | |||||||||||
| Expt C |
9 peptides |
144 spectra |
|
0.000 0.000 | 0.000 |
1.000 1.000 | 1.000 |
| 1 spectrum, QFGFIVLTTSAGIMDHEEAR | 0.000 | 1.000 | ||||||||
| 25 spectra, MNVLADALK | 0.000 | 1.000 | ||||||||
| 35 spectra, SINNAEK | 0.000 | 1.000 | ||||||||
| 14 spectra, FDVQLK | 0.000 | 1.000 | ||||||||
| 6 spectra, WQNNLLPSR | 0.000 | 1.000 | ||||||||
| 5 spectra, CGVISPR | 0.000 | 1.000 | ||||||||
| 12 spectra, QVLIRPCSK | 0.000 | 1.000 | ||||||||
| 18 spectra, FLTVMMK | 0.000 | 1.000 | ||||||||
| 28 spectra, IVVNLTGR | 0.000 | 1.000 |
| Plot | Lyso | Other | |||||||||||
| Expt D |
3 peptides |
7 spectra |
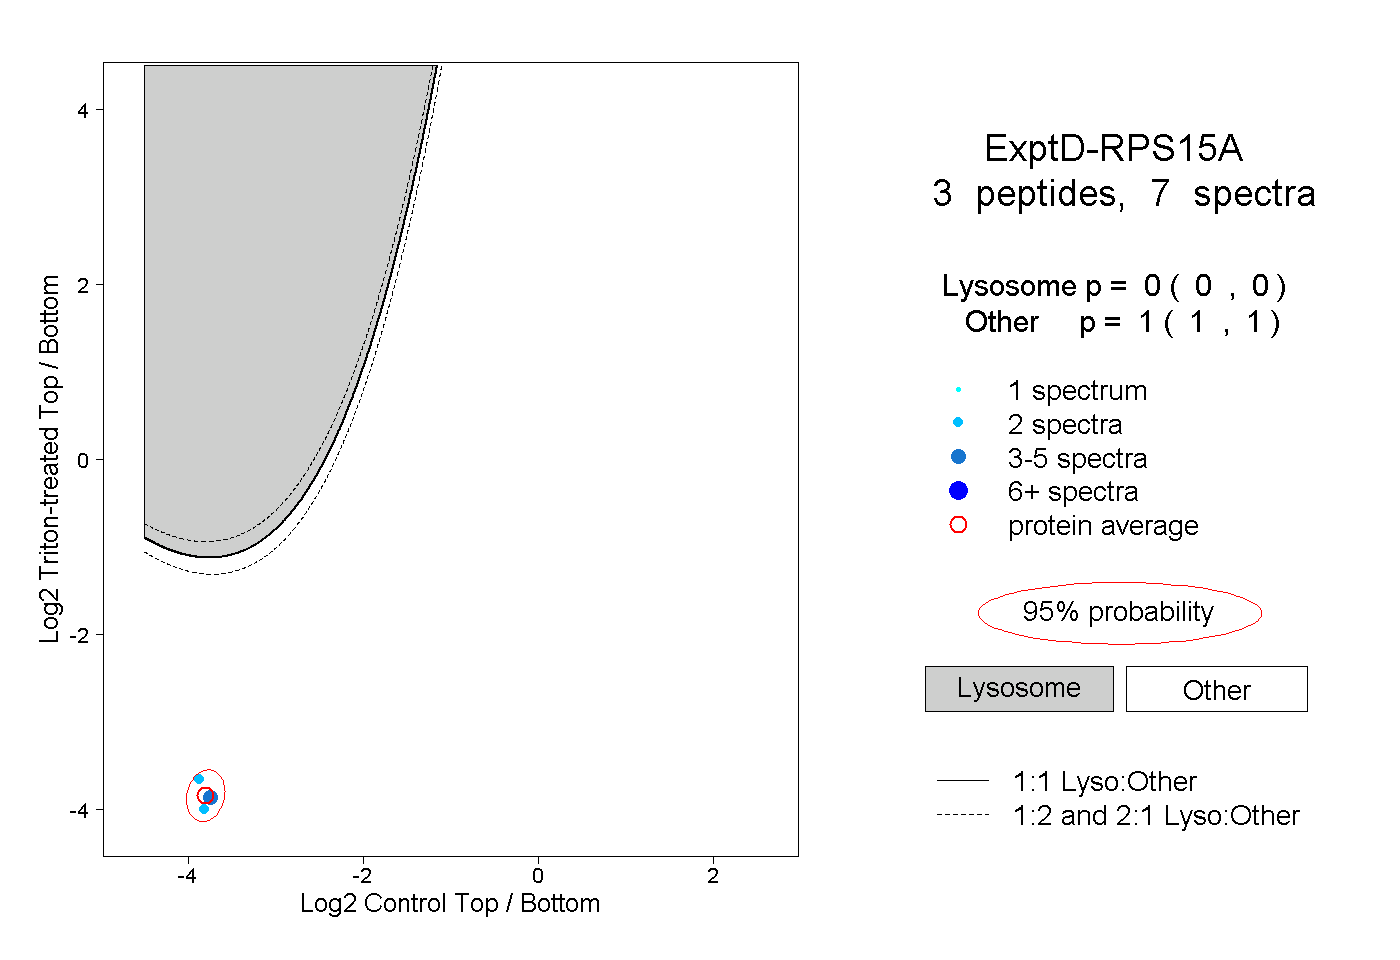 |
0.000 0.000 | 0.000 |
1.000 1.000 | 1.000 |