 7
7peptides
spectra
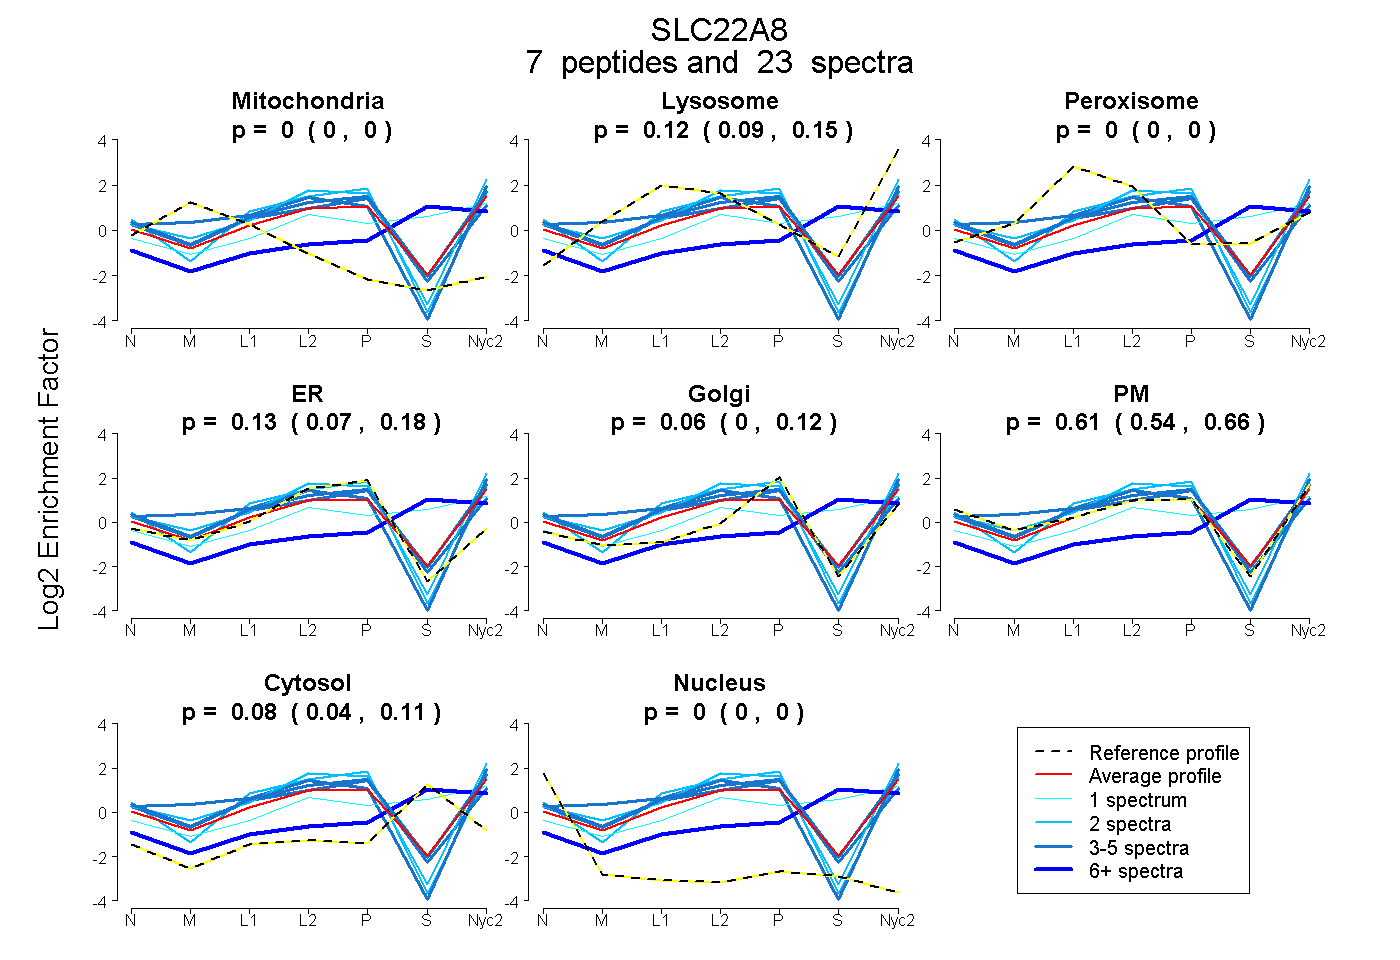
0.000 | 0.000
0.090 | 0.145
0.000 | 0.000
0.073 | 0.179
0.000 | 0.124
0.535 | 0.658
0.043 | 0.111
0.000 | 0.000
1peptide
spectrum
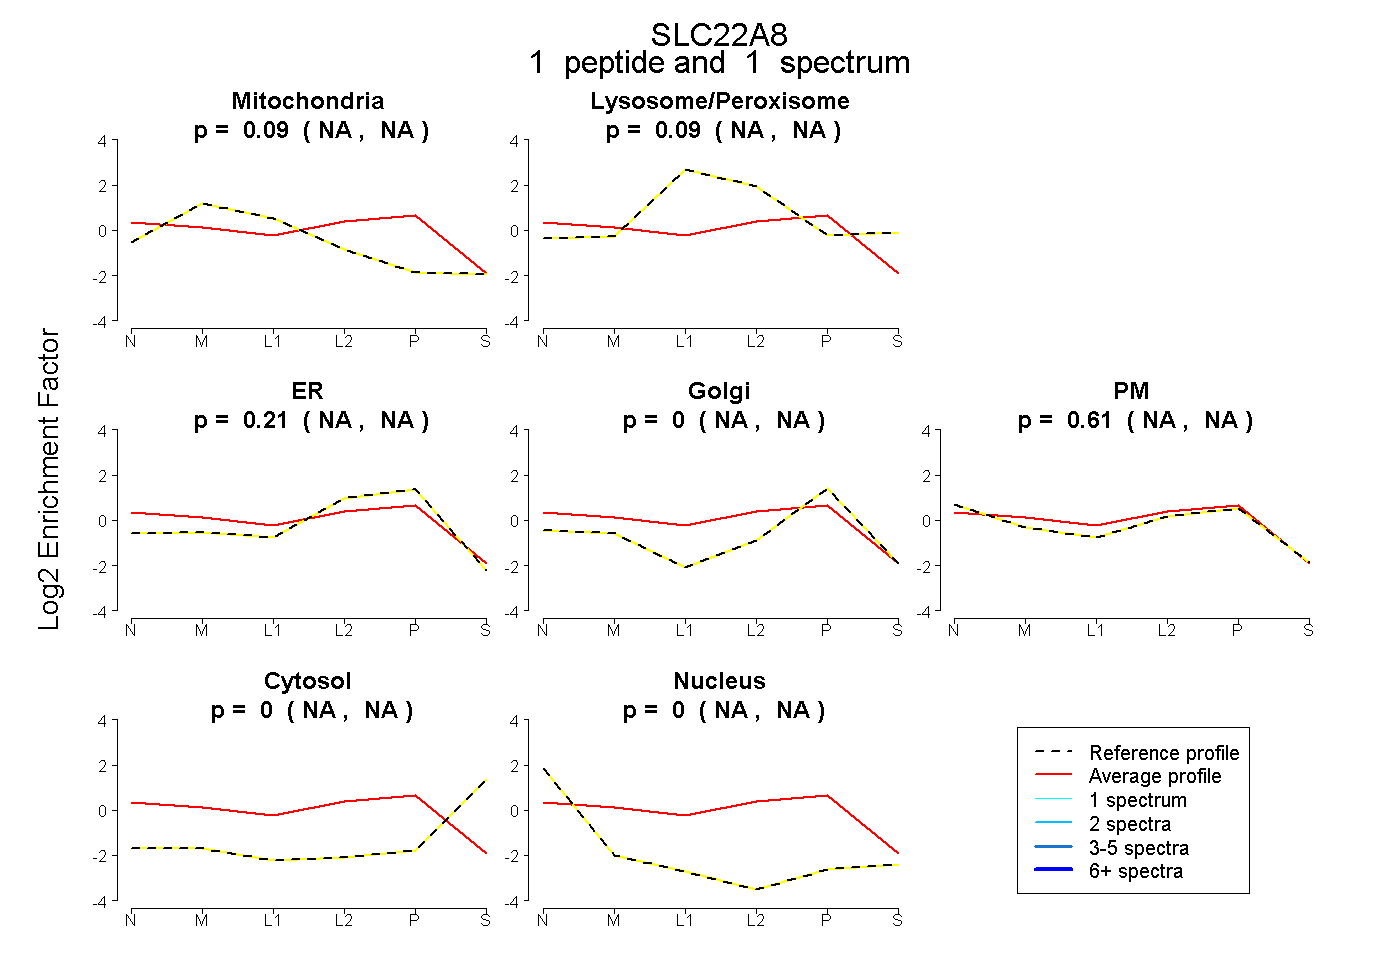
NA | NA
NA | NA
NA | NA
NA | NA
NA | NA
NA | NA
NA | NA
8peptides
spectra
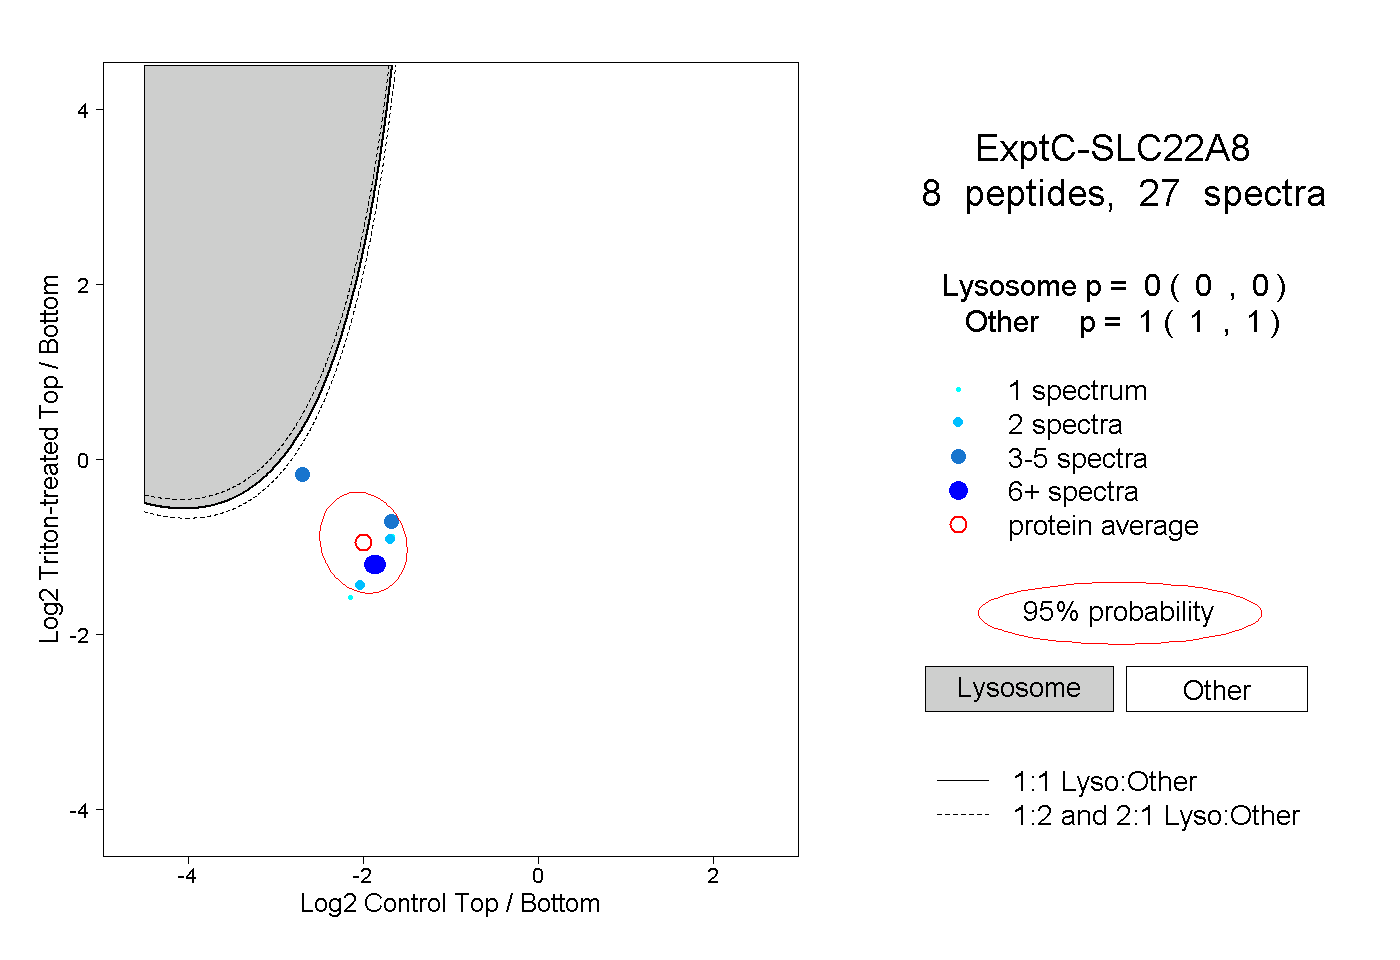
0.000 | 0.000
1.000 | 1.000
1peptide
spectrum
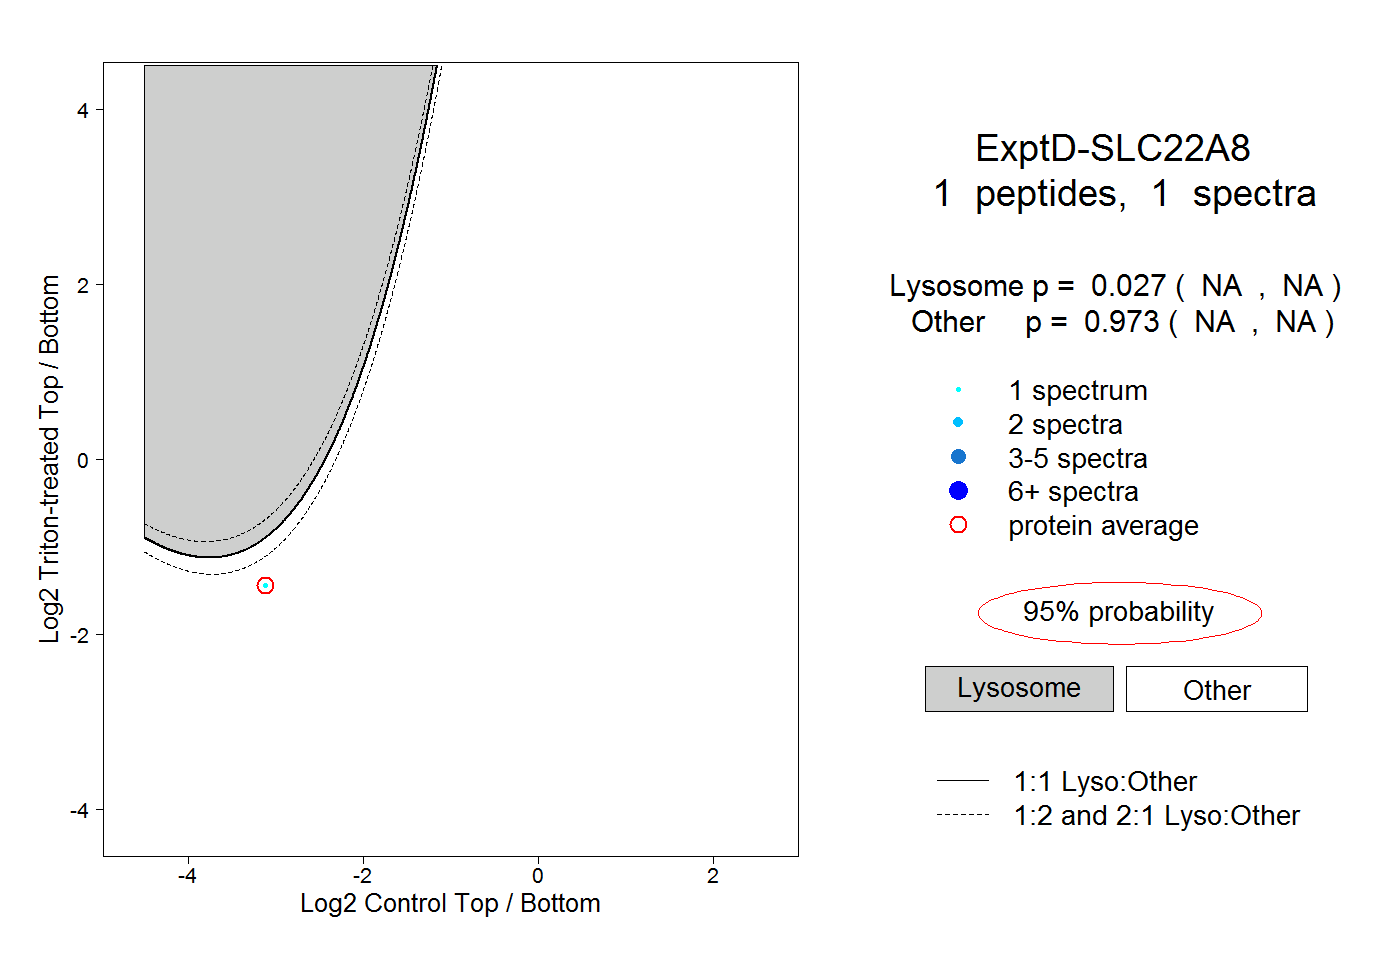
NA | NA
NA | NA