 7
7peptides
spectra
0.000 | 0.000
0.090 | 0.145
0.000 | 0.000
0.073 | 0.179
0.000 | 0.124
0.535 | 0.658
0.043 | 0.111
0.000 | 0.000
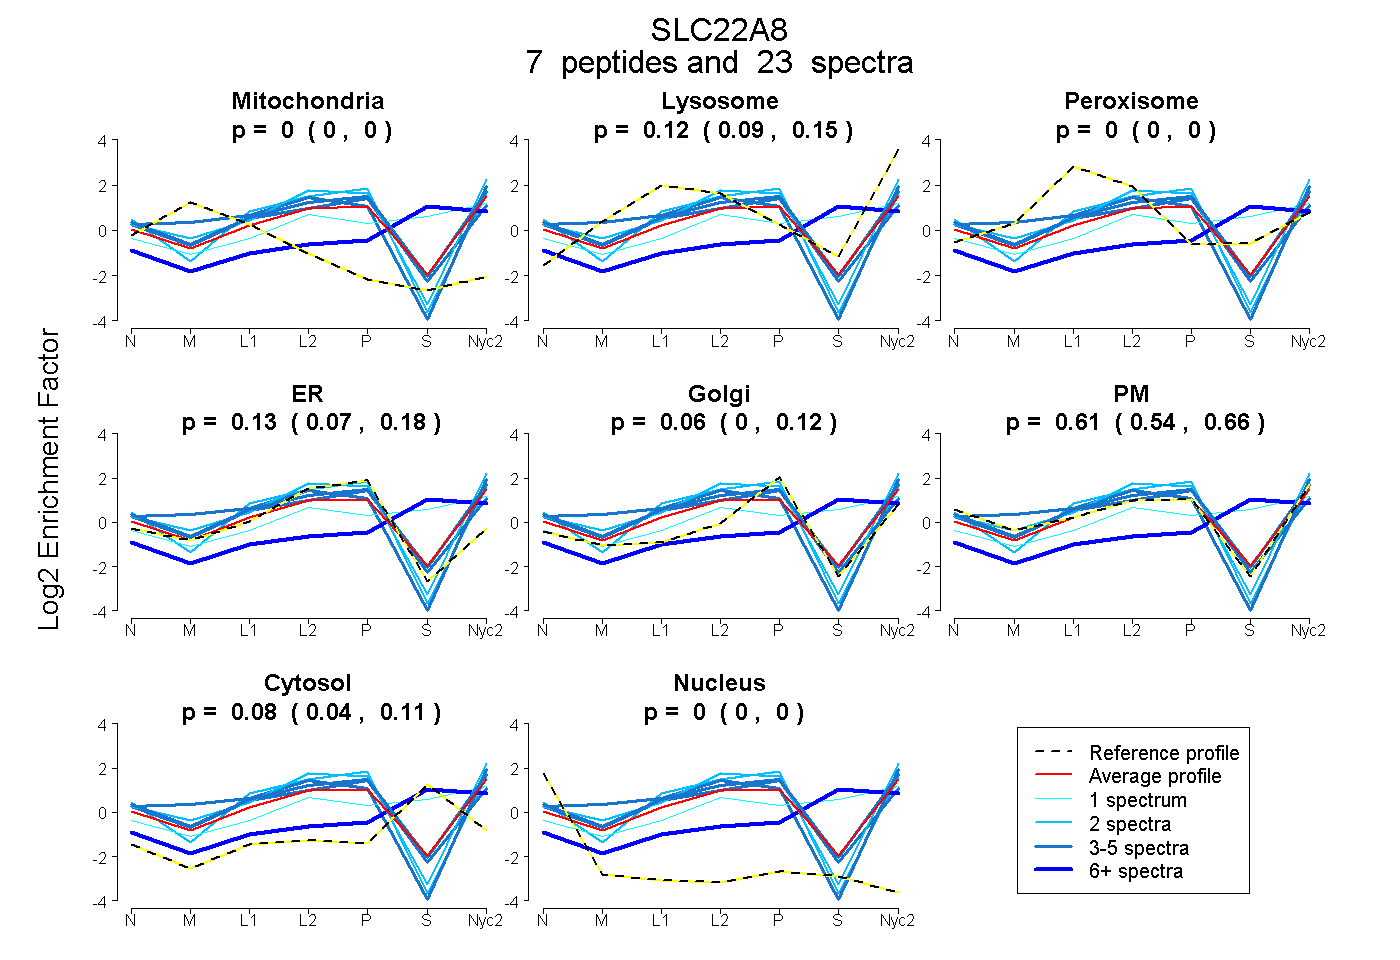
| Plot | Mito | Lyso | Perox | ER | Golgi | PM | Cytosol | Nucleus | |||||
| Expt A |
7 peptides |
23 spectra |
|
0.000 0.000 | 0.000 |
0.118 0.090 | 0.145 |
0.000 0.000 | 0.000 |
0.133 0.073 | 0.179 |
0.061 0.000 | 0.124 |
0.608 0.535 | 0.658 |
0.080 0.043 | 0.111 |
0.000 0.000 | 0.000 |
| 3 spectra, YGLSDLFR | 0.000 | 0.124 | 0.000 | 0.175 | 0.006 | 0.694 | 0.000 | 0.000 | ||
| 4 spectra, QTGMGISNVWAR | 0.000 | 0.057 | 0.000 | 0.027 | 0.000 | 0.916 | 0.000 | 0.000 | ||
| 3 spectra, LTIEELK | 0.000 | 0.000 | 0.103 | 0.215 | 0.142 | 0.541 | 0.000 | 0.000 | ||
| 1 spectrum, TALAVFGK | 0.000 | 0.250 | 0.018 | 0.000 | 0.000 | 0.281 | 0.451 | 0.000 | ||
| 2 spectra, ASQIIPLK | 0.000 | 0.000 | 0.000 | 0.314 | 0.000 | 0.686 | 0.000 | 0.000 | ||
| 8 spectra, VSILR | 0.000 | 0.199 | 0.000 | 0.000 | 0.025 | 0.064 | 0.712 | 0.000 | ||
| 2 spectra, WLVLSGK | 0.000 | 0.094 | 0.000 | 0.098 | 0.000 | 0.809 | 0.000 | 0.000 |
| Plot | Mito | Lyso or Perox | ER | Golgi | PM | Cytosol | Nucleus | ||||||
| Expt B |
1 peptide |
1 spectrum |
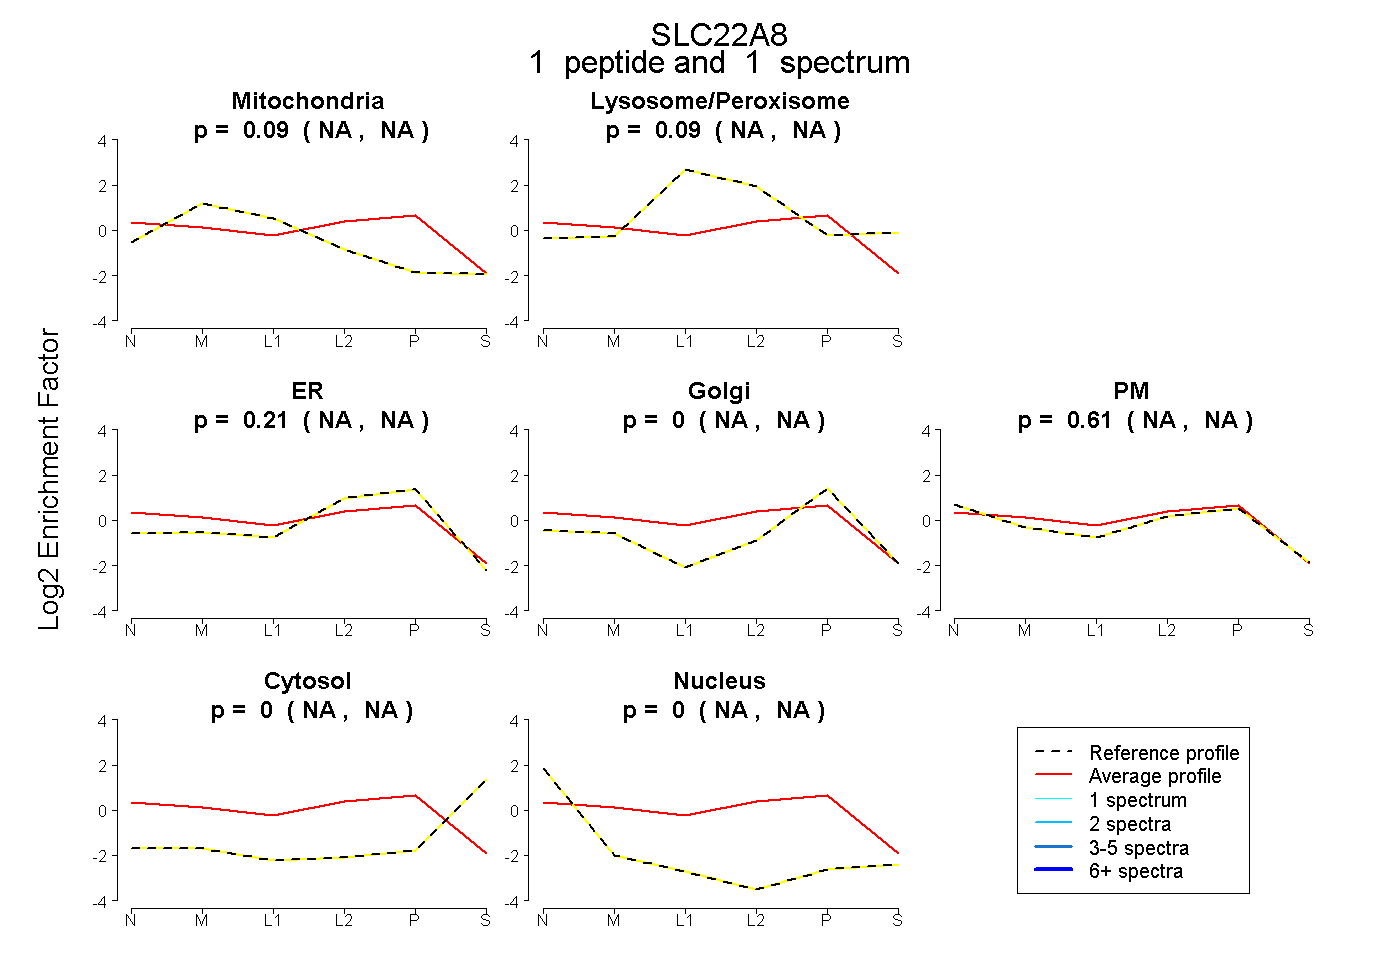 |
0.093 NA | NA |
0.087 NA | NA |
0.212 NA | NA |
0.000 NA | NA |
0.609 NA | NA |
0.000 NA | NA |
0.000 NA | NA |
|||
| Plot | Lyso | Other | |||||||||||
| Expt C |
8 peptides |
27 spectra |
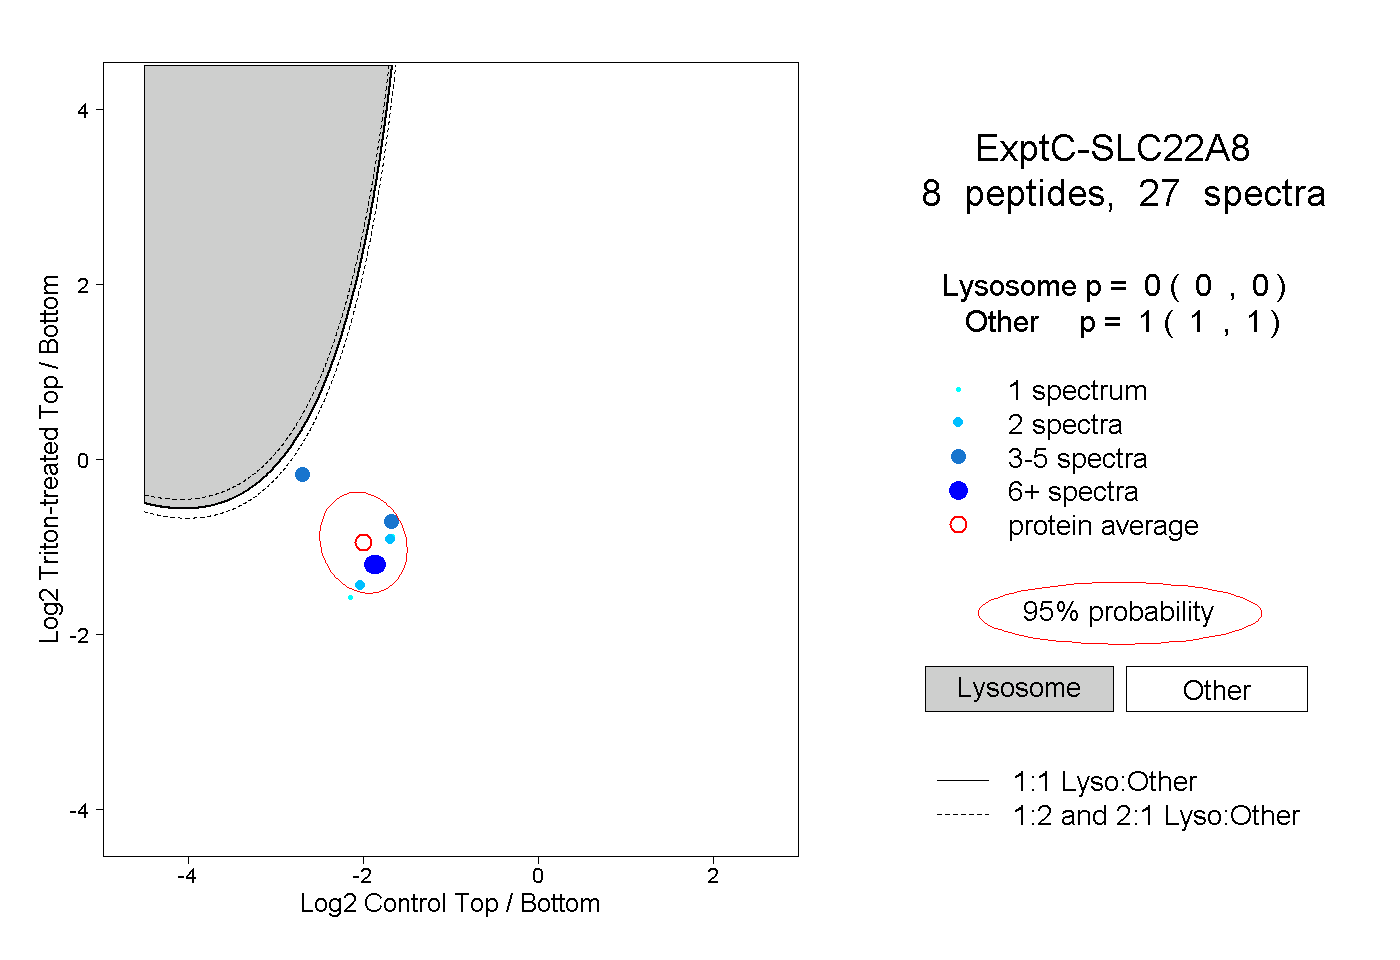 |
0.000 0.000 | 0.000 |
1.000 1.000 | 1.000 |
||||||||
| Plot | Lyso | Other | |||||||||||
| Expt D |
1 peptide |
1 spectrum |
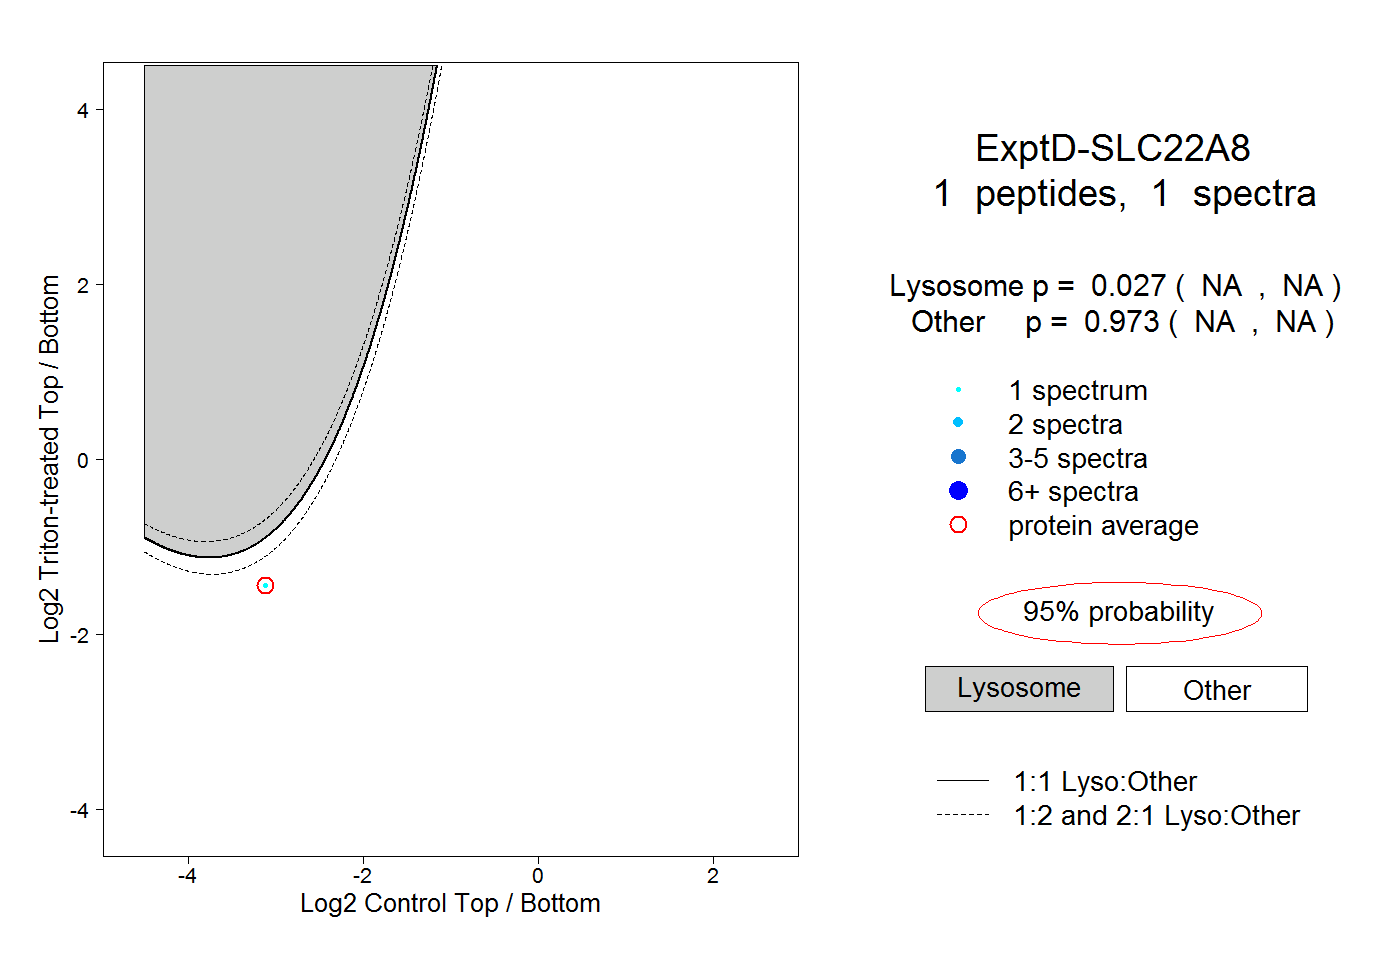 |
0.027 NA | NA |
0.973 NA | NA |