SLC22A8
[ENSRNOP00000024488]
Main page
| | | Plot |
Mito |
Lyso |
|
Perox |
ER |
Golgi |
PM |
Cytosol |
Nucleus |
|
| Expt A |
 7
7
peptides |
23
spectra |
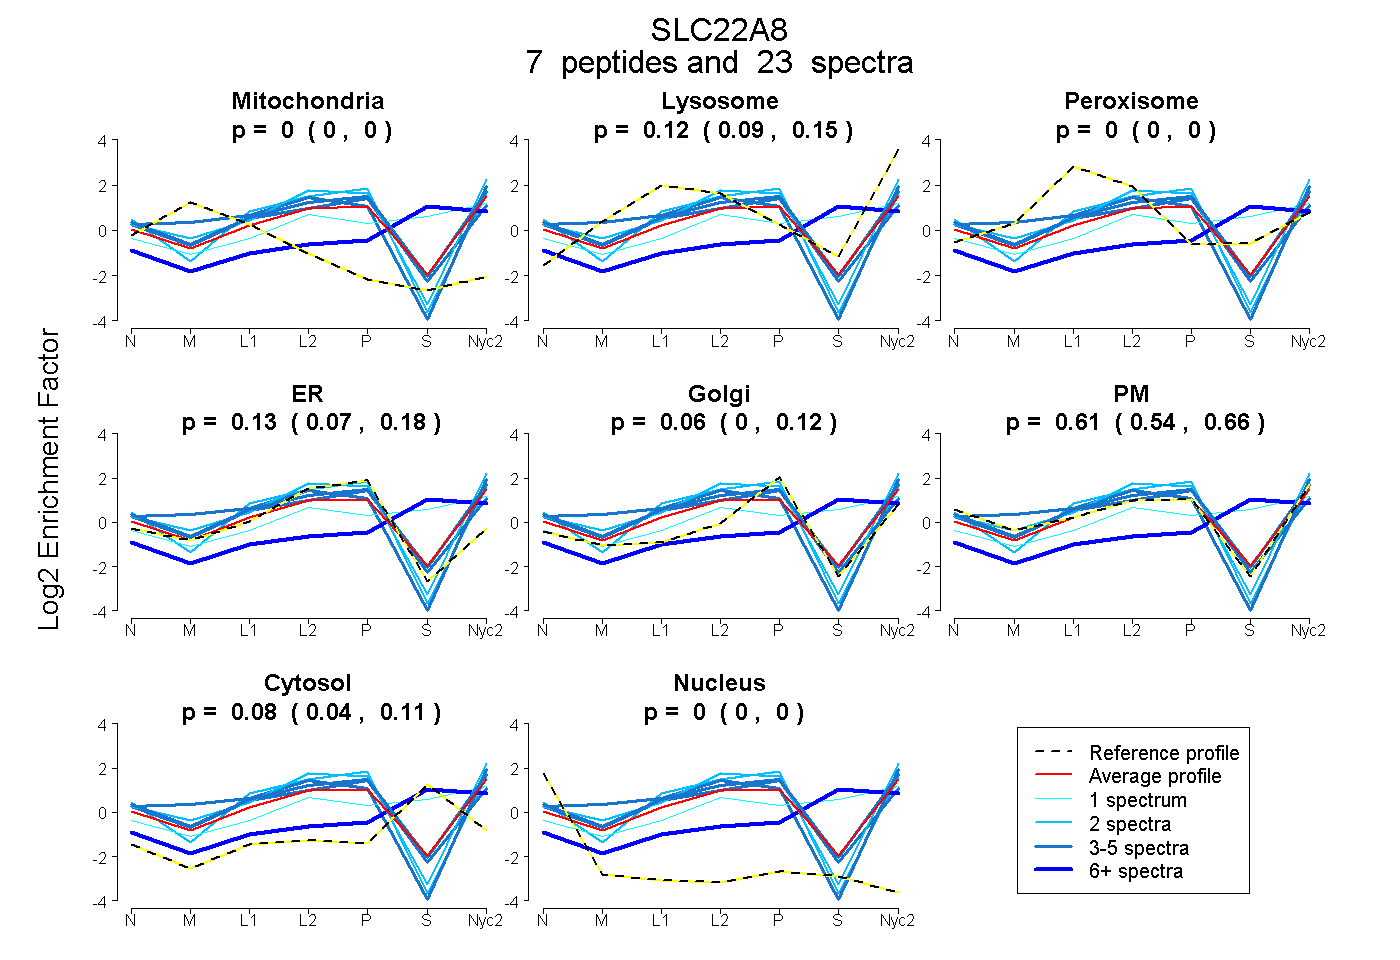 |
0.000
0.000 | 0.000 |
0.118
0.090 | 0.145 |
|
0.000
0.000 | 0.000 |
0.133
0.073 | 0.179 |
0.061
0.000 | 0.124 |
0.608
0.535 | 0.658 |
0.080
0.043 | 0.111 |
0.000
0.000 | 0.000 |
|
| | | Plot |
Mito |
|
Lyso or Perox |
|
ER |
Golgi |
PM |
Cytosol |
Nucleus |
|
| Expt B |
1
peptide |
1
spectrum |
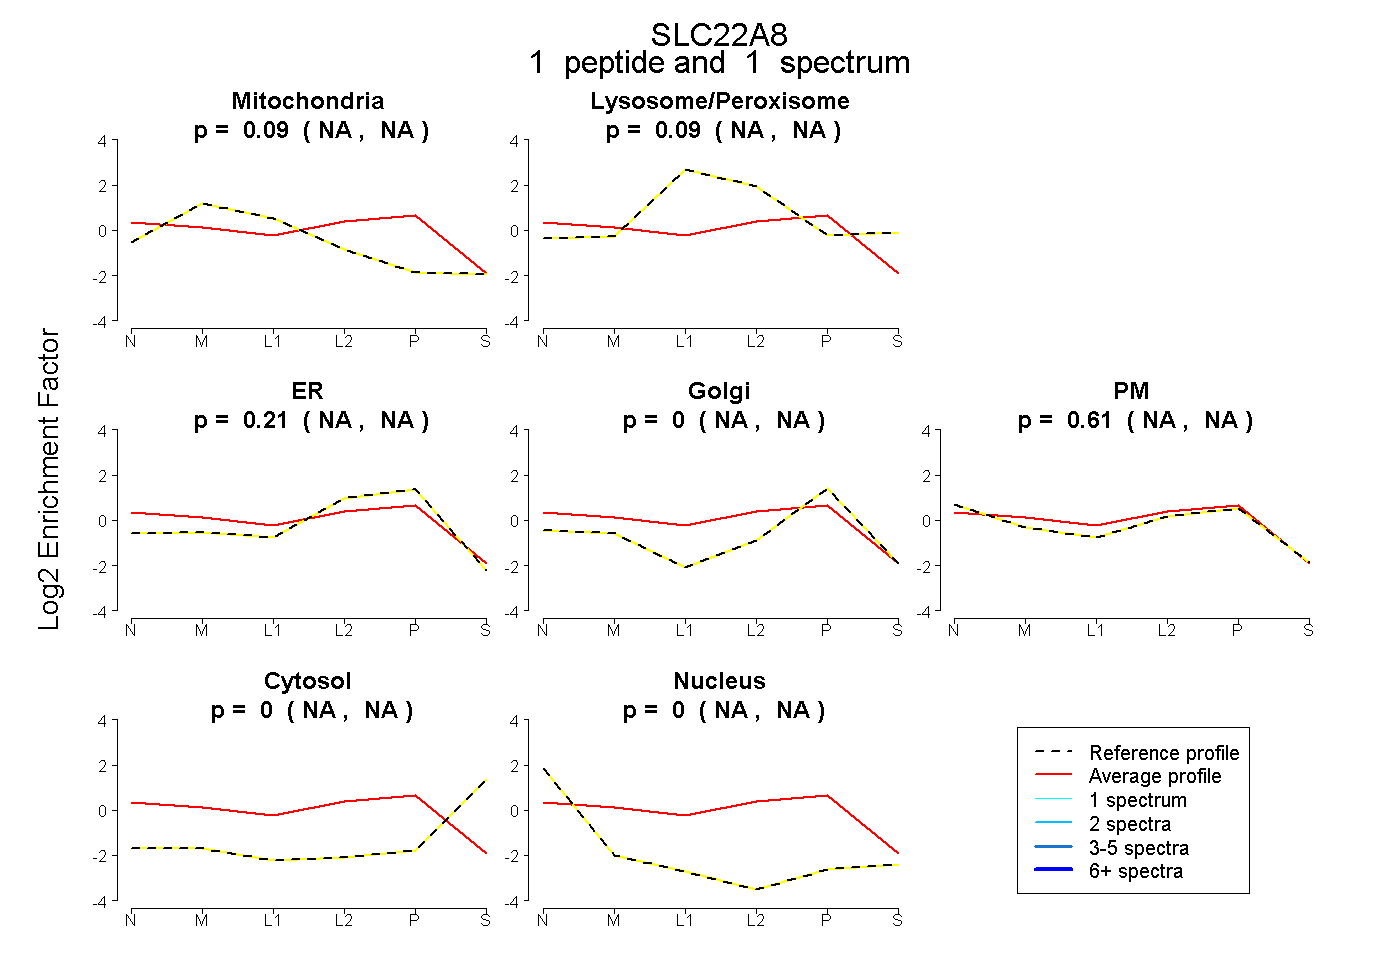 |
0.093
NA | NA |
|
0.087
NA | NA |
|
0.212
NA | NA |
0.000
NA | NA |
0.609
NA | NA |
0.000
NA | NA |
0.000
NA | NA |
|
| | | Plot |
|
Lyso |
|
|
|
|
|
|
|
Other |
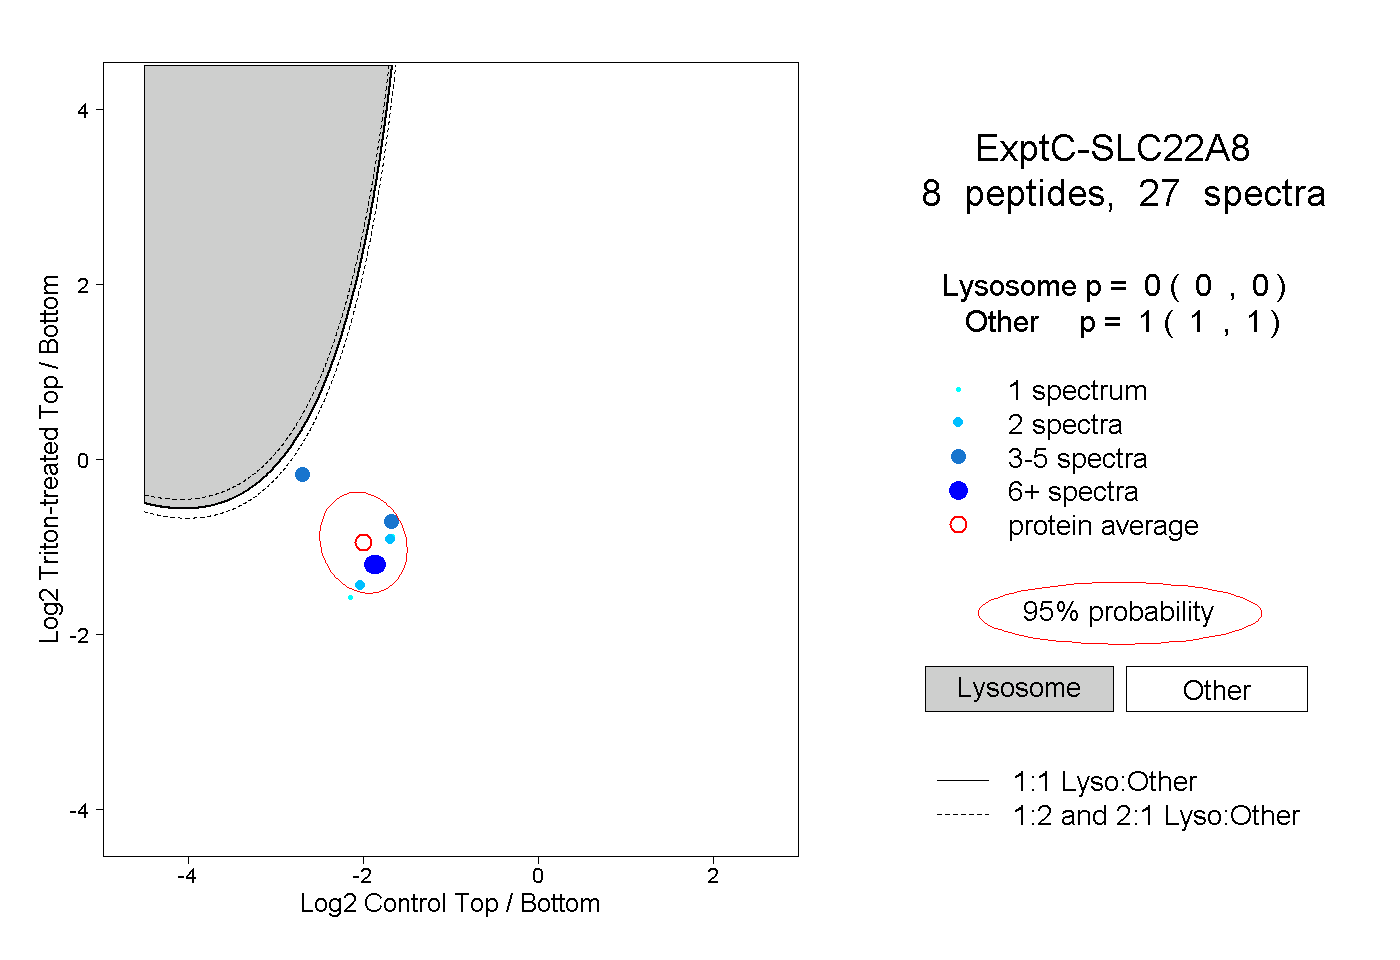
| Expt C |
8
peptides |
27
spectra |
 |
|
0.000
0.000 | 0.000 |
|
|
|
|
|
|
|
1.000
1.000 | 1.000 |
| 5 spectra, VSILR |
|
0.011 |
|
|
|
|
|
|
|
0.989 |
| 2 spectra, WLVLSGK |
|
0.000 |
|
|
|
|
|
|
|
1.000 |
| 3 spectra, YGLSDLFR |
|
0.000 |
|
|
|
|
|
|
|
1.000 |
| 1 spectrum, DITSAK |
|
0.000 |
|
|
|
|
|
|
|
1.000 |
| 2 spectra, LTIEELK |
|
0.000 |
|
|
|
|
|
|
|
1.000 |
| 7 spectra, ASQIIPLK |
|
0.000 |
|
|
|
|
|
|
|
1.000 |
| 1 spectrum, VGSMIAPLVK |
|
0.000 |
|
|
|
|
|
|
|
1.000 |
| 6 spectra, QESEAEK |
|
0.000 |
|
|
|
|
|
|
|
1.000 |
| | | Plot |
|
Lyso |
|
|
|
|
|
|
|
Other |
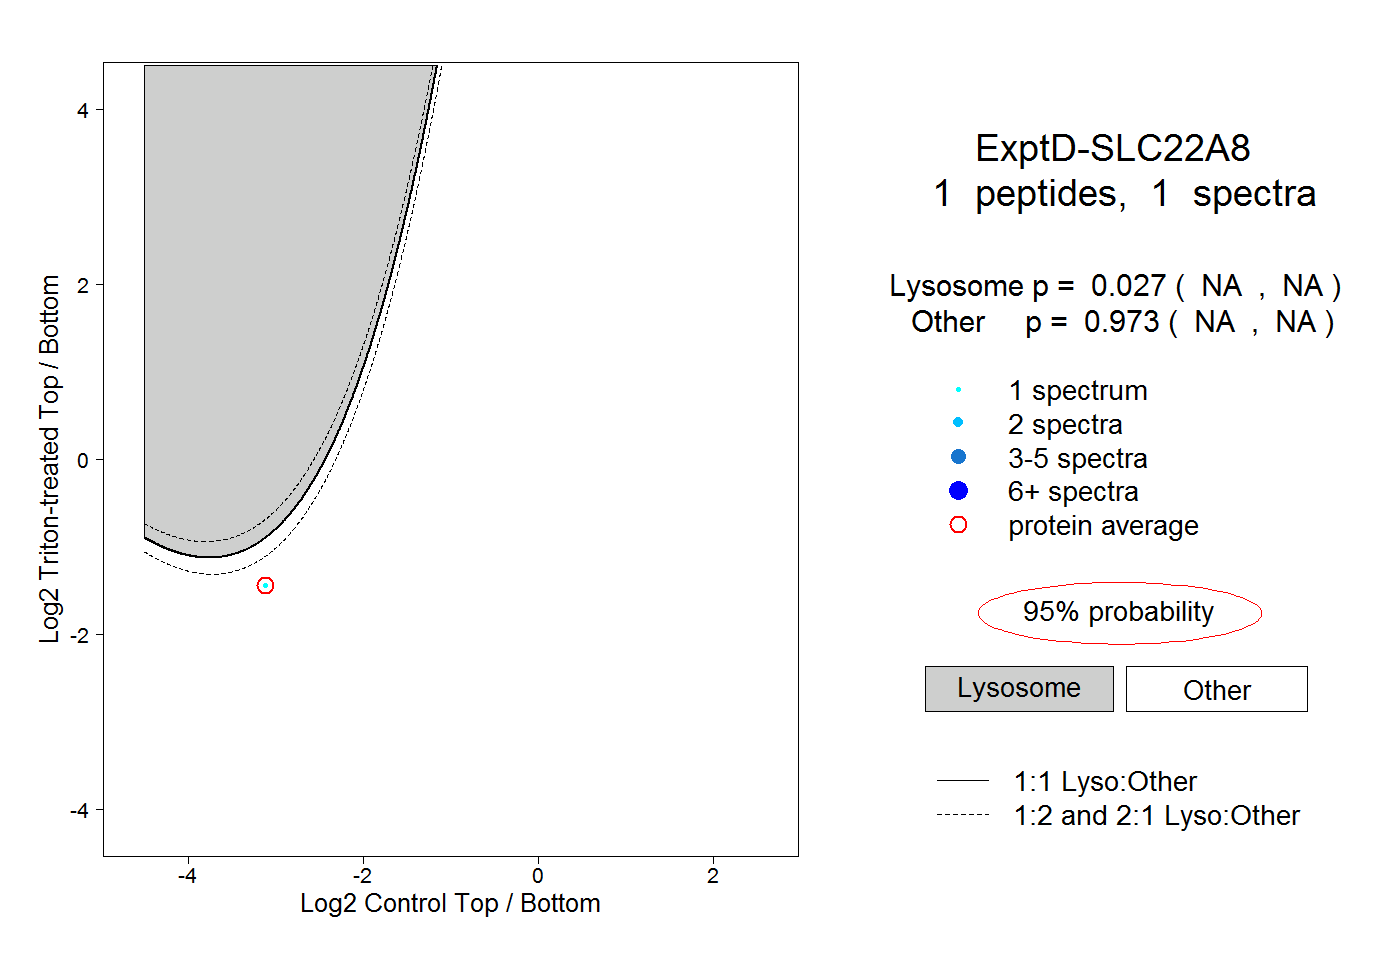
| Expt D |
1
peptide |
1
spectrum |
 |
|
0.027
NA | NA |
|
|
|
|
|
|
|
0.973
NA | NA |