 28
28peptides
spectra
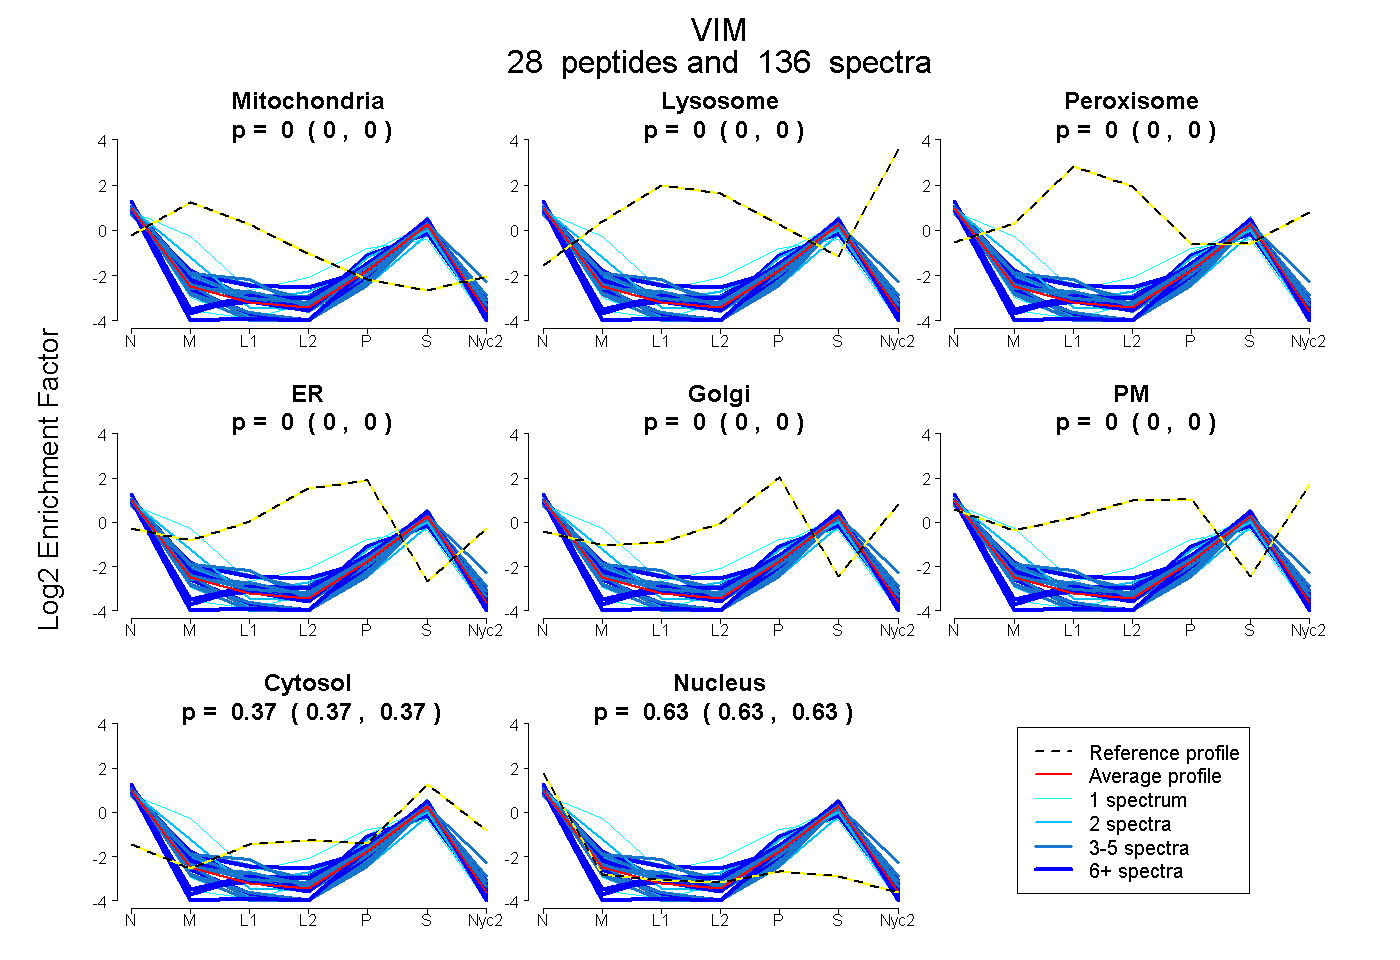
0.000 | 0.000
0.000 | 0.000
0.000 | 0.000
0.000 | 0.000
0.000 | 0.000
0.000 | 0.000
0.372 | 0.375
0.625 | 0.628
13peptides
spectra
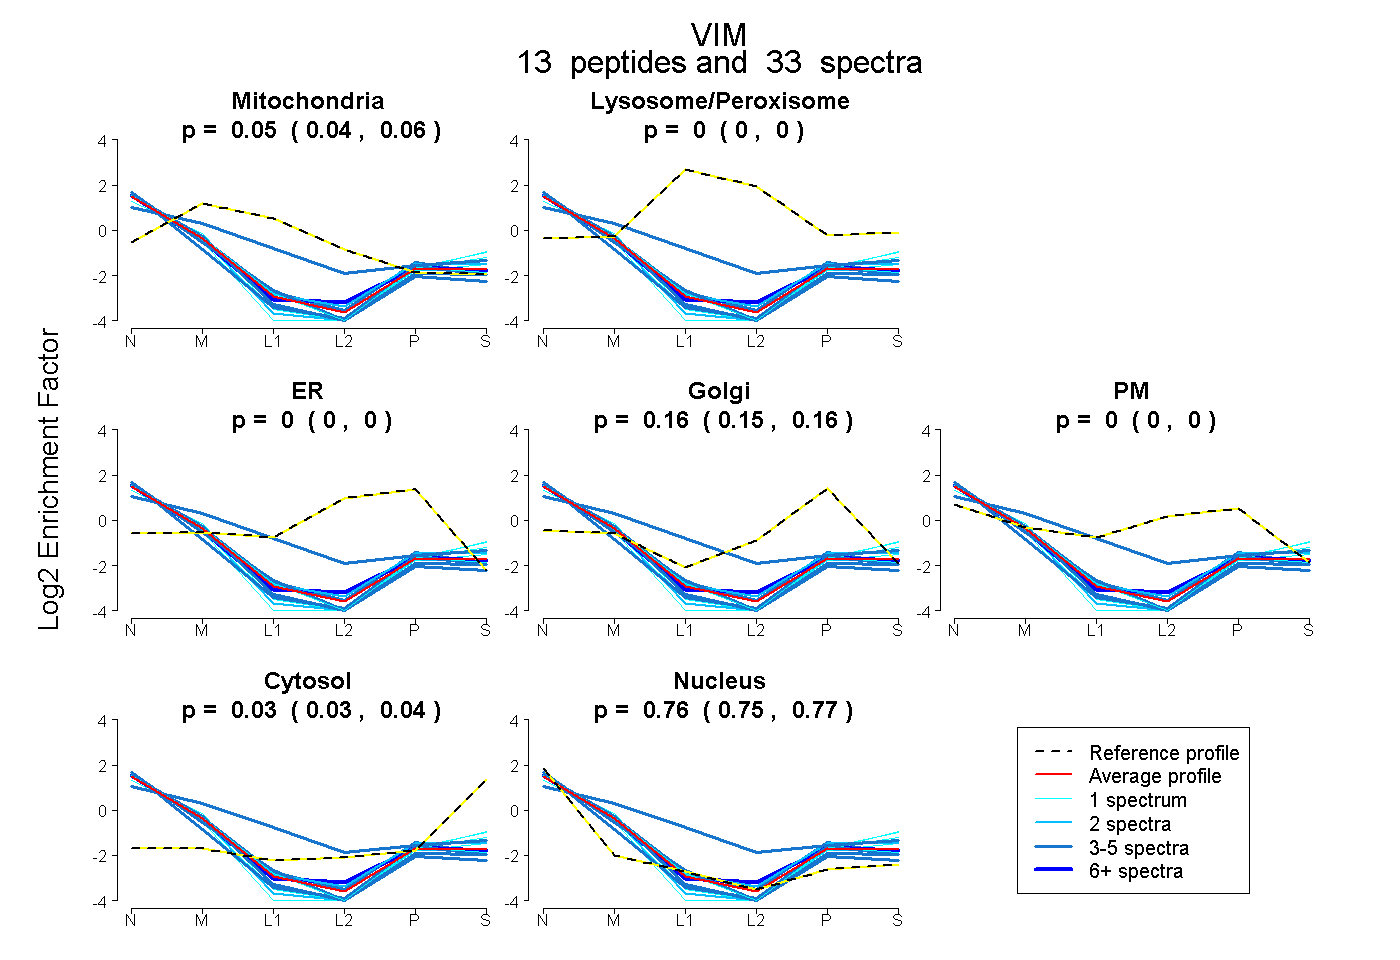
0.037 | 0.064
0.000 | 0.000
0.000 | 0.000
0.145 | 0.163
0.000 | 0.000
0.026 | 0.040
0.750 | 0.766
11peptides
spectra
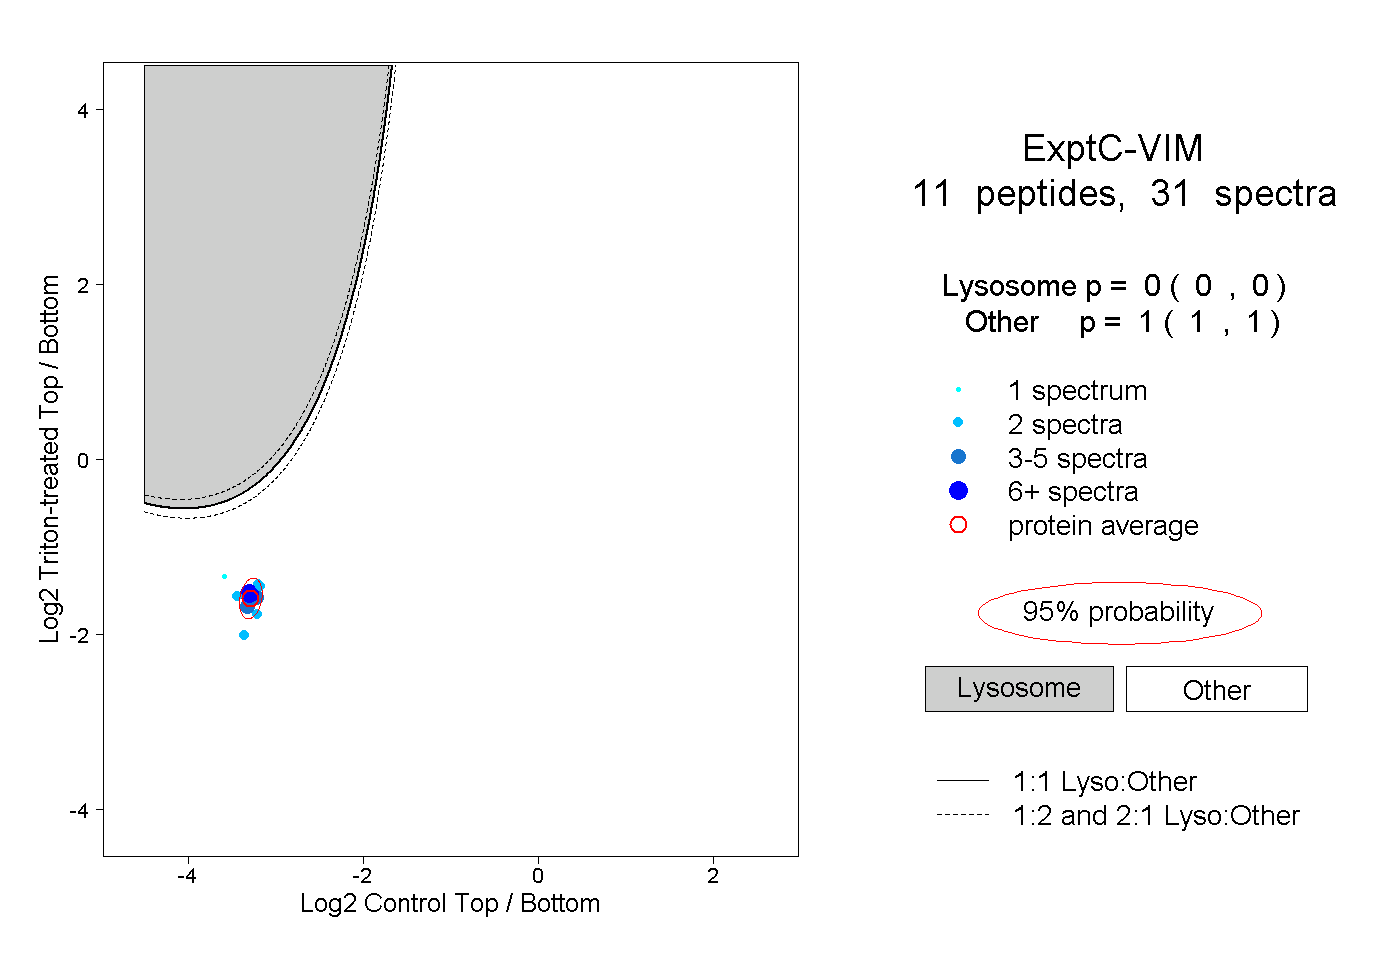
0.000 | 0.000
1.000 | 1.000
1peptide
spectrum
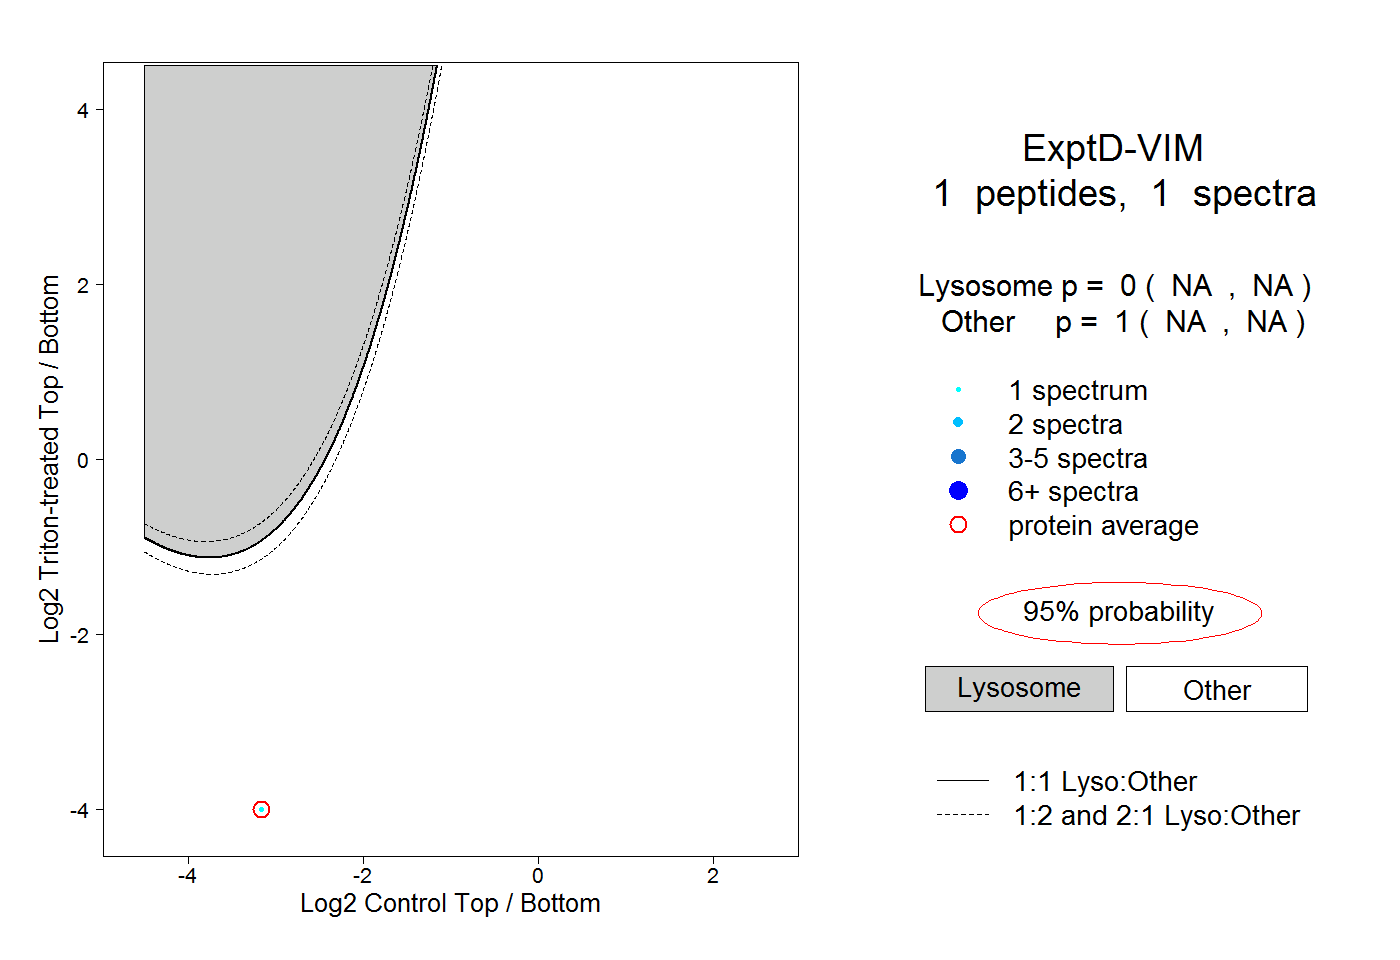
NA | NA
NA | NA