 28
28peptides
spectra
0.000 | 0.000
0.000 | 0.000
0.000 | 0.000
0.000 | 0.000
0.000 | 0.000
0.000 | 0.000
0.372 | 0.375
0.625 | 0.628
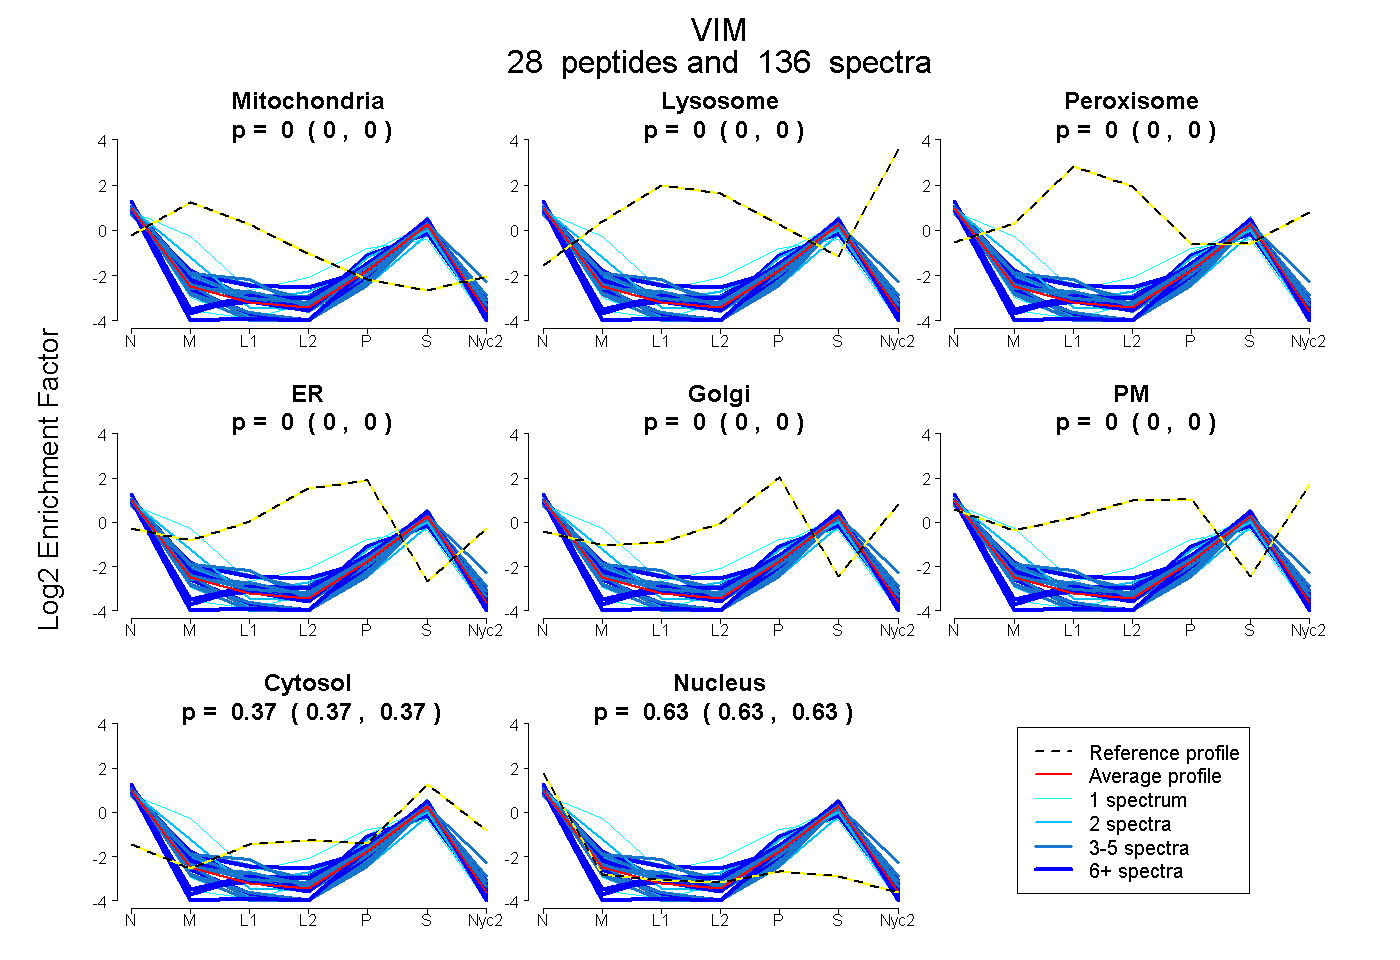
| Plot | Mito | Lyso | Perox | ER | Golgi | PM | Cytosol | Nucleus | |||||
| Expt A |
28 peptides |
136 spectra |
|
0.000 0.000 | 0.000 |
0.000 0.000 | 0.000 |
0.000 0.000 | 0.000 |
0.000 0.000 | 0.000 |
0.000 0.000 | 0.000 |
0.000 0.000 | 0.000 |
0.373 0.372 | 0.375 |
0.627 0.625 | 0.628 |
| 21 spectra, LGDLYEEEMR | 0.000 | 0.000 | 0.000 | 0.000 | 0.000 | 0.000 | 0.400 | 0.600 | ||
| 9 spectra, TYSLGSALRPSTSR | 0.000 | 0.000 | 0.000 | 0.000 | 0.000 | 0.000 | 0.393 | 0.607 | ||
| 1 spectrum, ETNLESLPLVDTHSK | 0.000 | 0.000 | 0.000 | 0.000 | 0.000 | 0.000 | 0.350 | 0.650 | ||
| 4 spectra, GTNESLER | 0.000 | 0.000 | 0.000 | 0.000 | 0.000 | 0.000 | 0.263 | 0.737 | ||
| 3 spectra, LQEEMLQR | 0.000 | 0.000 | 0.000 | 0.000 | 0.000 | 0.000 | 0.429 | 0.571 | ||
| 7 spectra, NLQEAEEWYK | 0.000 | 0.000 | 0.000 | 0.000 | 0.000 | 0.000 | 0.302 | 0.698 | ||
| 1 spectrum, DGQVINETSQHHDDLE | 0.000 | 0.000 | 0.000 | 0.000 | 0.000 | 0.000 | 0.302 | 0.698 | ||
| 1 spectrum, EMEENFALEAANYQDTIGR | 0.000 | 0.000 | 0.000 | 0.000 | 0.000 | 0.000 | 0.282 | 0.718 | ||
| 2 spectra, FANYIDK | 0.000 | 0.000 | 0.000 | 0.000 | 0.000 | 0.000 | 0.364 | 0.636 | ||
| 6 spectra, QDVDNASLAR | 0.000 | 0.000 | 0.000 | 0.000 | 0.000 | 0.000 | 0.426 | 0.574 | ||
| 4 spectra, QESNEYR | 0.000 | 0.000 | 0.000 | 0.000 | 0.000 | 0.000 | 0.289 | 0.711 | ||
| 3 spectra, ILLAELEQLK | 0.000 | 0.000 | 0.000 | 0.000 | 0.000 | 0.000 | 0.397 | 0.603 | ||
| 4 spectra, FADLSEAANR | 0.000 | 0.000 | 0.000 | 0.000 | 0.000 | 0.000 | 0.460 | 0.540 | ||
| 2 spectra, QVQSLTCEVDALK | 0.000 | 0.000 | 0.000 | 0.000 | 0.000 | 0.000 | 0.337 | 0.663 | ||
| 5 spectra, QQYESVAAK | 0.000 | 0.000 | 0.000 | 0.000 | 0.000 | 0.000 | 0.282 | 0.718 | ||
| 4 spectra, LQDEIQNMK | 0.000 | 0.000 | 0.000 | 0.000 | 0.000 | 0.000 | 0.319 | 0.681 | ||
| 8 spectra, MFGGSGTSSRPSSNR | 0.000 | 0.000 | 0.000 | 0.000 | 0.000 | 0.000 | 0.331 | 0.669 | ||
| 4 spectra, VELQELNDR | 0.000 | 0.000 | 0.000 | 0.000 | 0.000 | 0.000 | 0.418 | 0.582 | ||
| 3 spectra, VESLQEEIAFLK | 0.000 | 0.000 | 0.000 | 0.000 | 0.000 | 0.000 | 0.481 | 0.519 | ||
| 3 spectra, SLYSSSPGGAYVTR | 0.000 | 0.000 | 0.000 | 0.000 | 0.000 | 0.000 | 0.446 | 0.554 | ||
| 1 spectrum, NNDALR | 0.254 | 0.000 | 0.000 | 0.010 | 0.000 | 0.000 | 0.275 | 0.460 | ||
| 4 spectra, QVDQLTNDK | 0.000 | 0.000 | 0.000 | 0.000 | 0.000 | 0.000 | 0.382 | 0.618 | ||
| 2 spectra, EYQDLLNVK | 0.000 | 0.000 | 0.000 | 0.000 | 0.000 | 0.000 | 0.304 | 0.696 | ||
| 2 spectra, MALDIEIATYR | 0.000 | 0.000 | 0.000 | 0.000 | 0.000 | 0.000 | 0.341 | 0.659 | ||
| 8 spectra, SVSSSSYR | 0.000 | 0.000 | 0.000 | 0.000 | 0.000 | 0.000 | 0.312 | 0.688 | ||
| 7 spectra, EEAESTLQSFR | 0.000 | 0.000 | 0.000 | 0.000 | 0.000 | 0.000 | 0.453 | 0.547 | ||
| 7 spectra, SYVTTSTR | 0.000 | 0.000 | 0.000 | 0.000 | 0.000 | 0.000 | 0.409 | 0.591 | ||
| 10 spectra, DNLAEDIMR | 0.000 | 0.000 | 0.000 | 0.000 | 0.000 | 0.000 | 0.434 | 0.566 |
| Plot | Mito | Lyso or Perox | ER | Golgi | PM | Cytosol | Nucleus | ||||||
| Expt B |
13 peptides |
33 spectra |
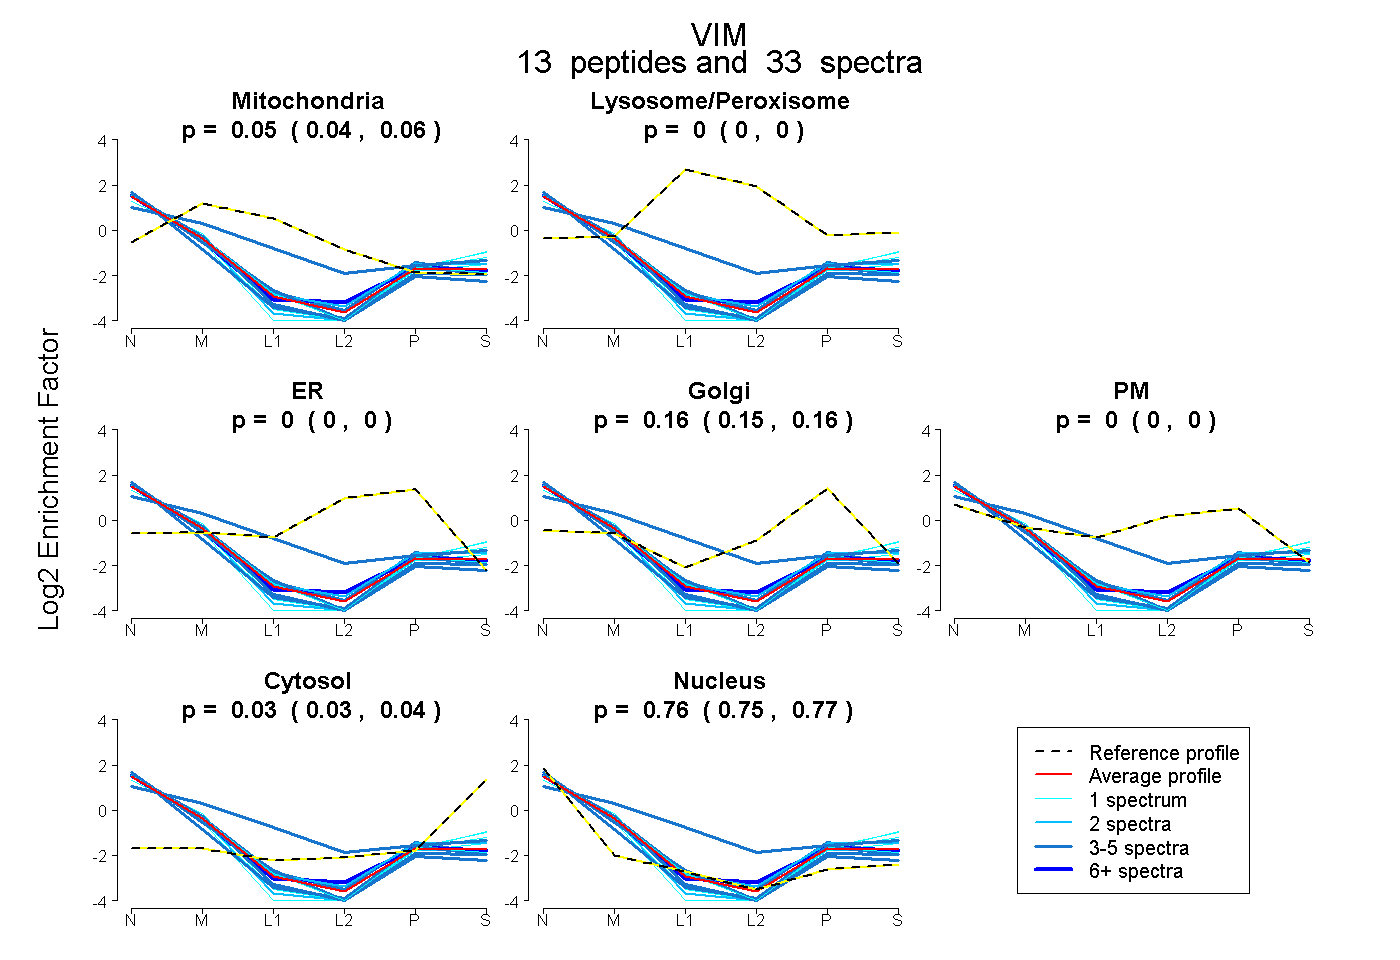 |
0.052 0.037 | 0.064 |
0.000 0.000 | 0.000 |
0.000 0.000 | 0.000 |
0.155 0.145 | 0.163 |
0.000 0.000 | 0.000 |
0.034 0.026 | 0.040 |
0.759 0.750 | 0.766 |
|||
| Plot | Lyso | Other | |||||||||||
| Expt C |
11 peptides |
31 spectra |
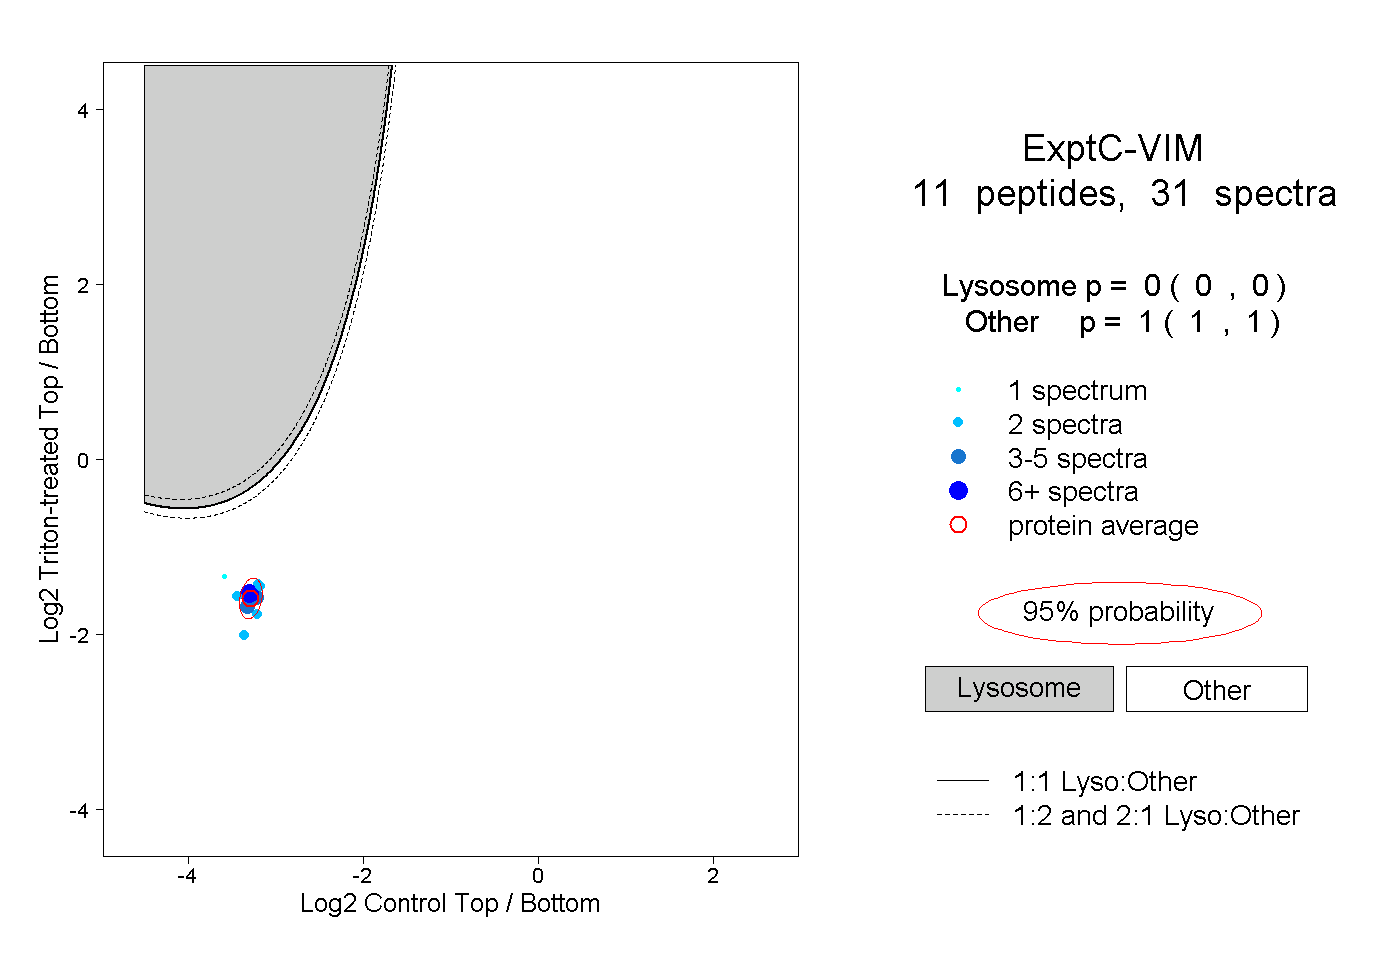 |
0.000 0.000 | 0.000 |
1.000 1.000 | 1.000 |
||||||||
| Plot | Lyso | Other | |||||||||||
| Expt D |
1 peptide |
1 spectrum |
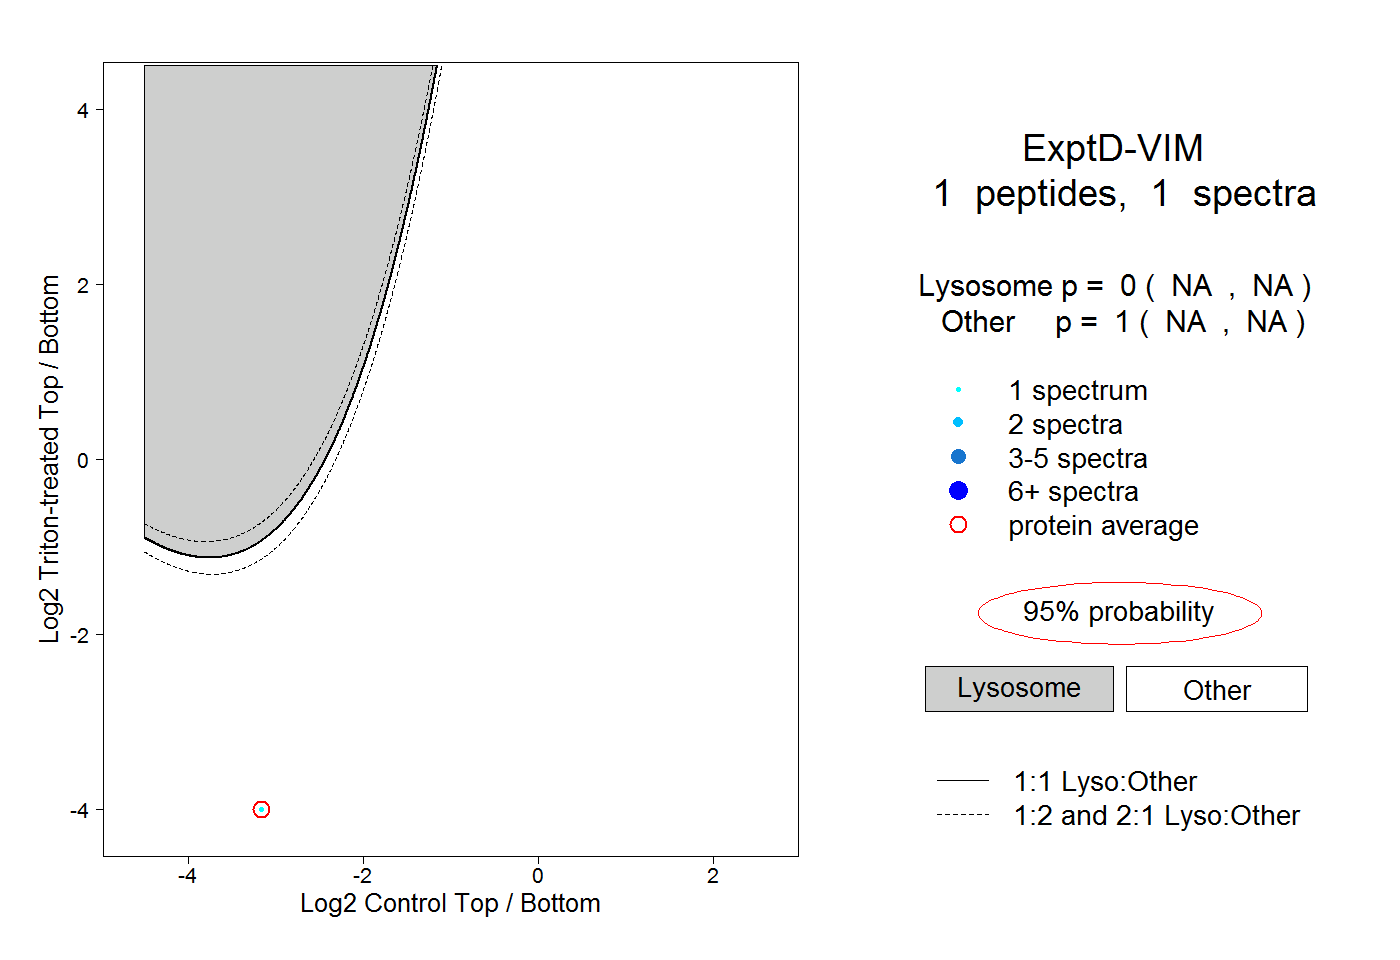 |
0.000 NA | NA |
1.000 NA | NA |