 32
32peptides
spectra
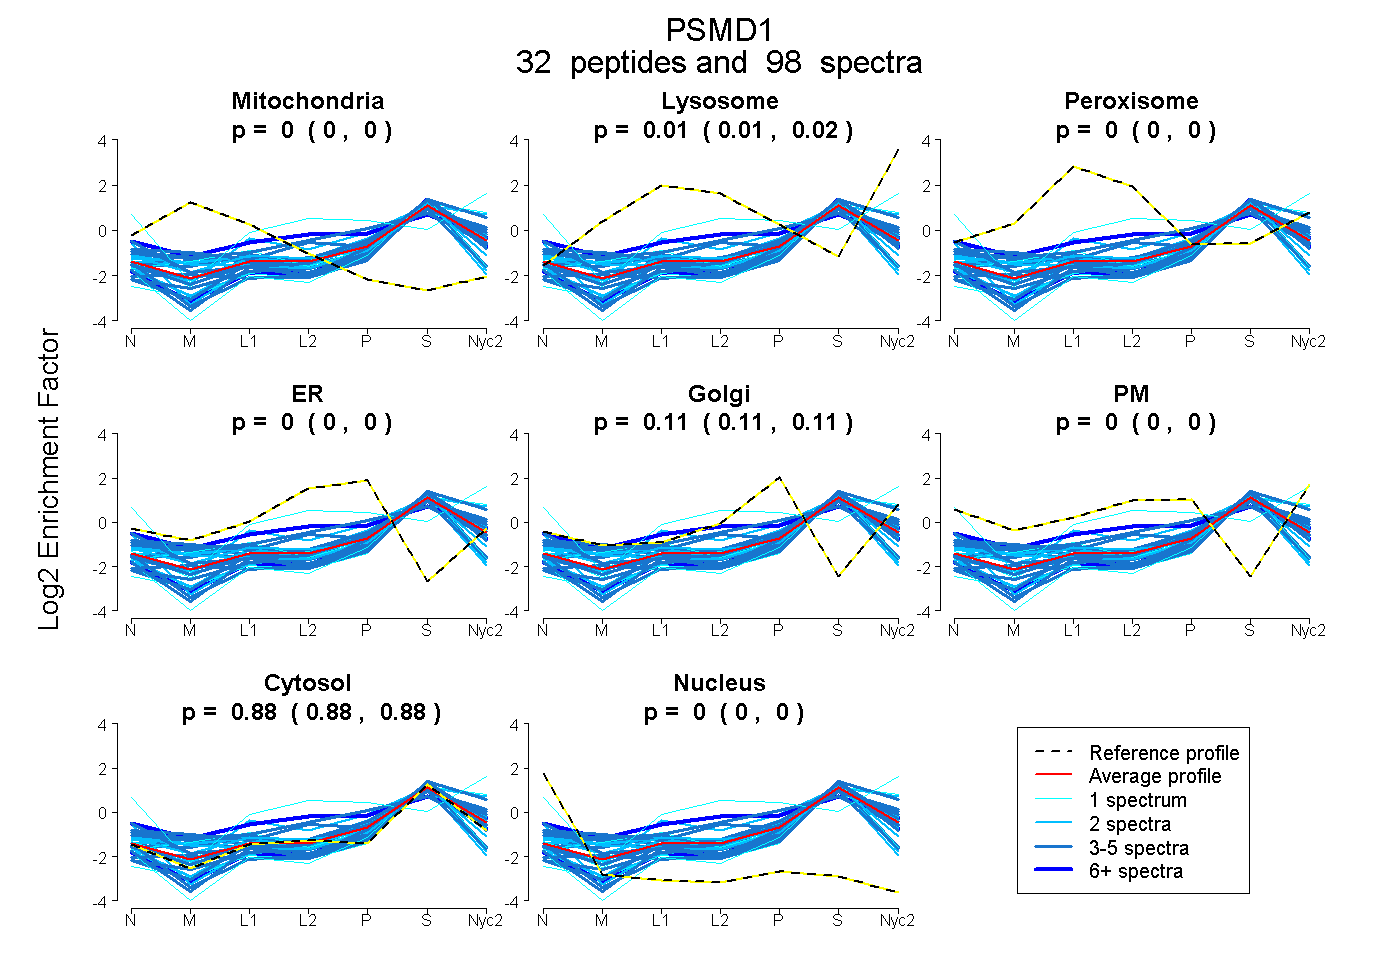
0.000 | 0.000
0.008 | 0.015
0.000 | 0.000
0.000 | 0.000
0.106 | 0.113
0.000 | 0.000
0.875 | 0.880
0.000 | 0.000
10peptides
spectra
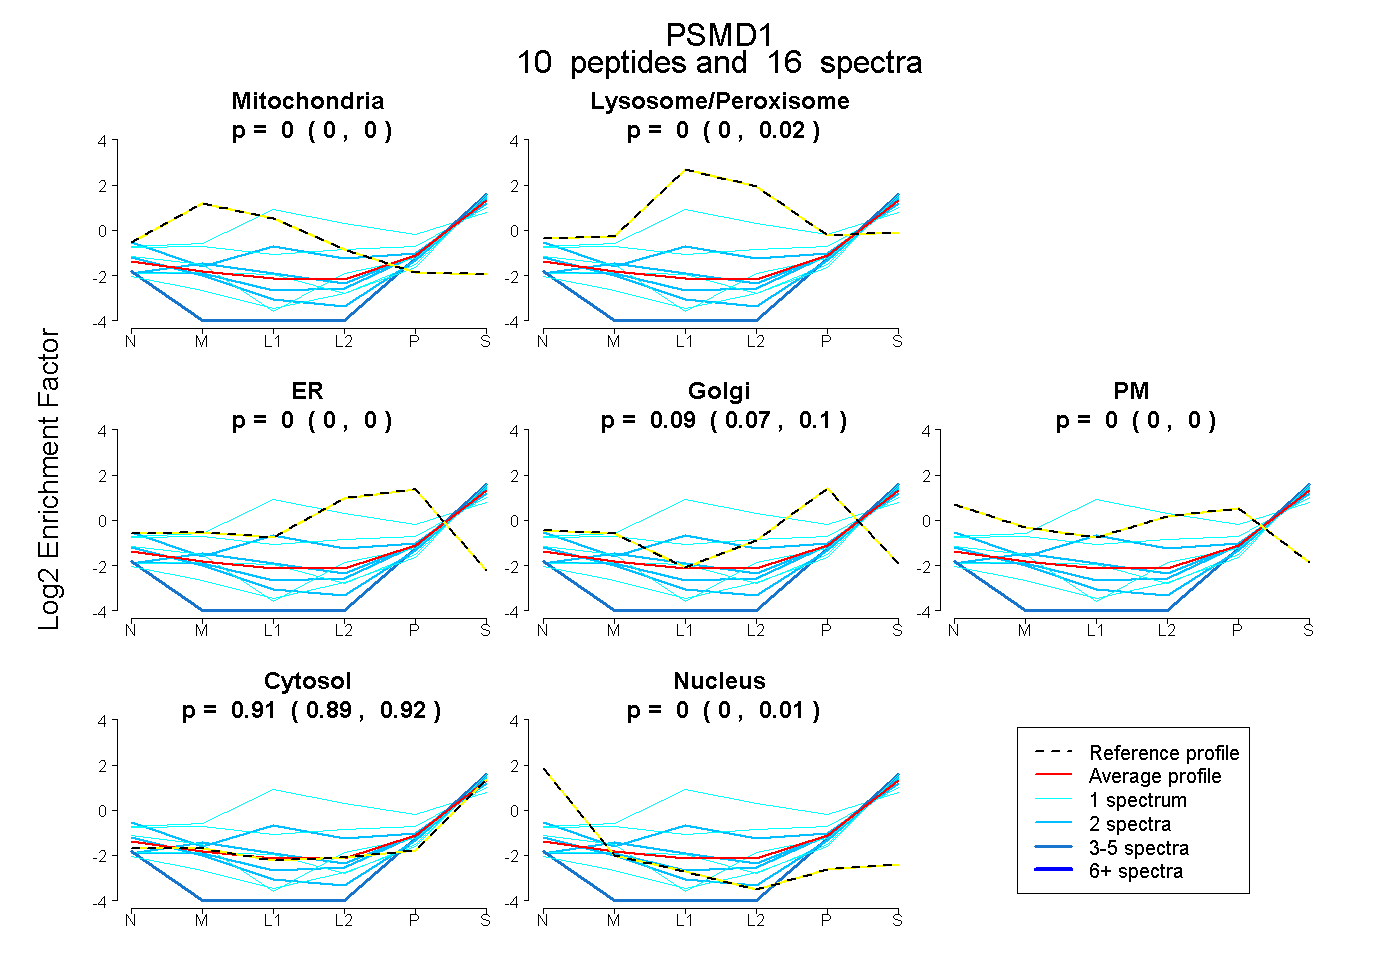
0.000 | 0.000
0.000 | 0.020
0.000 | 0.000
0.072 | 0.104
0.000 | 0.000
0.886 | 0.918
0.000 | 0.006
18peptides
spectra
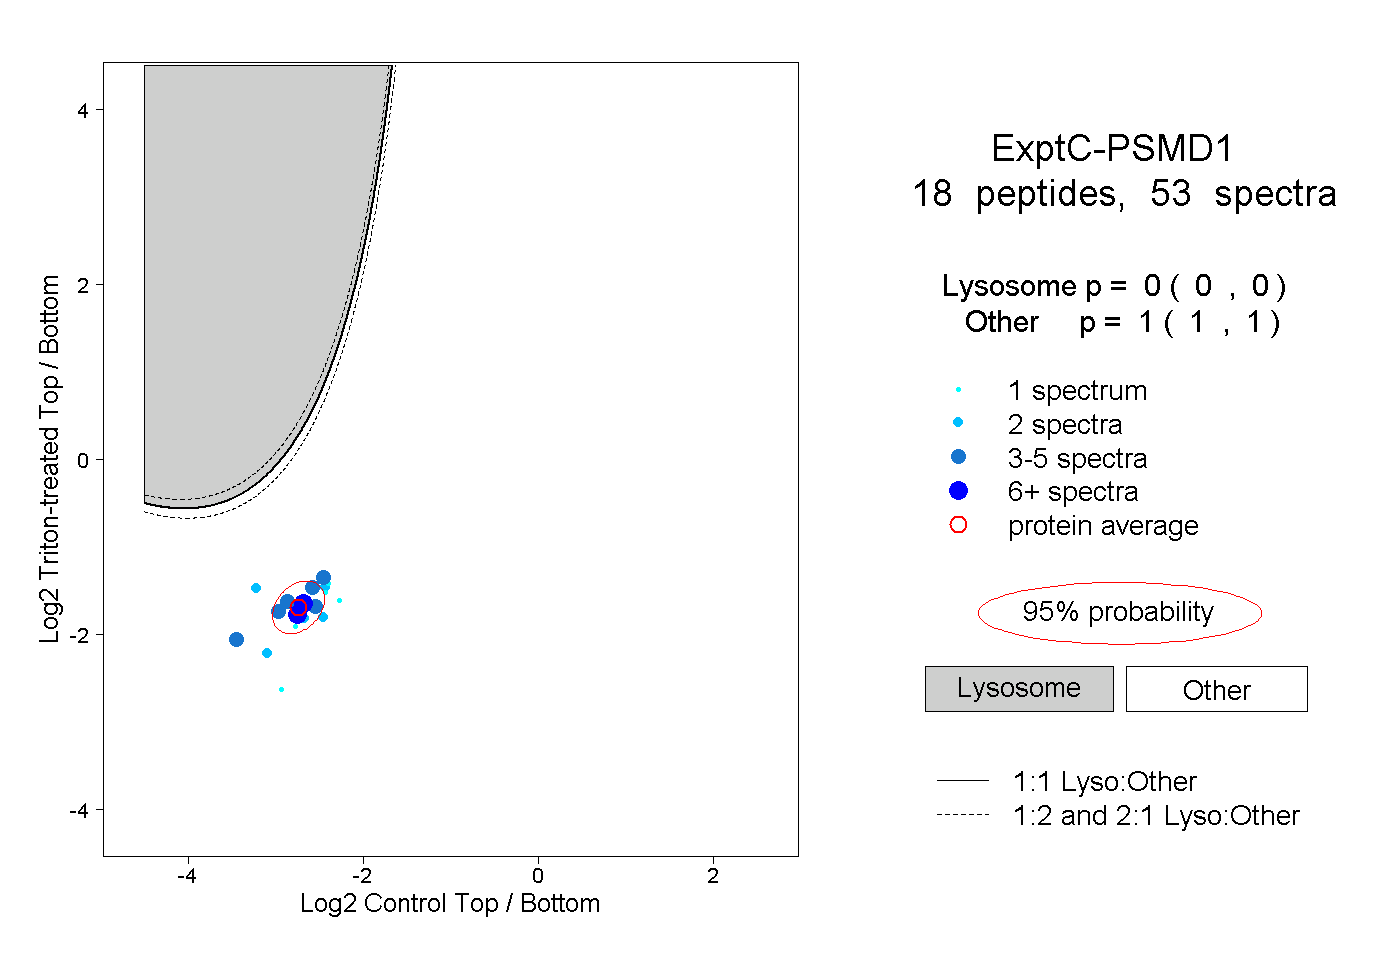
0.000 | 0.000
1.000 | 1.000
6peptides
spectra
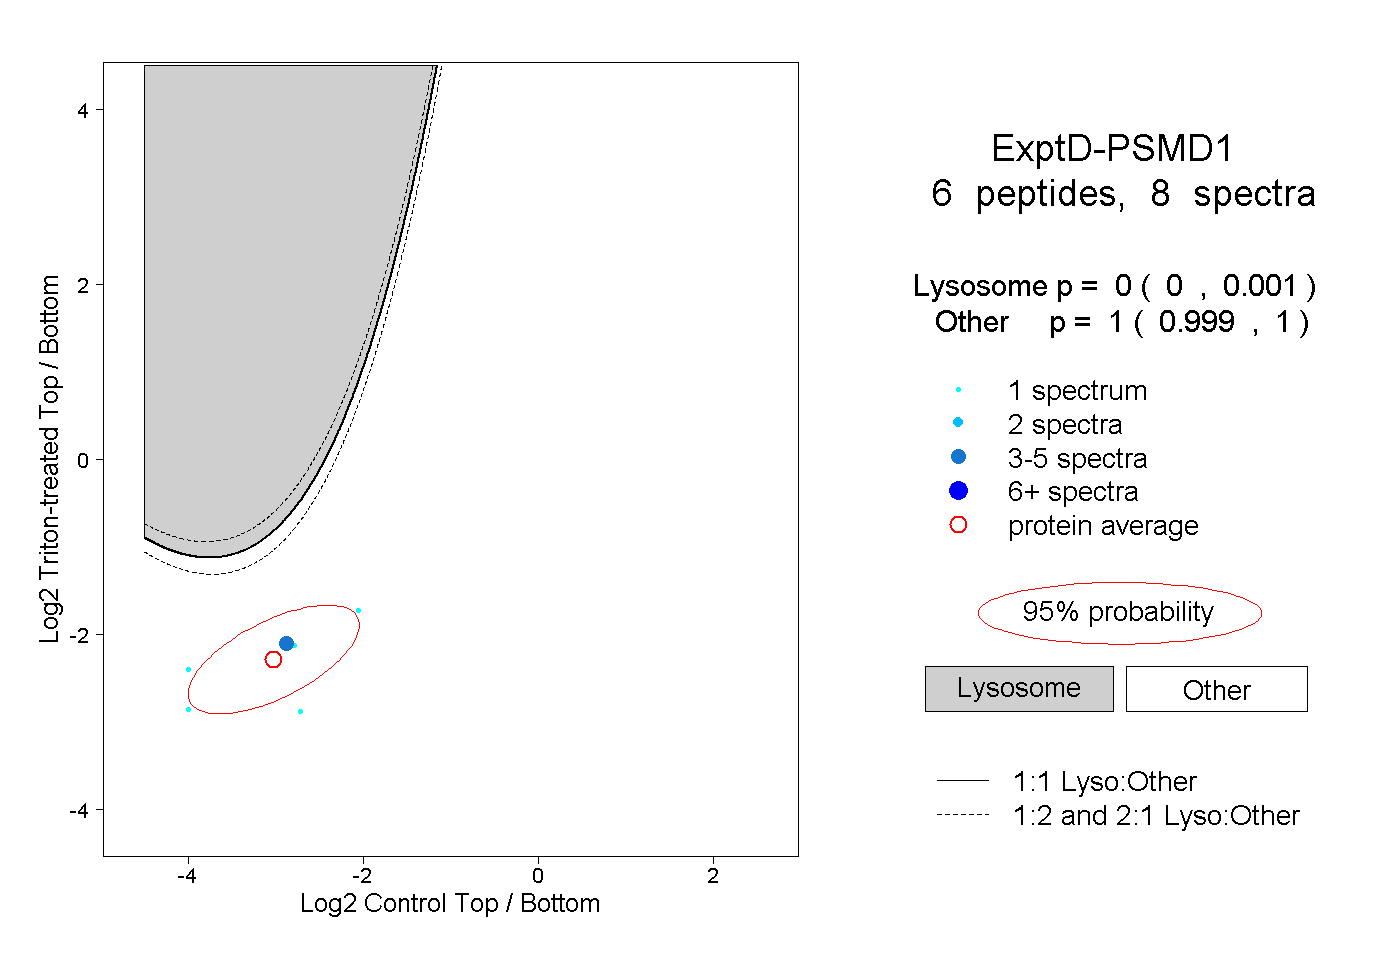
0.000 | 0.001
0.999 | 1.000