 11
11peptides
spectra
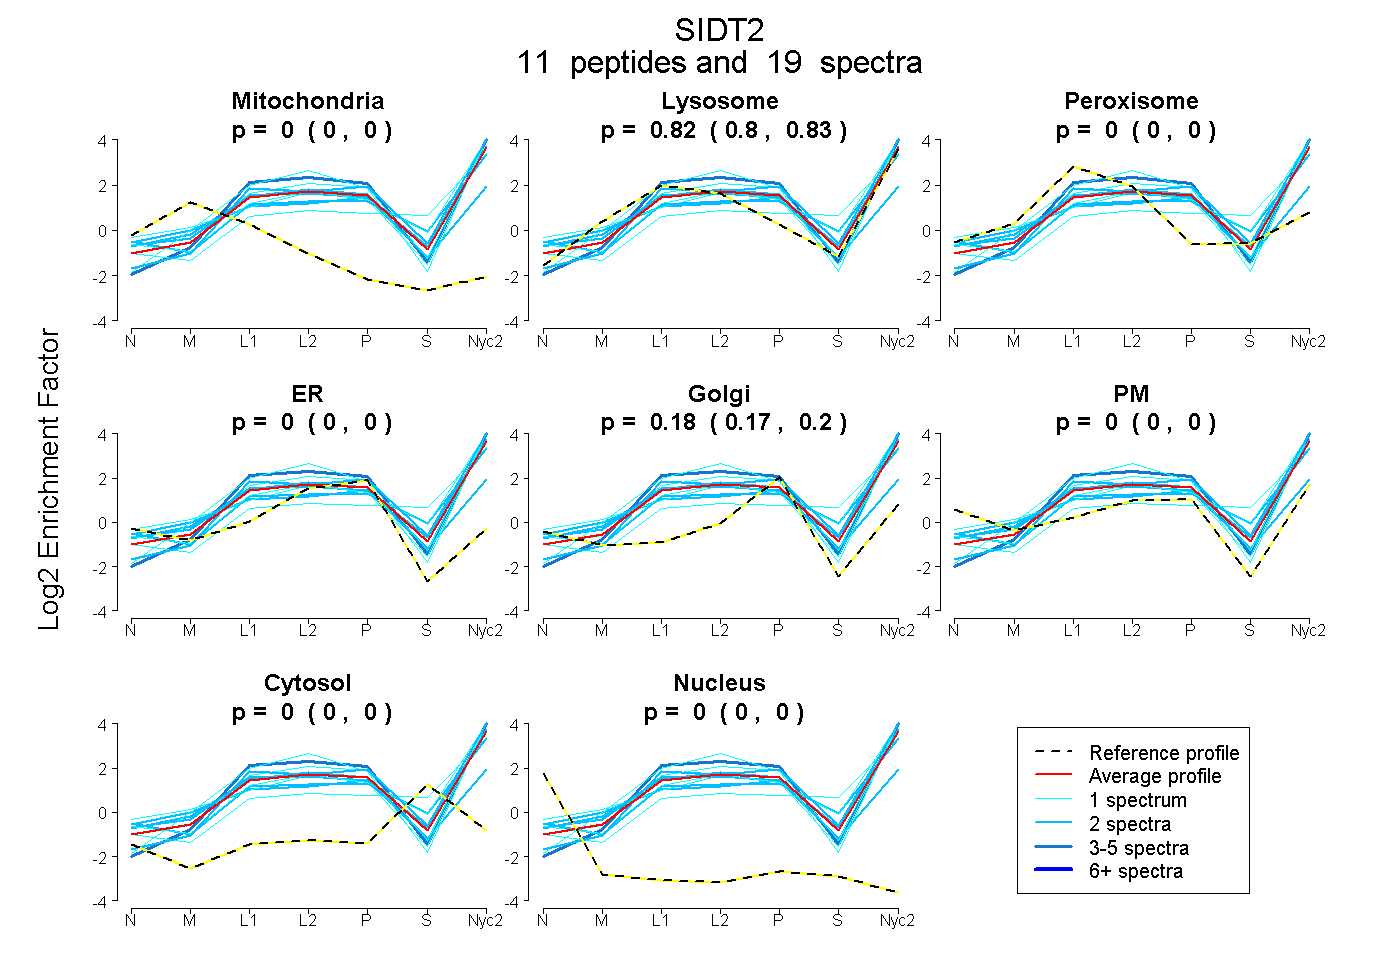
0.000 | 0.000
0.801 | 0.827
0.000 | 0.000
0.000 | 0.000
0.170 | 0.196
0.000 | 0.000
0.000 | 0.000
0.000 | 0.000
5peptides
spectra

0.000 | 0.000
0.532 | 0.644
0.255 | 0.436
0.000 | 0.073
0.000 | 0.000
0.000 | 0.057
0.000 | 0.000
13peptides
spectra
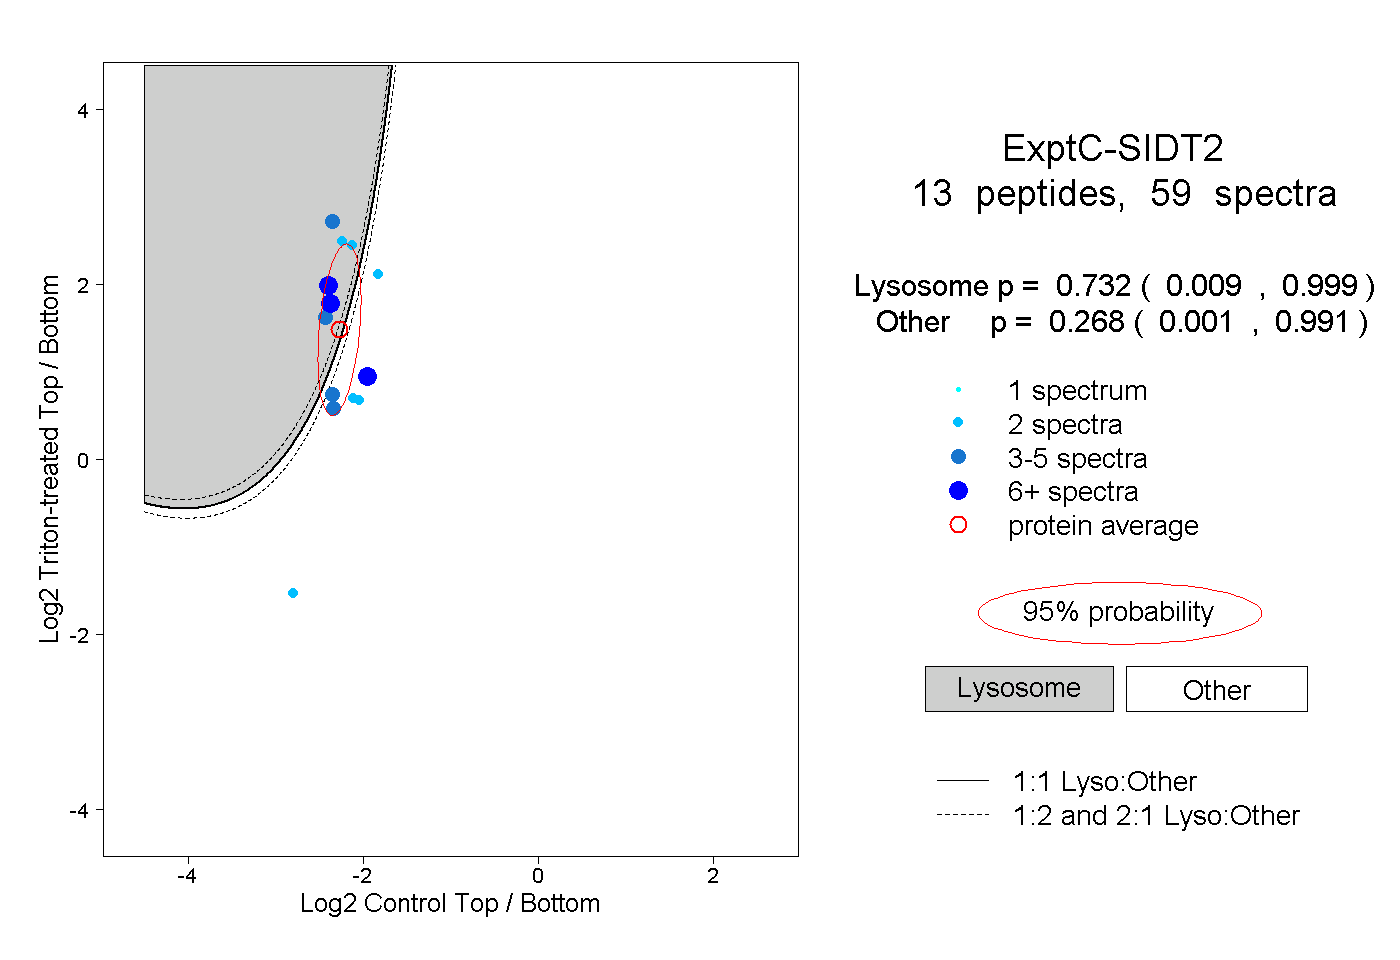
0.009 | 0.999
0.001 | 0.991
3peptides
spectra
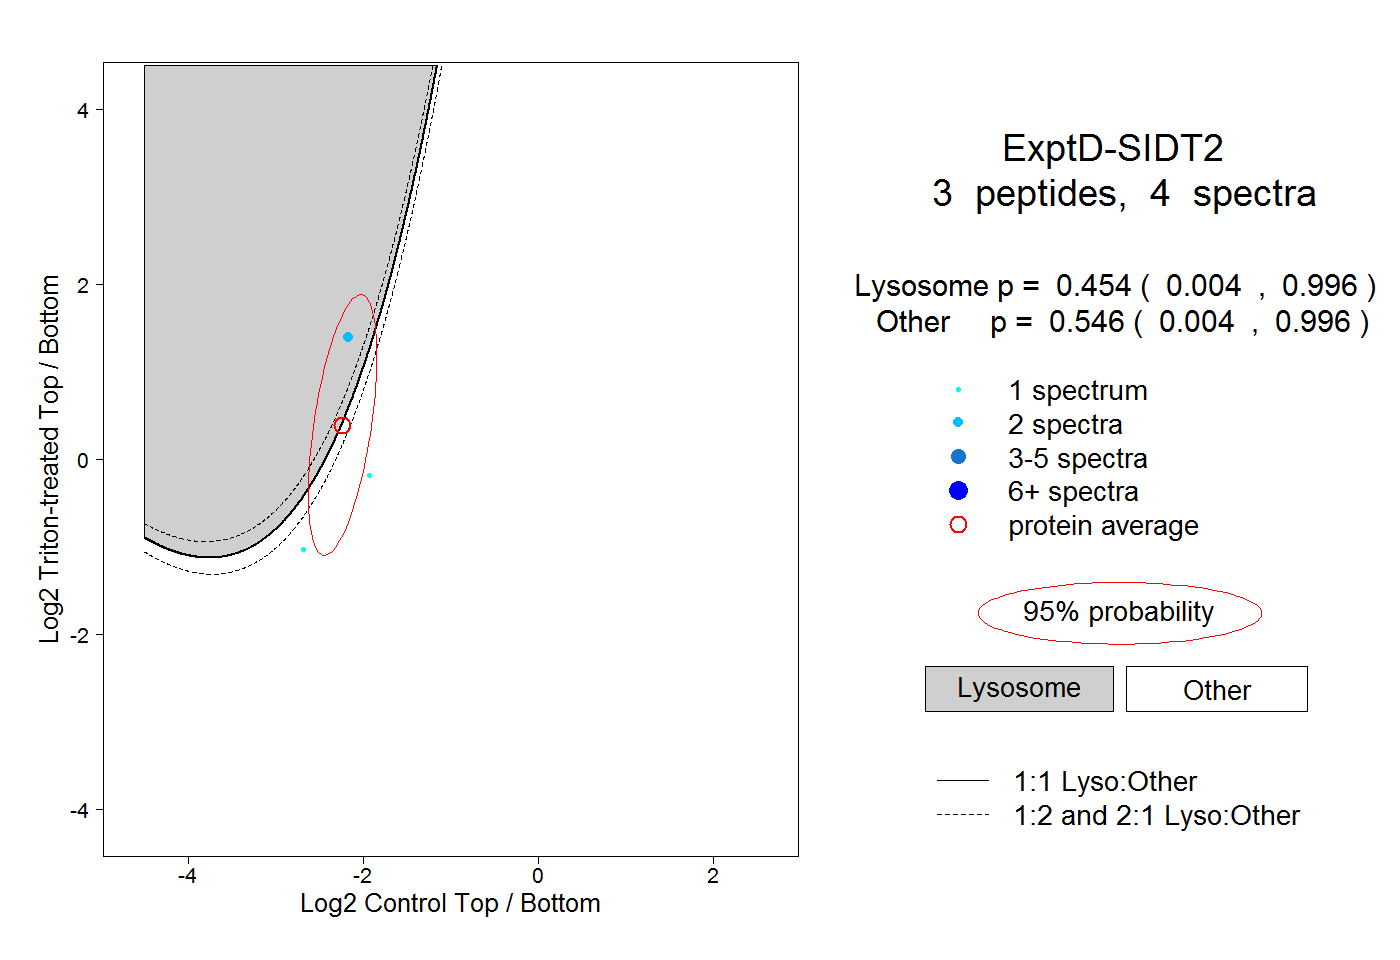
0.004 | 0.996
0.004 | 0.996