SIDT2
[ENSRNOP00000024239]
Main page
| | | Plot |
Mito |
Lyso |
|
Perox |
ER |
Golgi |
PM |
Cytosol |
Nucleus |
|
| Expt A |
 11
11
peptides |
19
spectra |
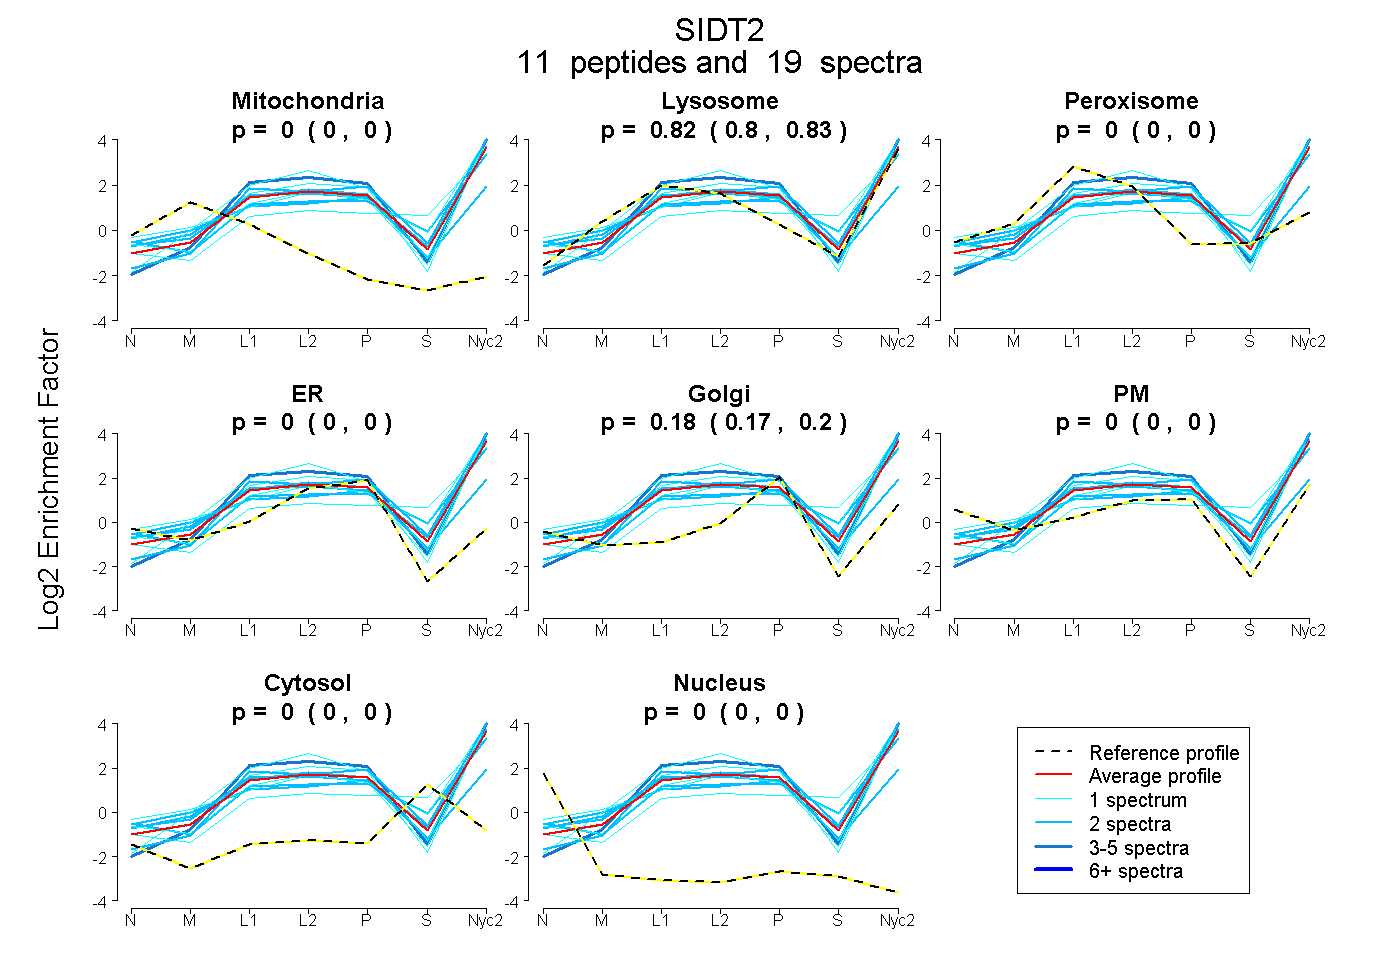 |
0.000
0.000 | 0.000 |
0.816
0.801 | 0.827 |
|
0.000
0.000 | 0.000 |
0.000
0.000 | 0.000 |
0.184
0.170 | 0.196 |
0.000
0.000 | 0.000 |
0.000
0.000 | 0.000 |
0.000
0.000 | 0.000 |
|
| | | Plot |
Mito |
|
Lyso or Perox |
|
ER |
Golgi |
PM |
Cytosol |
Nucleus |
|
| Expt B |
5
peptides |
7
spectra |
 |
0.000
0.000 | 0.000 |
|
0.588
0.532 | 0.644 |
|
0.385
0.255 | 0.436 |
0.000
0.000 | 0.073 |
0.000
0.000 | 0.000 |
0.027
0.000 | 0.057 |
0.000
0.000 | 0.000 |
|
| | | Plot |
|
Lyso |
|
|
|
|
|
|
|
Other |
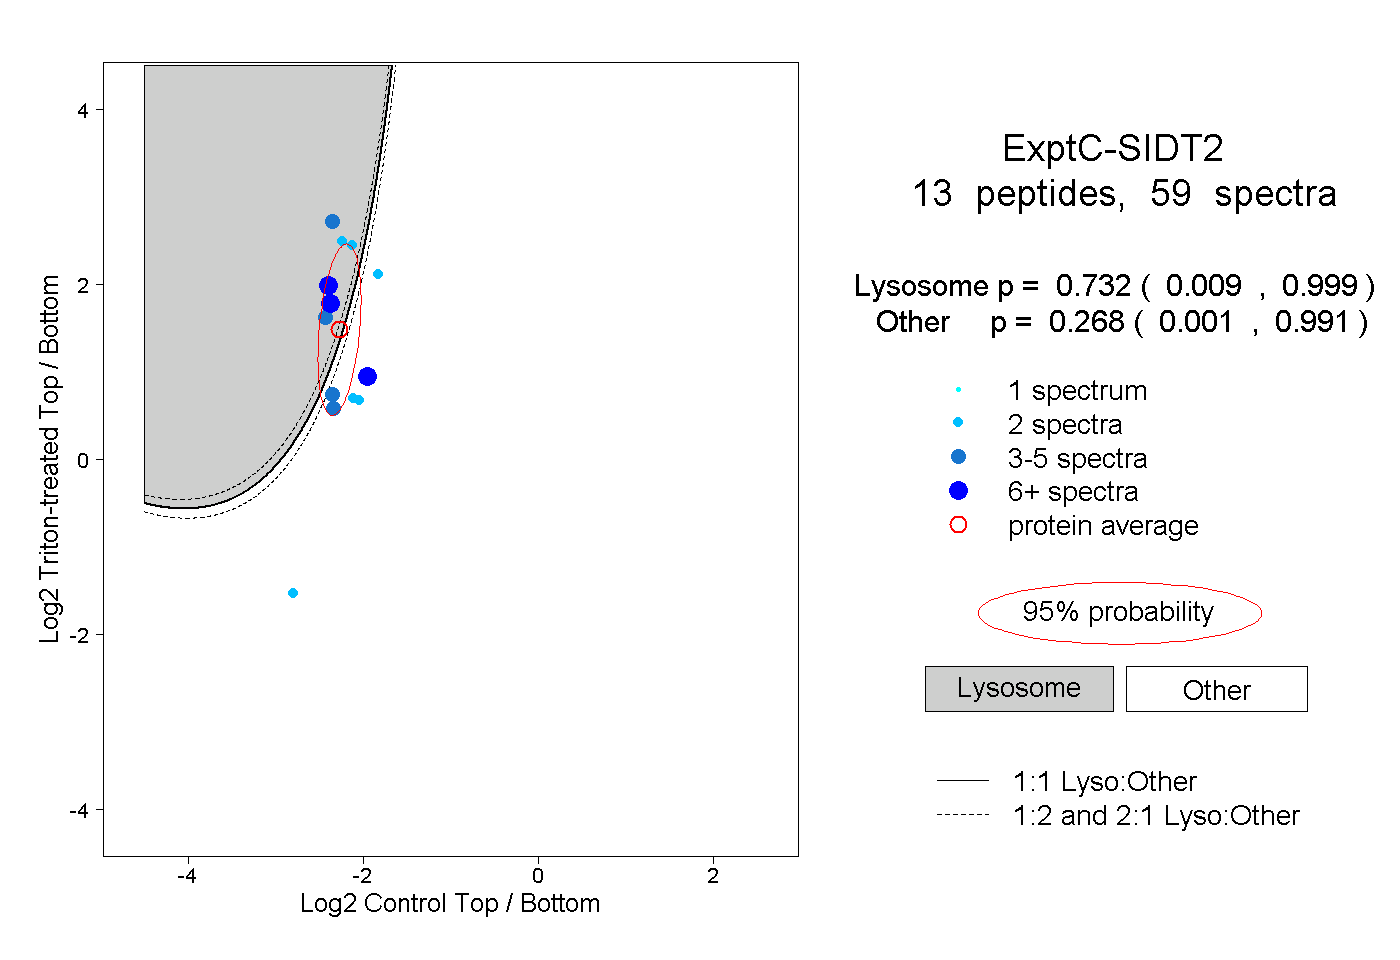
| Expt C |
13
peptides |
59
spectra |
 |
|
0.732
0.009 | 0.999 |
|
|
|
|
|
|
|
0.268
0.001 | 0.991 |
| 6 spectra, VDNFVLR |
|
0.995 |
|
|
|
|
|
|
|
0.005 |
| 2 spectra, EAVVSFQVPLILR |
|
0.976 |
|
|
|
|
|
|
|
0.024 |
| 2 spectra, VLVPVR |
|
0.000 |
|
|
|
|
|
|
|
1.000 |
| 10 spectra, QCSGPLYTDR |
|
0.000 |
|
|
|
|
|
|
|
1.000 |
| 4 spectra, VSVNVLNK |
|
0.074 |
|
|
|
|
|
|
|
0.926 |
| 2 spectra, LDSGIFR |
|
0.003 |
|
|
|
|
|
|
|
0.997 |
| 4 spectra, DAEFER |
|
1.000 |
|
|
|
|
|
|
|
0.000 |
| 2 spectra, YEFPDGVDSVIVK |
|
0.999 |
|
|
|
|
|
|
|
0.001 |
| 15 spectra, GAPLLFVVR |
|
0.999 |
|
|
|
|
|
|
|
0.001 |
| 2 spectra, EINHNR |
|
0.000 |
|
|
|
|
|
|
|
1.000 |
| 5 spectra, AAITVQR |
|
0.995 |
|
|
|
|
|
|
|
0.005 |
| 3 spectra, SFDPVGARPR |
|
0.021 |
|
|
|
|
|
|
|
0.979 |
| 2 spectra, QYLCVADLAR |
|
0.000 |
|
|
|
|
|
|
|
1.000 |
| | | Plot |
|
Lyso |
|
|
|
|
|
|
|
Other |
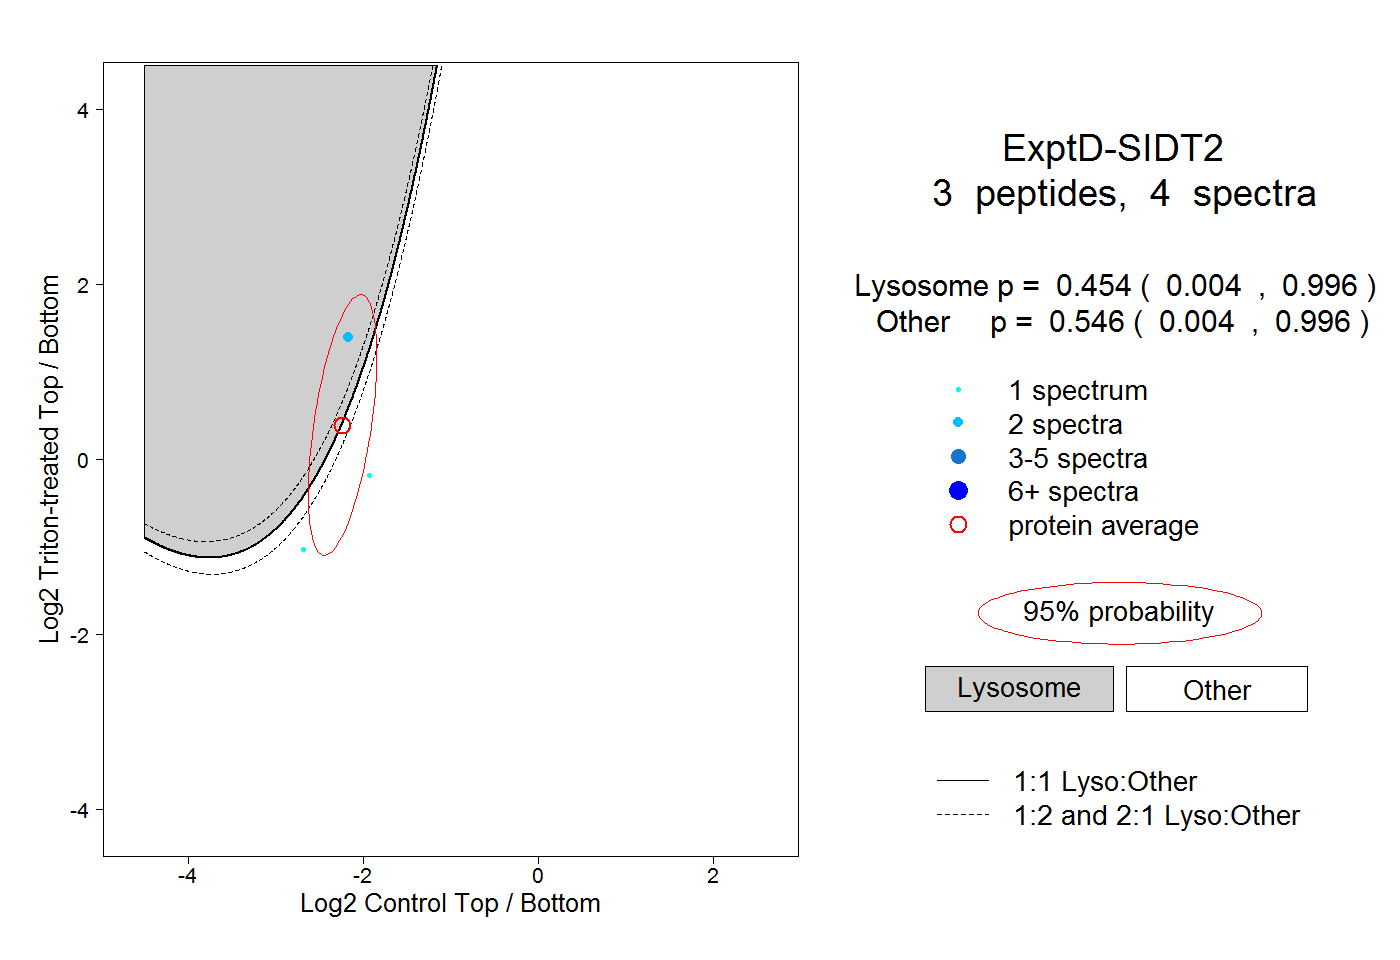
| Expt D |
3
peptides |
4
spectra |
 |
|
0.454
0.004 | 0.996 |
|
|
|
|
|
|
|
0.546
0.004 | 0.996 |