 11
11peptides
spectra
0.000 | 0.000
0.801 | 0.827
0.000 | 0.000
0.000 | 0.000
0.170 | 0.196
0.000 | 0.000
0.000 | 0.000
0.000 | 0.000
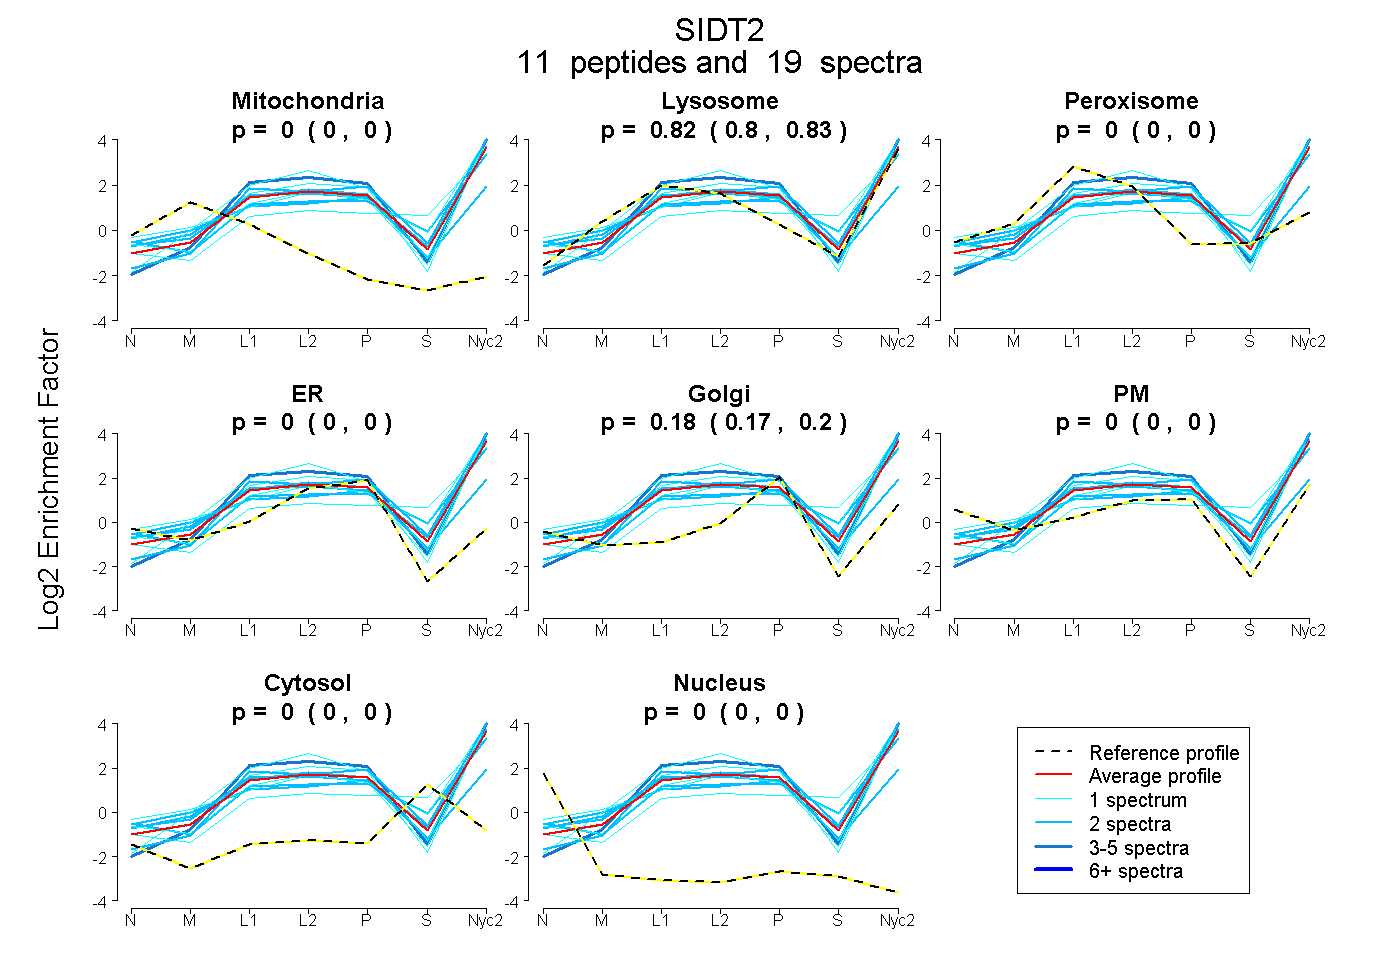
| Plot | Mito | Lyso | Perox | ER | Golgi | PM | Cytosol | Nucleus | |||||
| Expt A |
11 peptides |
19 spectra |
|
0.000 0.000 | 0.000 |
0.816 0.801 | 0.827 |
0.000 0.000 | 0.000 |
0.000 0.000 | 0.000 |
0.184 0.170 | 0.196 |
0.000 0.000 | 0.000 |
0.000 0.000 | 0.000 |
0.000 0.000 | 0.000 |
| 1 spectrum, VDNFVLR | 0.000 | 0.928 | 0.000 | 0.072 | 0.000 | 0.000 | 0.000 | 0.000 | ||
| 1 spectrum, NDLYALECGIPK | 0.000 | 0.832 | 0.000 | 0.000 | 0.119 | 0.049 | 0.000 | 0.000 | ||
| 1 spectrum, VSVNVLNK | 0.000 | 0.818 | 0.000 | 0.000 | 0.103 | 0.041 | 0.037 | 0.000 | ||
| 1 spectrum, LDSGIFR | 0.000 | 0.653 | 0.000 | 0.000 | 0.000 | 0.347 | 0.000 | 0.000 | ||
| 2 spectra, YEFPDGVDSVIVK | 0.000 | 0.884 | 0.000 | 0.000 | 0.116 | 0.000 | 0.000 | 0.000 | ||
| 4 spectra, GAPLLFVVR | 0.000 | 0.916 | 0.000 | 0.084 | 0.000 | 0.000 | 0.000 | 0.000 | ||
| 1 spectrum, TPAESR | 0.000 | 0.711 | 0.000 | 0.000 | 0.002 | 0.000 | 0.288 | 0.000 | ||
| 2 spectra, AAITVQR | 0.000 | 0.766 | 0.000 | 0.000 | 0.003 | 0.231 | 0.000 | 0.000 | ||
| 2 spectra, SFDPVGARPR | 0.000 | 0.699 | 0.000 | 0.000 | 0.102 | 0.091 | 0.108 | 0.000 | ||
| 2 spectra, ILHVLYTDCIR | 0.000 | 0.414 | 0.135 | 0.094 | 0.286 | 0.071 | 0.000 | 0.000 | ||
| 2 spectra, QYLCVADLAR | 0.000 | 0.799 | 0.000 | 0.000 | 0.080 | 0.122 | 0.000 | 0.000 |
| Plot | Mito | Lyso or Perox | ER | Golgi | PM | Cytosol | Nucleus | ||||||
| Expt B |
5 peptides |
7 spectra |
 |
0.000 0.000 | 0.000 |
0.588 0.532 | 0.644 |
0.385 0.255 | 0.436 |
0.000 0.000 | 0.073 |
0.000 0.000 | 0.000 |
0.027 0.000 | 0.057 |
0.000 0.000 | 0.000 |
|||
| Plot | Lyso | Other | |||||||||||
| Expt C |
13 peptides |
59 spectra |
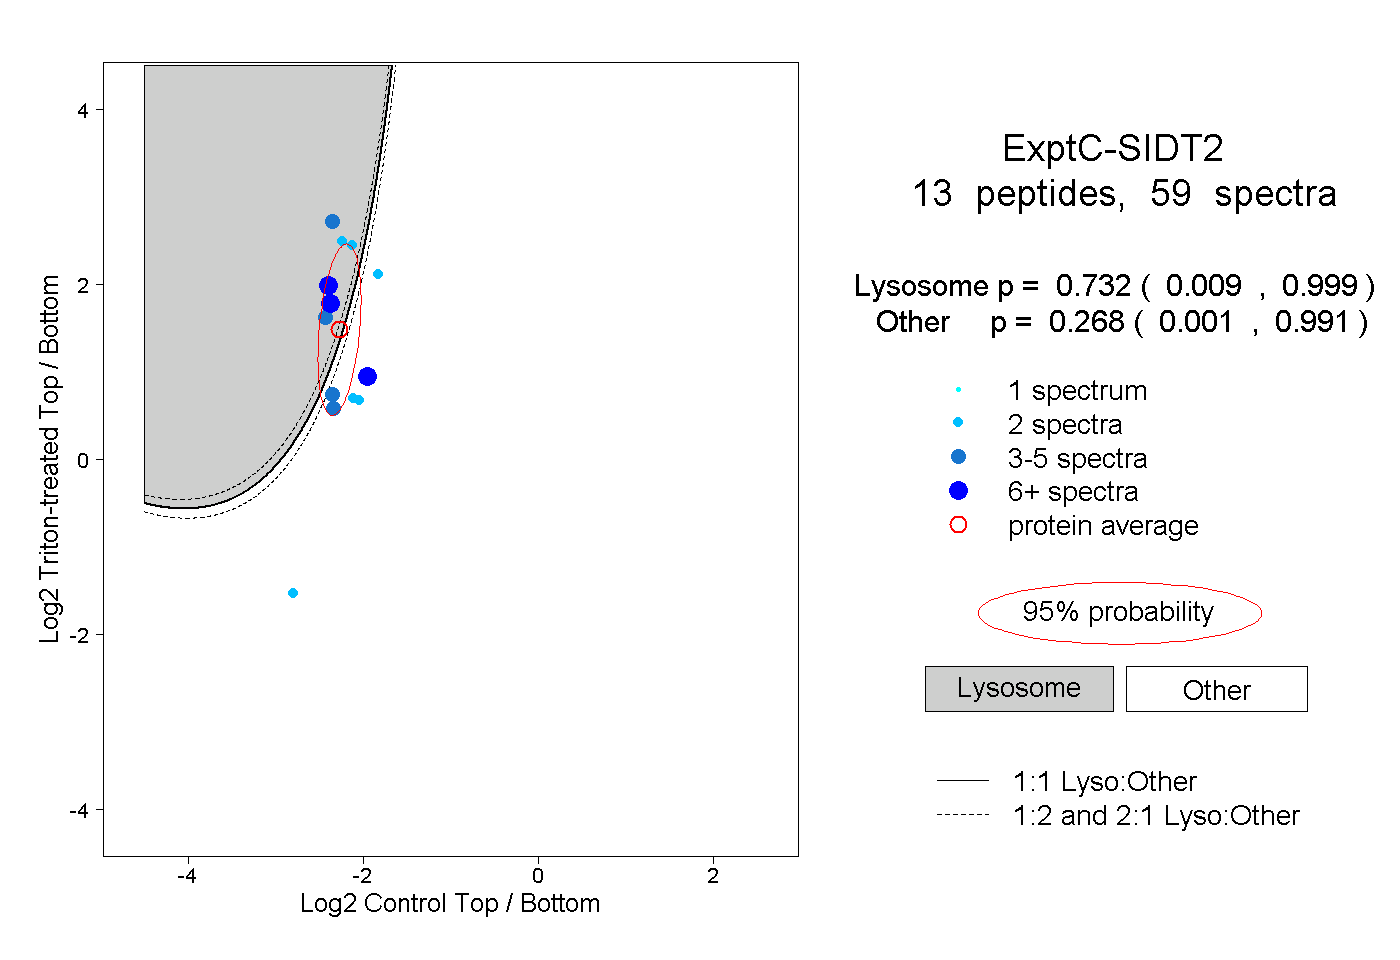 |
0.732 0.009 | 0.999 |
0.268 0.001 | 0.991 |
||||||||
| Plot | Lyso | Other | |||||||||||
| Expt D |
3 peptides |
4 spectra |
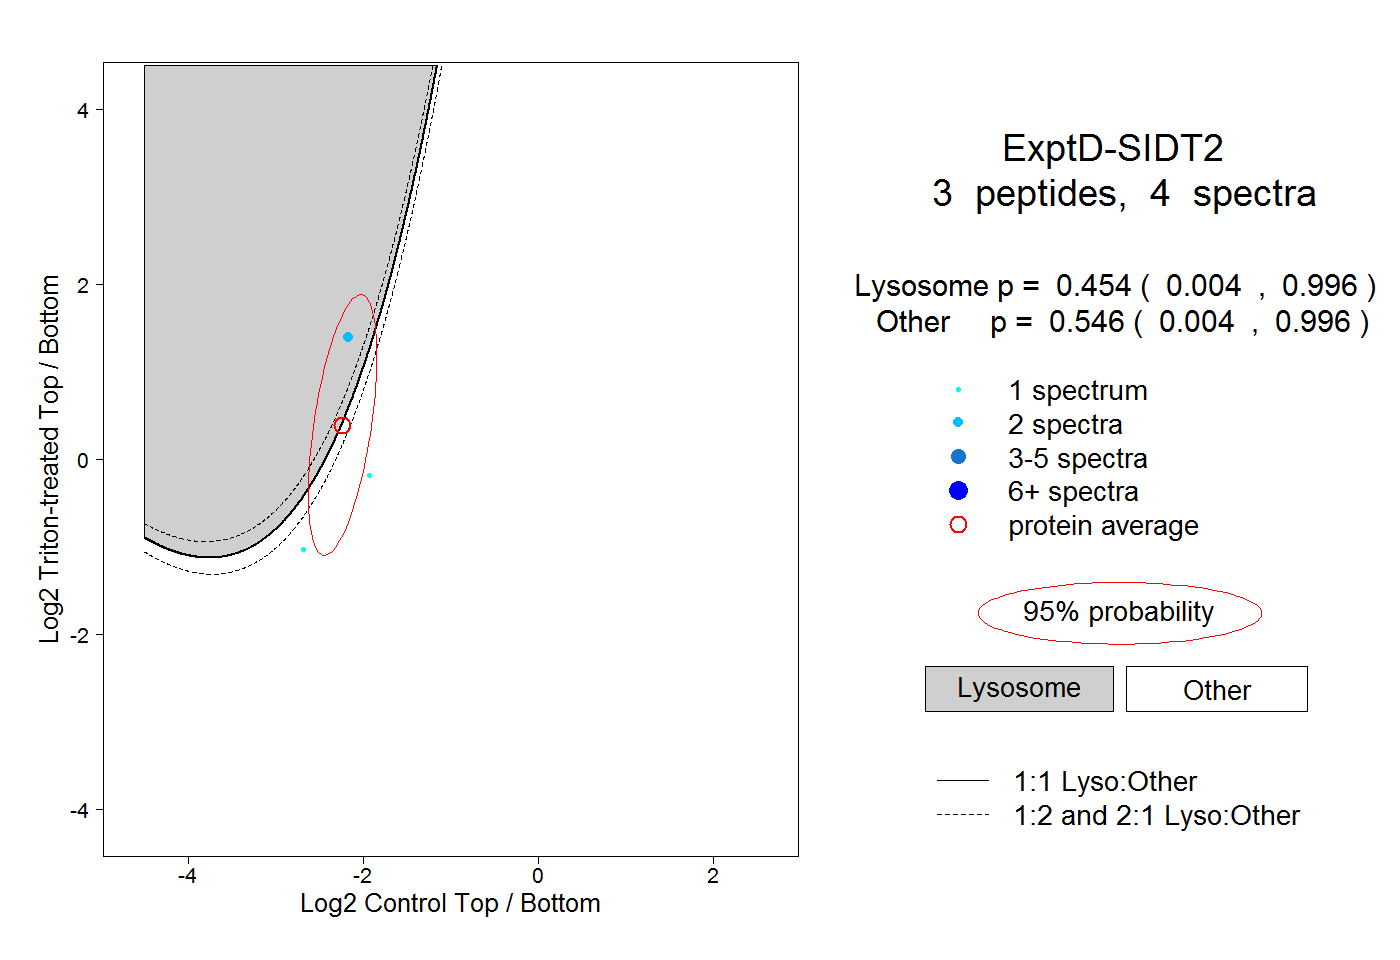 |
0.454 0.004 | 0.996 |
0.546 0.004 | 0.996 |