 10
10peptides
spectra
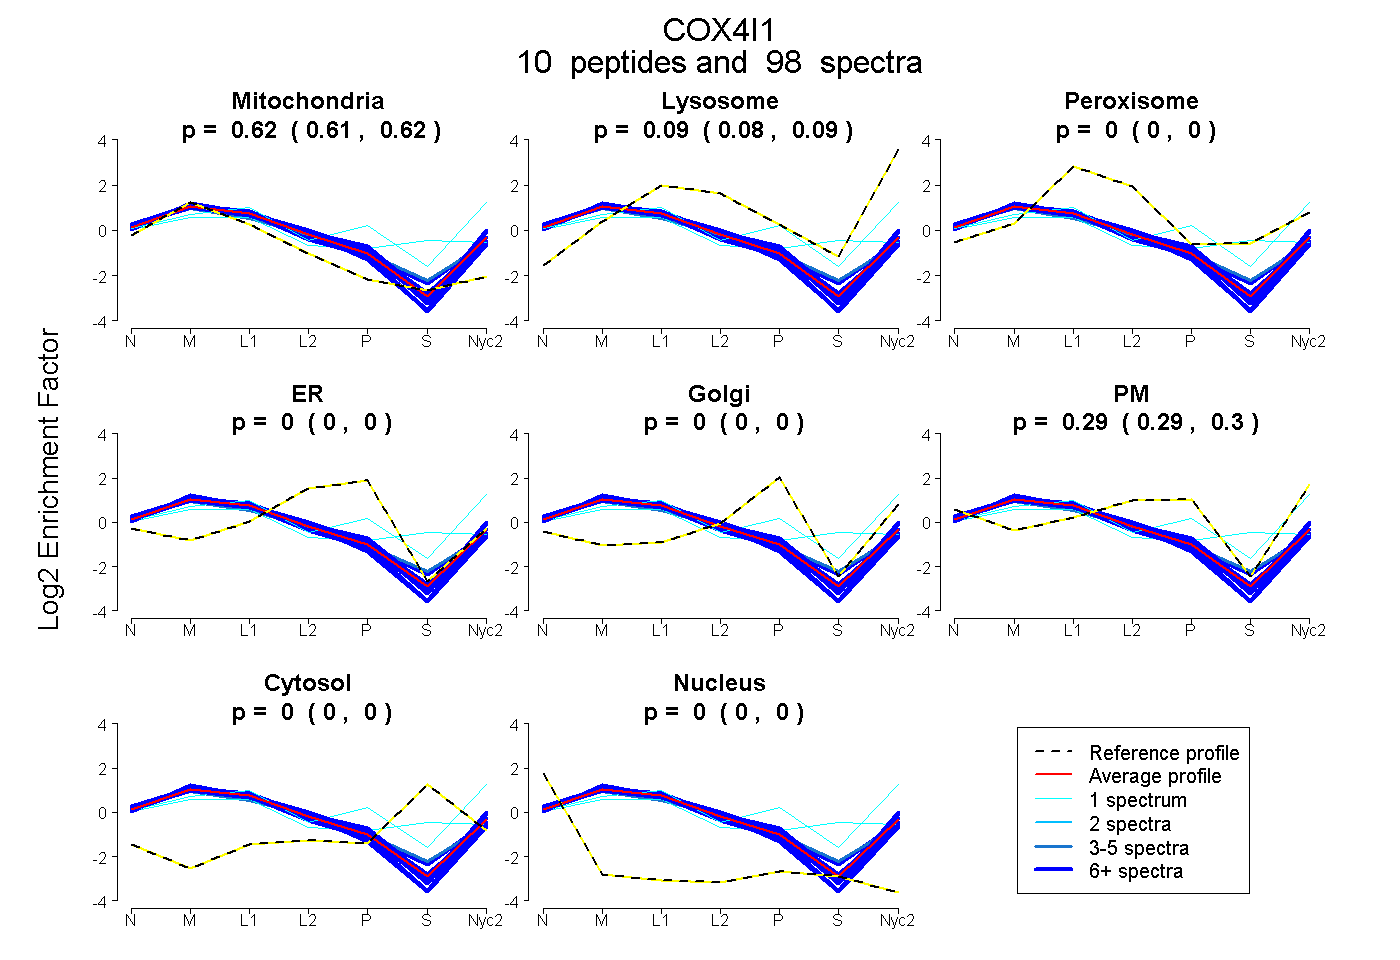
0.614 | 0.619
0.084 | 0.092
0.000 | 0.000
0.000 | 0.000
0.000 | 0.000
0.291 | 0.298
0.000 | 0.000
0.000 | 0.000
8peptides
spectra
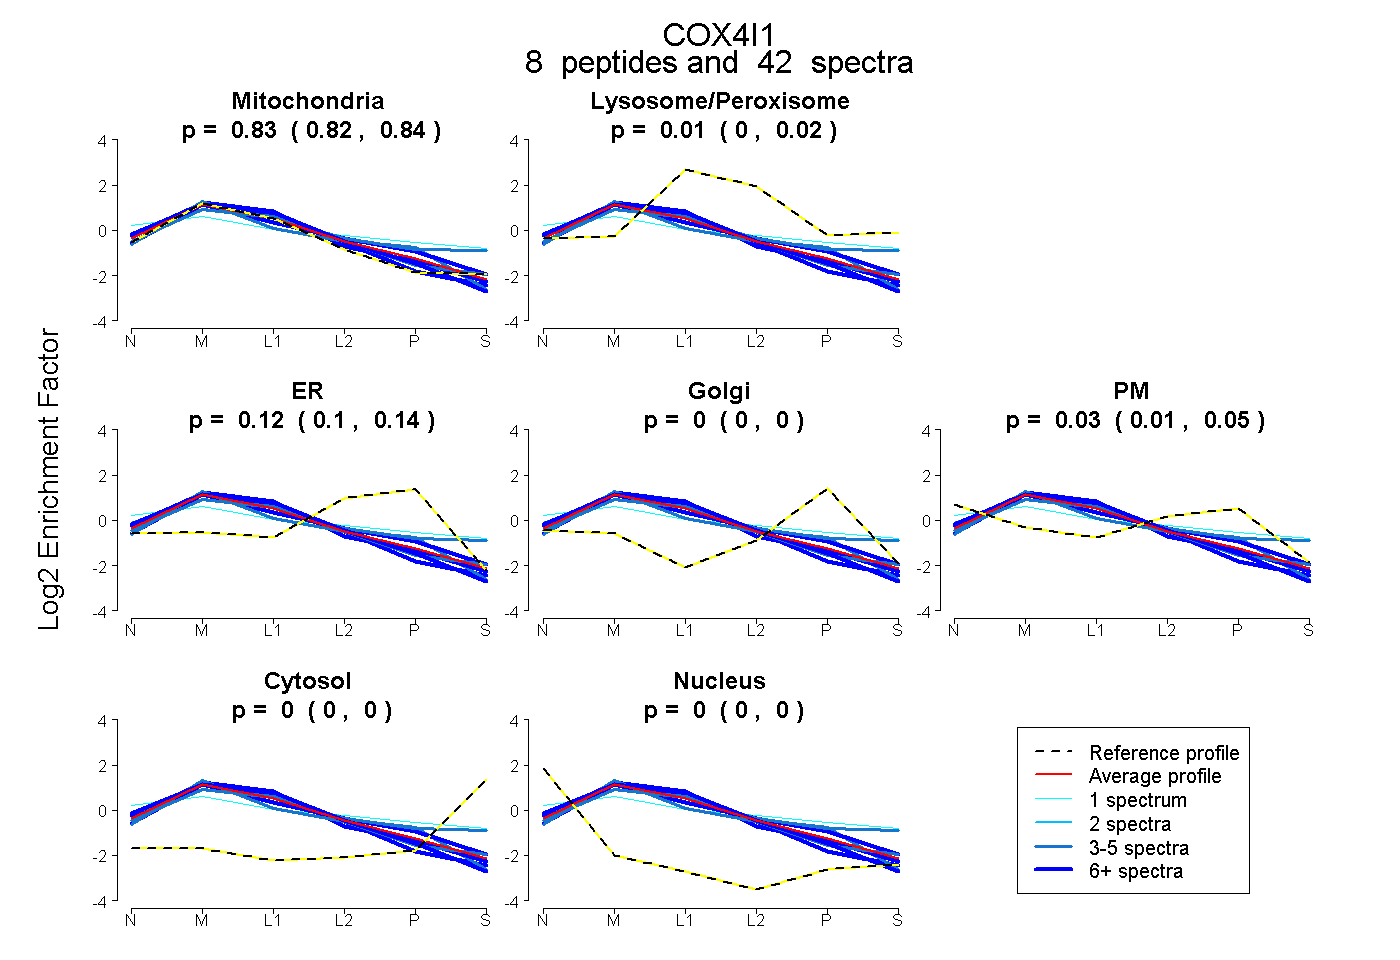
0.817 | 0.839
0.004 | 0.023
0.101 | 0.140
0.000 | 0.000
0.012 | 0.051
0.000 | 0.000
0.000 | 0.000
10peptides
spectra
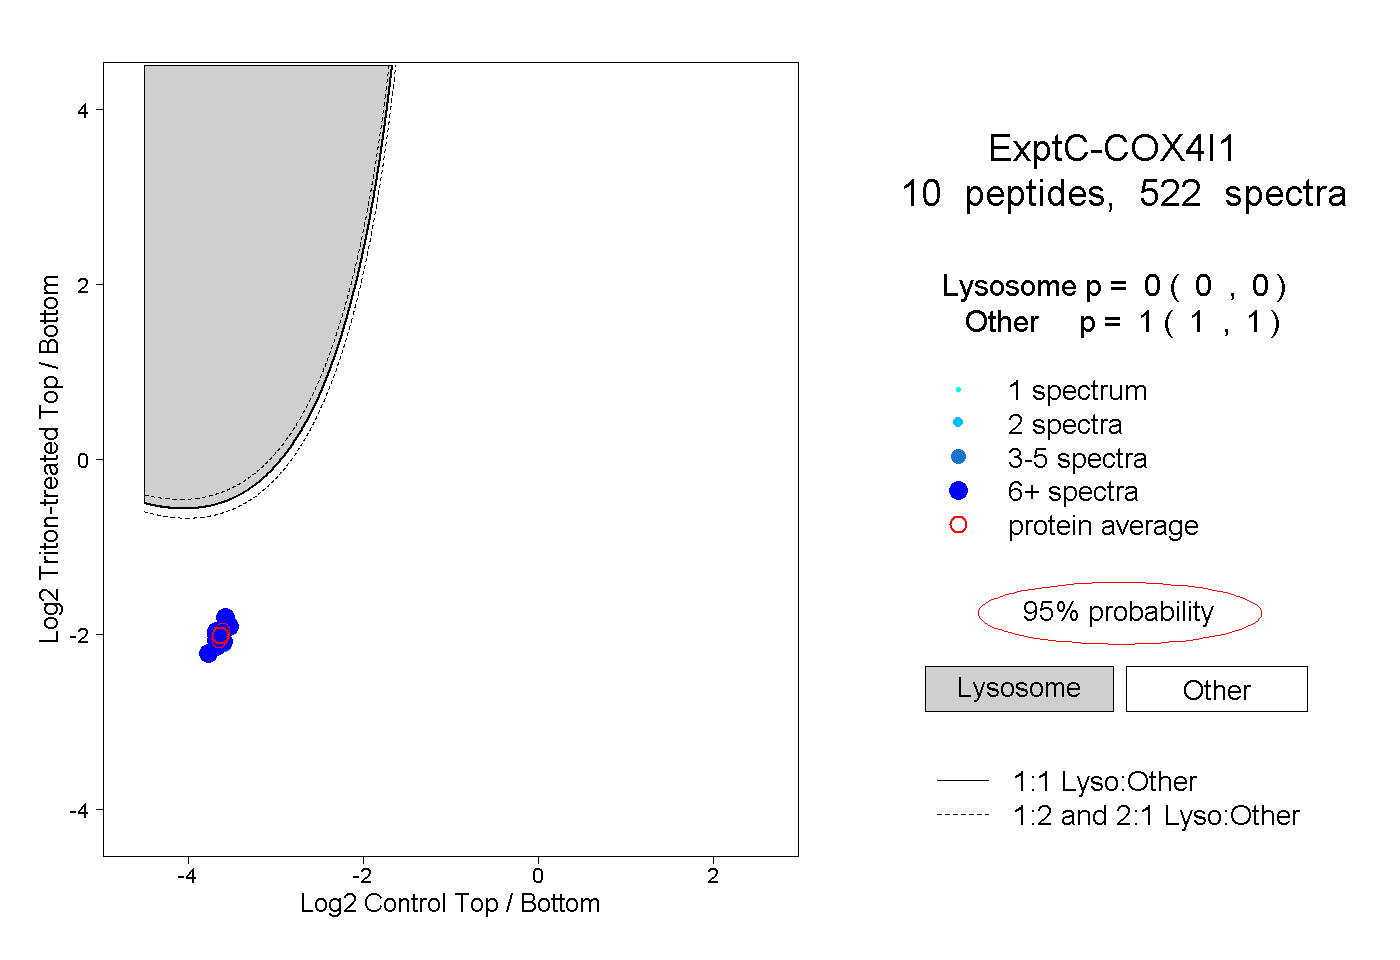
0.000 | 0.000
1.000 | 1.000
8peptides
spectra
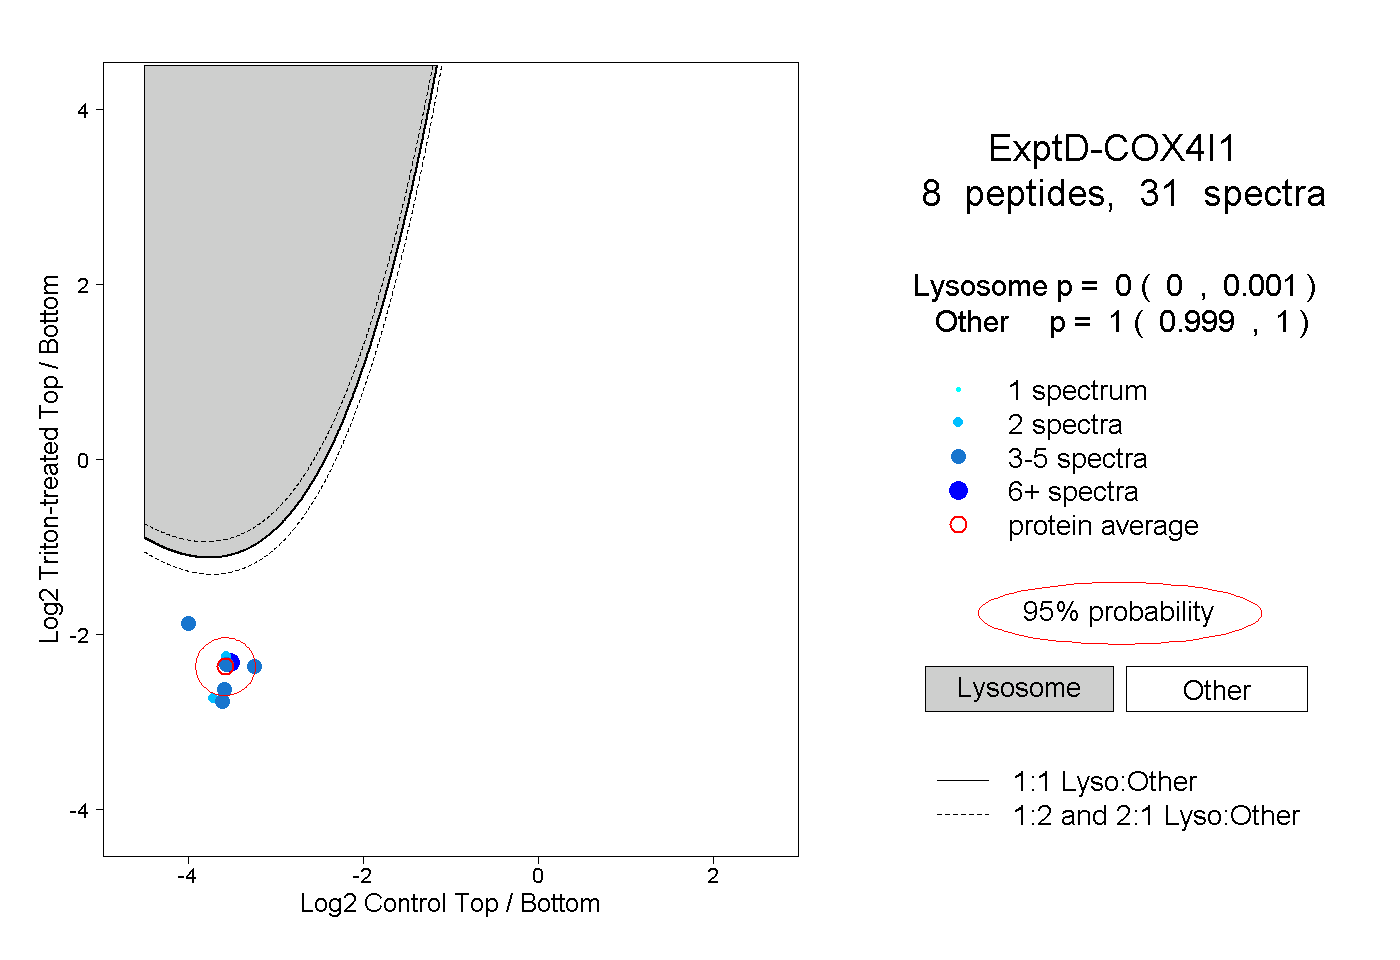
0.000 | 0.001
0.999 | 1.000