COX4I1
[ENSRNOP00000024033]
Main page
| | | Plot |
Mito |
Lyso |
|
Perox |
ER |
Golgi |
PM |
Cytosol |
Nucleus |
|
| Expt A |
 10
10
peptides |
98
spectra |
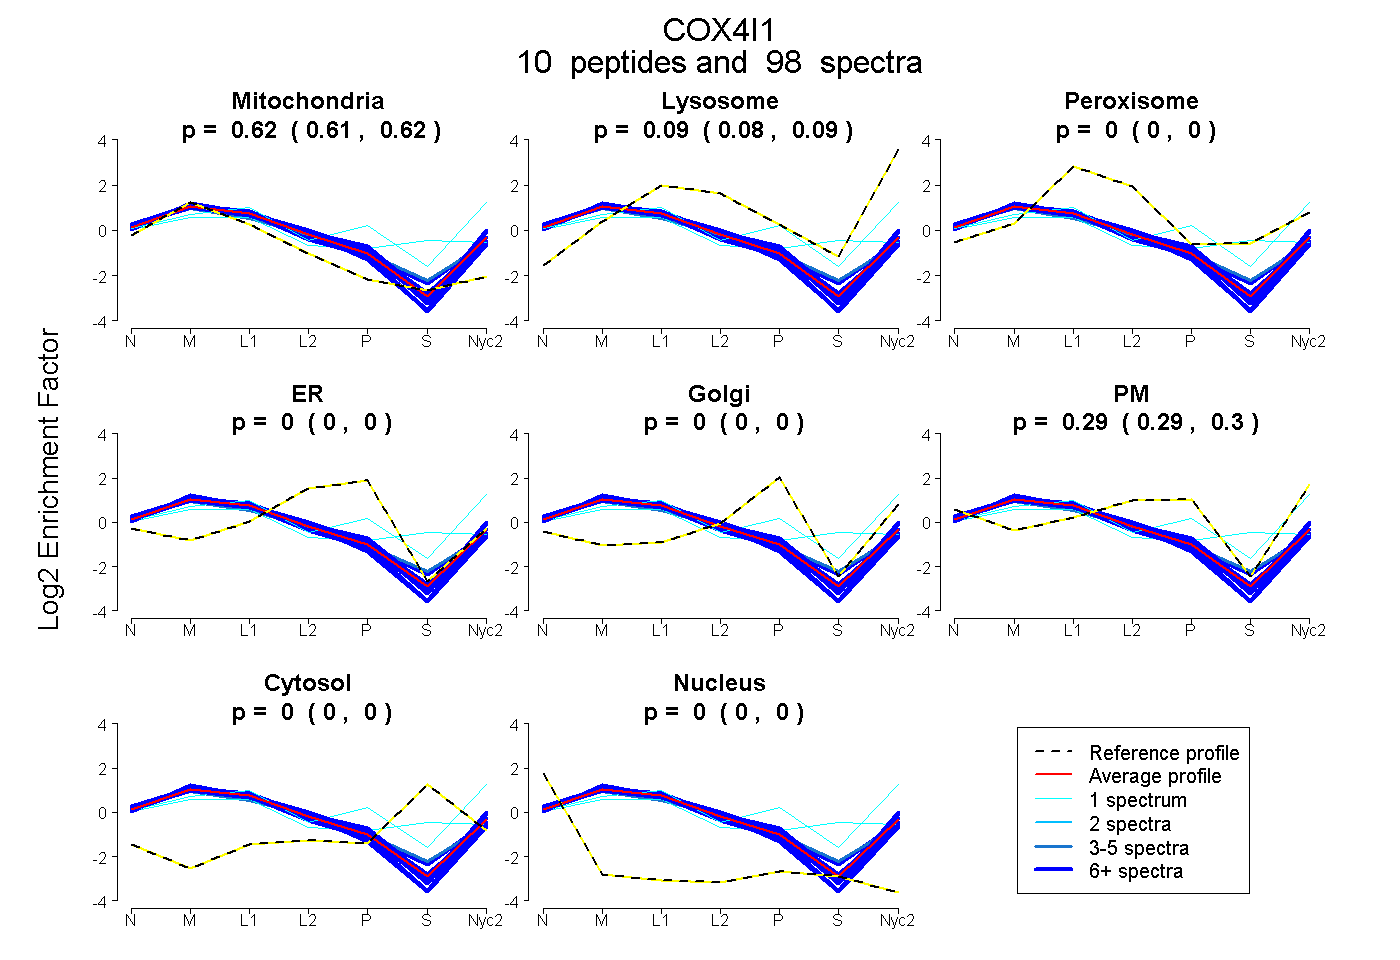 |
0.617
0.614 | 0.619 |
0.089
0.084 | 0.092 |
|
0.000
0.000 | 0.000 |
0.000
0.000 | 0.000 |
0.000
0.000 | 0.000 |
0.294
0.291 | 0.298 |
0.000
0.000 | 0.000 |
0.000
0.000 | 0.000 |
|
| | | Plot |
Mito |
|
Lyso or Perox |
|
ER |
Golgi |
PM |
Cytosol |
Nucleus |
|
| Expt B |
8
peptides |
42
spectra |
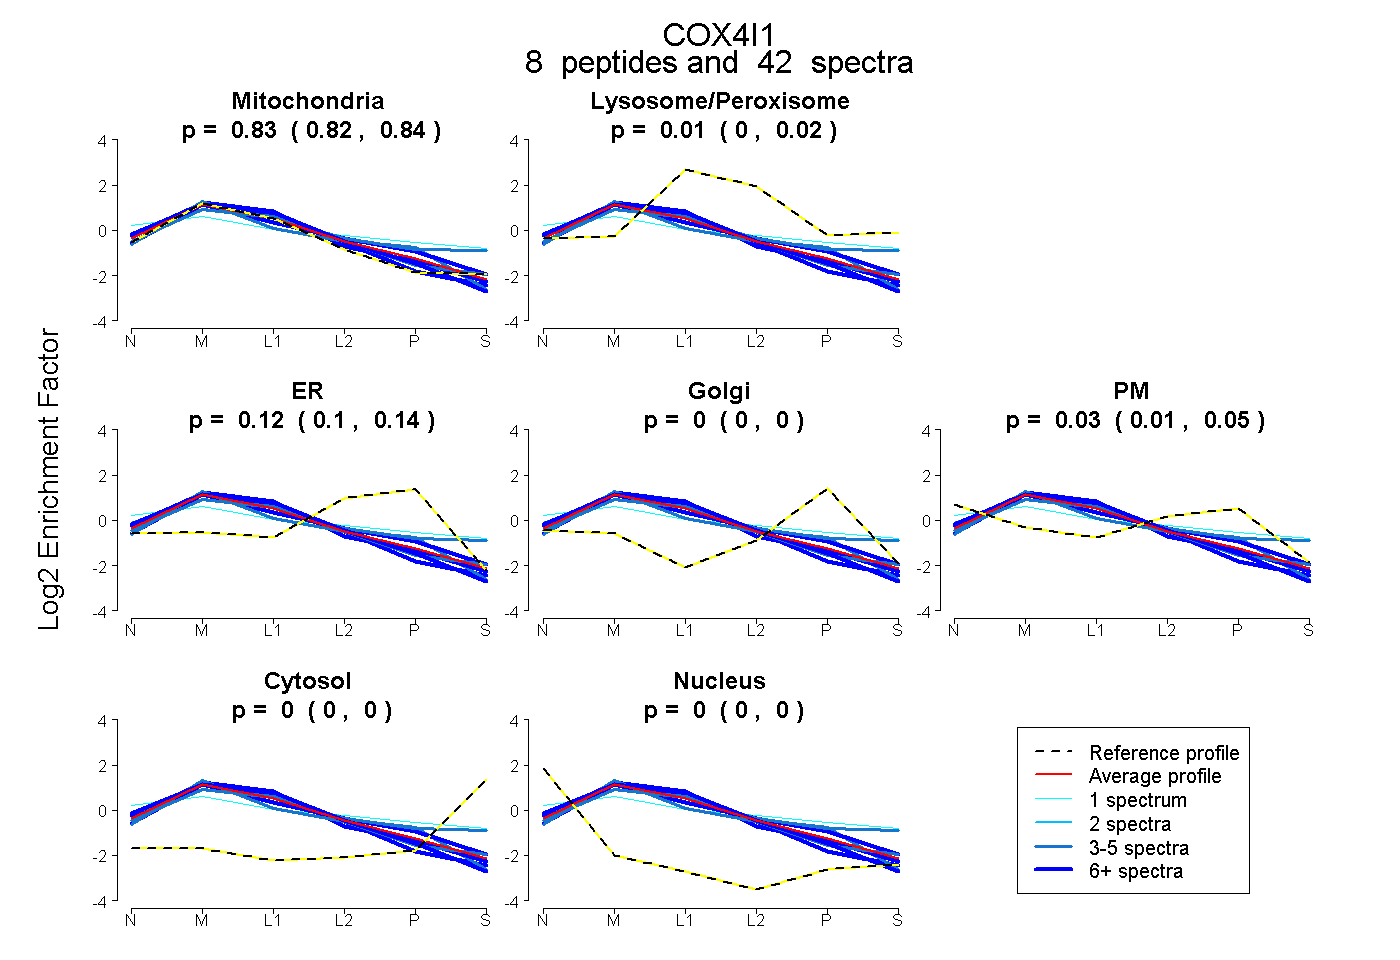 |
0.829
0.817 | 0.839 |
|
0.015
0.004 | 0.023 |
|
0.122
0.101 | 0.140 |
0.000
0.000 | 0.000 |
0.033
0.012 | 0.051 |
0.000
0.000 | 0.000 |
0.000
0.000 | 0.000 |
|
| 7 spectra, DYPLPDVAHVK |
0.908 |
|
0.019 |
|
0.073 |
0.000 |
0.000 |
0.000 |
0.000 |
|
| 5 spectra, SEDYALPSYVDR |
0.892 |
|
0.000 |
|
0.084 |
0.024 |
0.000 |
0.000 |
0.000 |
|
| 3 spectra, LLSASQK |
0.568 |
|
0.248 |
|
0.000 |
0.118 |
0.000 |
0.066 |
0.000 |
|
| 1 spectrum, DWVAMQTK |
0.348 |
|
0.160 |
|
0.000 |
0.000 |
0.391 |
0.101 |
0.000 |
|
| 6 spectra, VNPIQGFSAK |
0.890 |
|
0.000 |
|
0.078 |
0.000 |
0.032 |
0.000 |
0.000 |
|
| 3 spectra, AHGSVVK |
0.719 |
|
0.000 |
|
0.201 |
0.000 |
0.080 |
0.000 |
0.000 |
|
| 9 spectra, IQFNESFAEMNK |
0.759 |
|
0.020 |
|
0.221 |
0.000 |
0.000 |
0.000 |
0.000 |
|
| 8 spectra, ADWSSLSR |
0.947 |
|
0.000 |
|
0.005 |
0.000 |
0.049 |
0.000 |
0.000 |
|
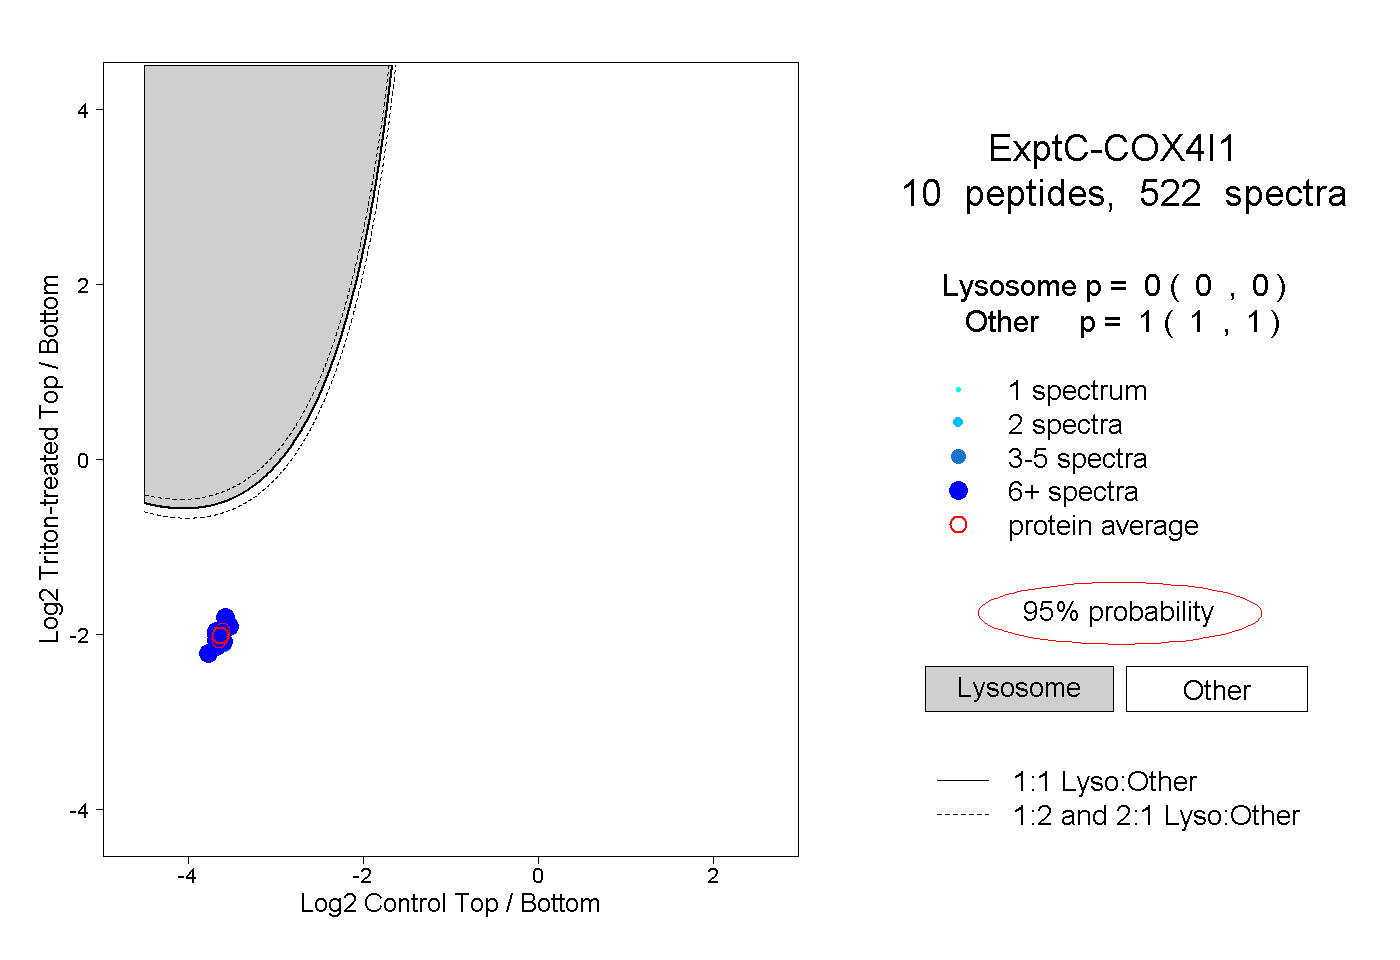
| | | Plot |
|
Lyso |
|
|
|
|
|
|
|
Other |
| Expt C |
10
peptides |
522
spectra |
 |
|
0.000
0.000 | 0.000 |
|
|
|
|
|
|
|
1.000
1.000 | 1.000 |
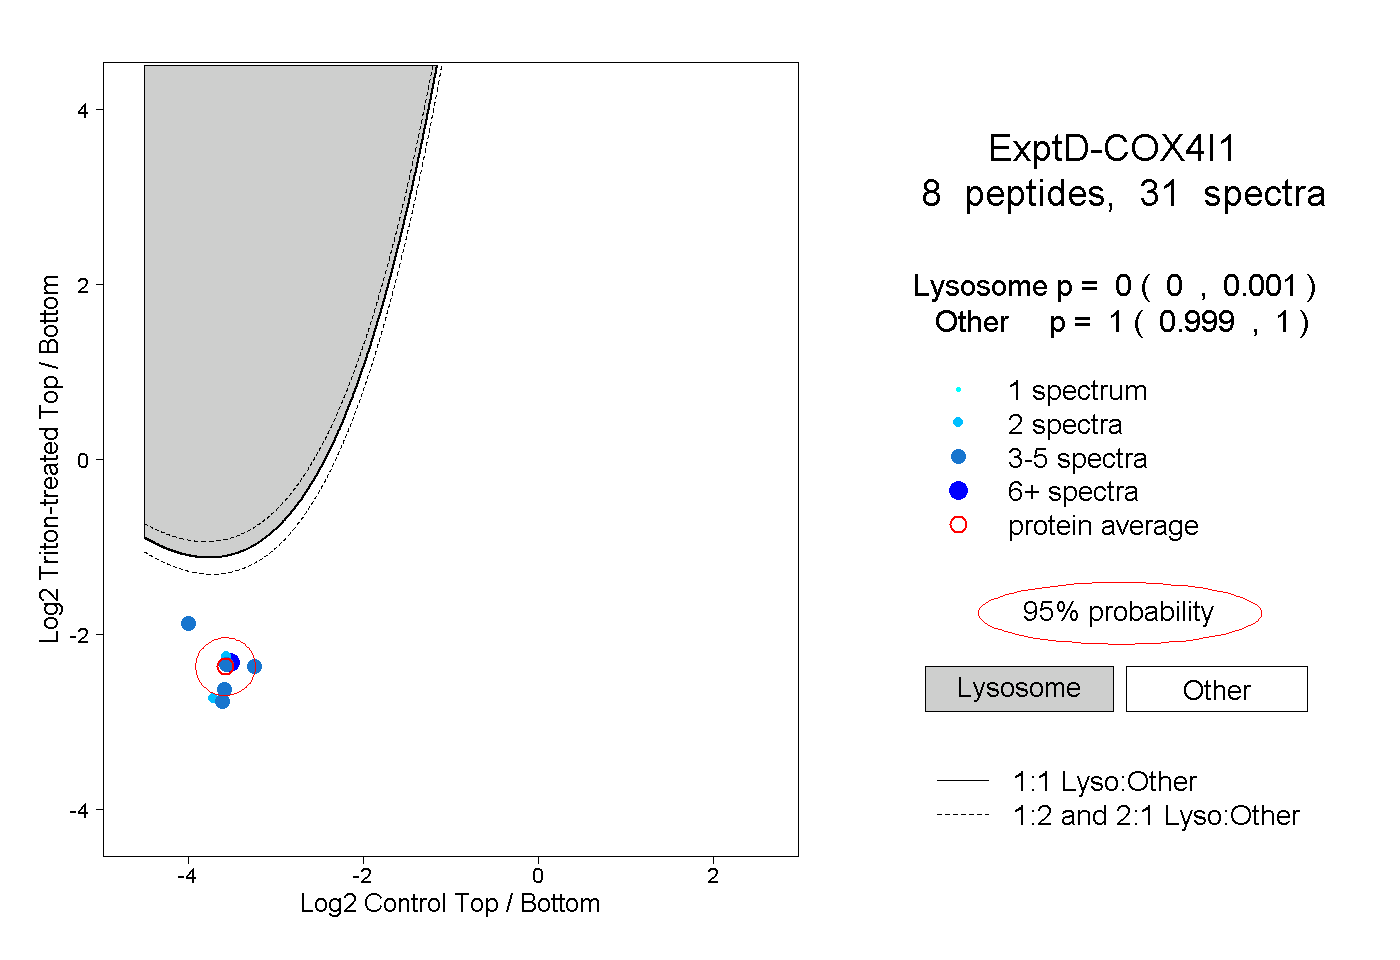
| | | Plot |
|
Lyso |
|
|
|
|
|
|
|
Other |
| Expt D |
8
peptides |
31
spectra |
 |
|
0.000
0.000 | 0.001 |
|
|
|
|
|
|
|
1.000
0.999 | 1.000 |