 10
10peptides
spectra
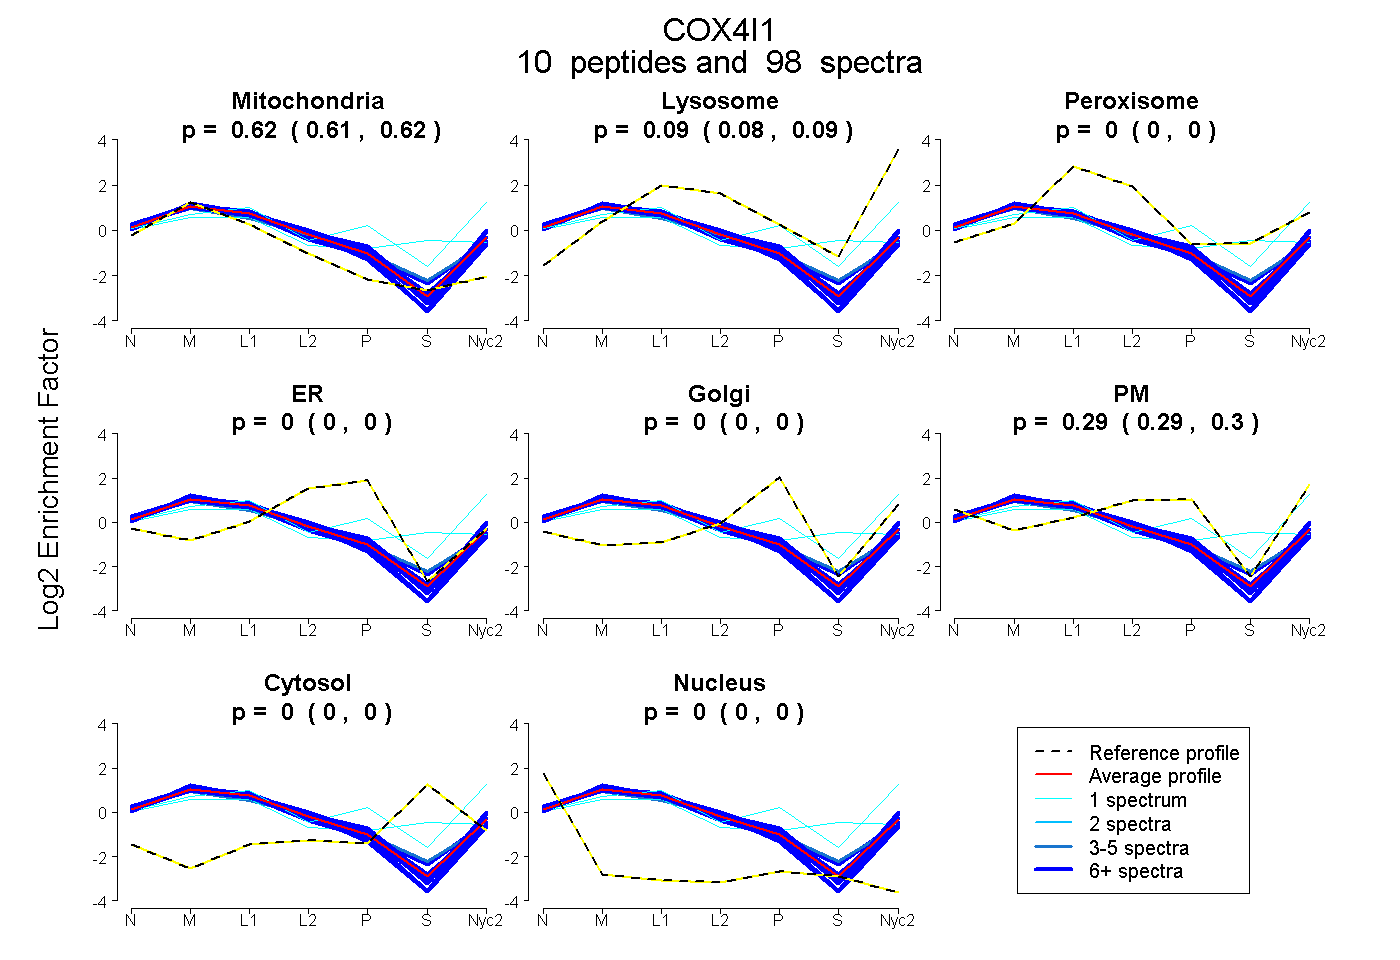
0.614 | 0.619
0.084 | 0.092
0.000 | 0.000
0.000 | 0.000
0.000 | 0.000
0.291 | 0.298
0.000 | 0.000
0.000 | 0.000
| Plot | Mito | Lyso | Perox | ER | Golgi | PM | Cytosol | Nucleus | |||||
| Expt A |
10 peptides |
98 spectra |
|
0.617 0.614 | 0.619 |
0.089 0.084 | 0.092 |
0.000 0.000 | 0.000 |
0.000 0.000 | 0.000 |
0.000 0.000 | 0.000 |
0.294 0.291 | 0.298 |
0.000 0.000 | 0.000 |
0.000 0.000 | 0.000 |
| 19 spectra, DYPLPDVAHVK | 0.588 | 0.000 | 0.086 | 0.000 | 0.000 | 0.326 | 0.000 | 0.000 | ||
| 1 spectrum, SYVYGPIPHTFDR | 0.313 | 0.301 | 0.000 | 0.000 | 0.059 | 0.317 | 0.009 | 0.000 | ||
| 24 spectra, SEDYALPSYVDR | 0.684 | 0.016 | 0.000 | 0.000 | 0.000 | 0.299 | 0.000 | 0.000 | ||
| 14 spectra, LLSASQK | 0.643 | 0.040 | 0.039 | 0.000 | 0.000 | 0.278 | 0.000 | 0.000 | ||
| 6 spectra, DWVAMQTK | 0.617 | 0.074 | 0.000 | 0.000 | 0.000 | 0.309 | 0.000 | 0.000 | ||
| 8 spectra, VNPIQGFSAK | 0.573 | 0.054 | 0.000 | 0.000 | 0.000 | 0.374 | 0.000 | 0.000 | ||
| 3 spectra, AHGSVVK | 0.598 | 0.000 | 0.116 | 0.000 | 0.000 | 0.285 | 0.000 | 0.000 | ||
| 9 spectra, IQFNESFAEMNK | 0.572 | 0.088 | 0.000 | 0.000 | 0.000 | 0.340 | 0.000 | 0.000 | ||
| 13 spectra, ADWSSLSR | 0.621 | 0.059 | 0.101 | 0.000 | 0.000 | 0.219 | 0.000 | 0.000 | ||
| 1 spectrum, GTNEWK | 0.392 | 0.000 | 0.264 | 0.000 | 0.000 | 0.102 | 0.242 | 0.000 |
| Plot | Mito | Lyso or Perox | ER | Golgi | PM | Cytosol | Nucleus | ||||||
| Expt B |
8 peptides |
42 spectra |
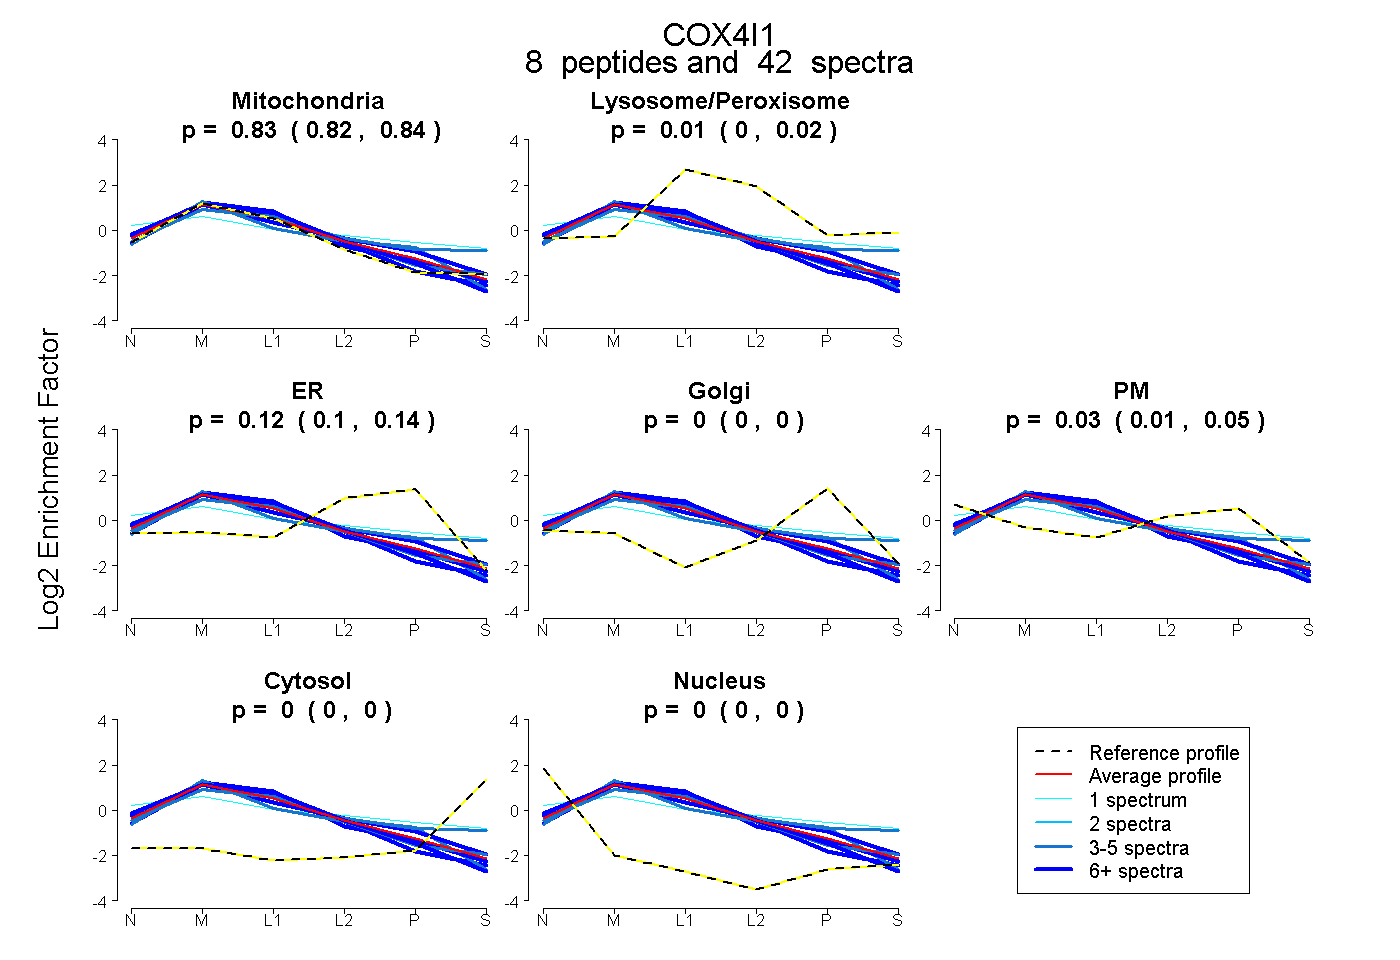 |
0.829 0.817 | 0.839 |
0.015 0.004 | 0.023 |
0.122 0.101 | 0.140 |
0.000 0.000 | 0.000 |
0.033 0.012 | 0.051 |
0.000 0.000 | 0.000 |
0.000 0.000 | 0.000 |
|||
| Plot | Lyso | Other | |||||||||||
| Expt C |
10 peptides |
522 spectra |
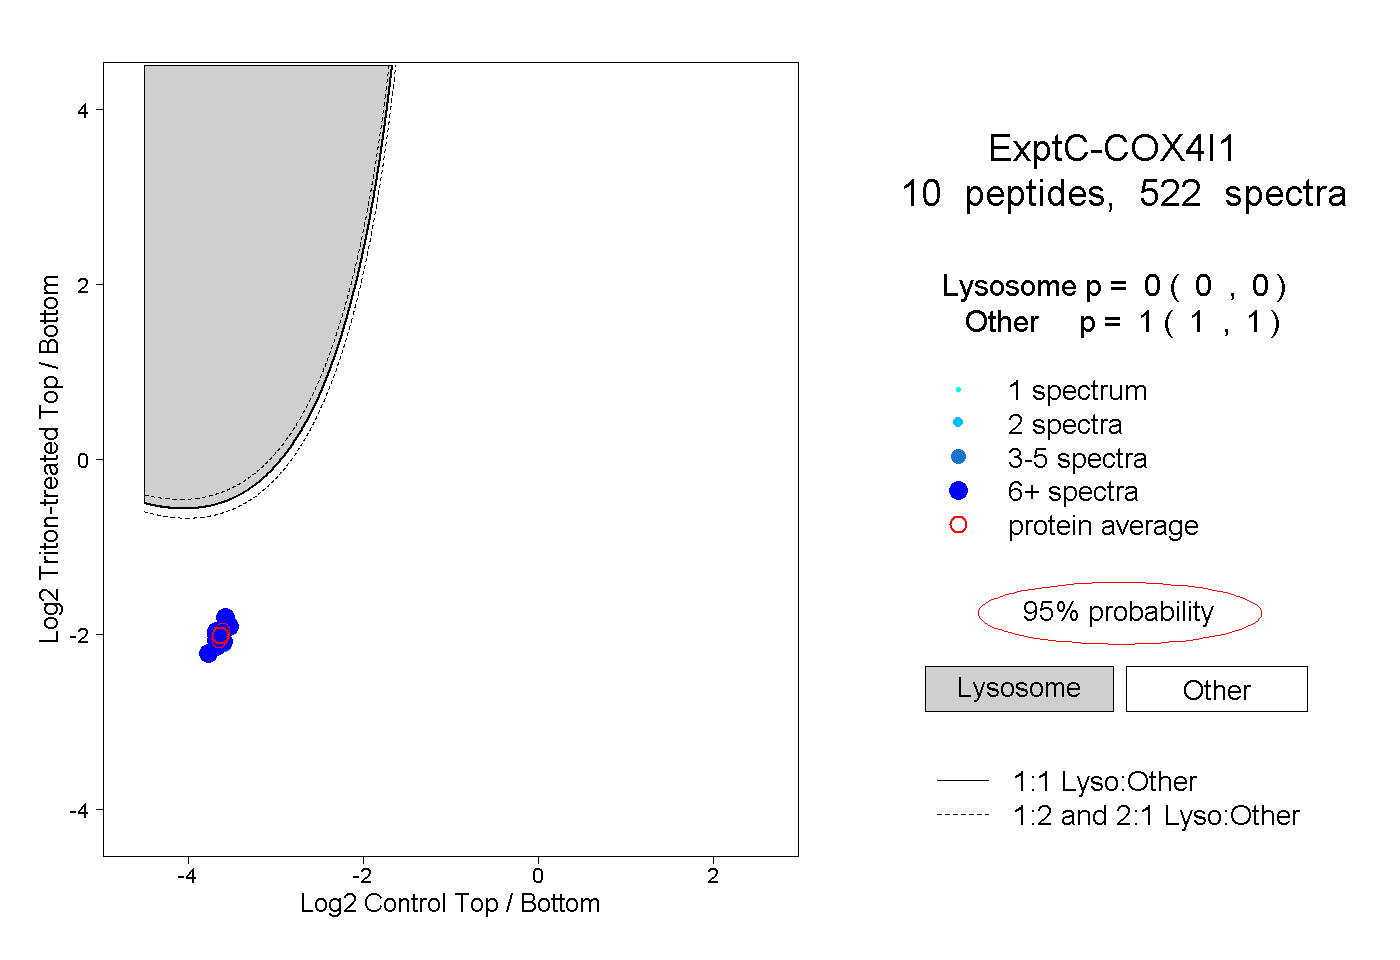 |
0.000 0.000 | 0.000 |
1.000 1.000 | 1.000 |
||||||||
| Plot | Lyso | Other | |||||||||||
| Expt D |
8 peptides |
31 spectra |
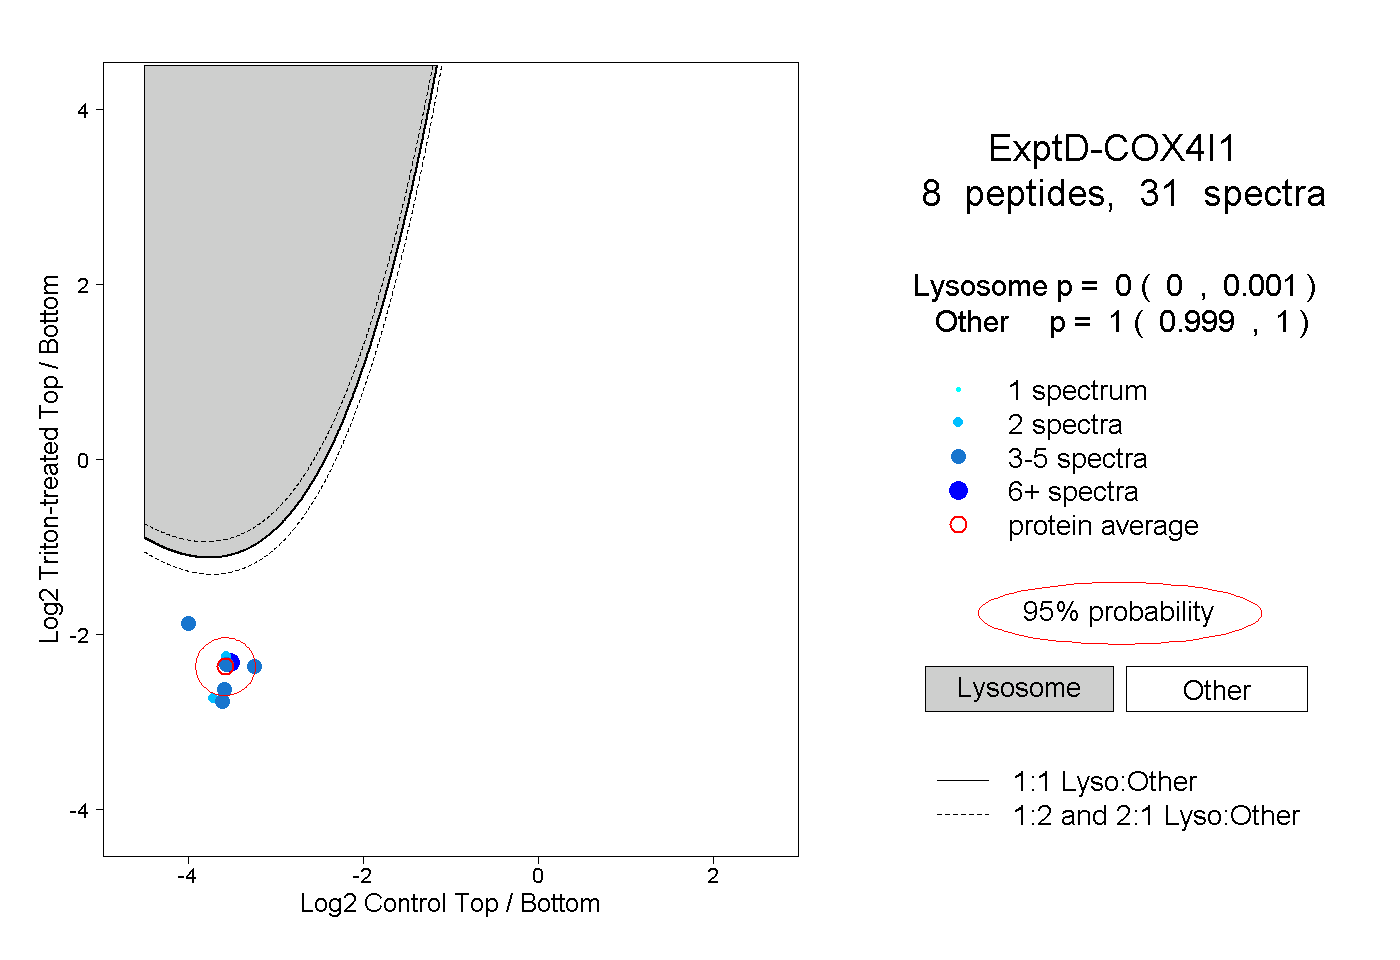 |
0.000 0.000 | 0.001 |
1.000 0.999 | 1.000 |