 32
32peptides
spectra
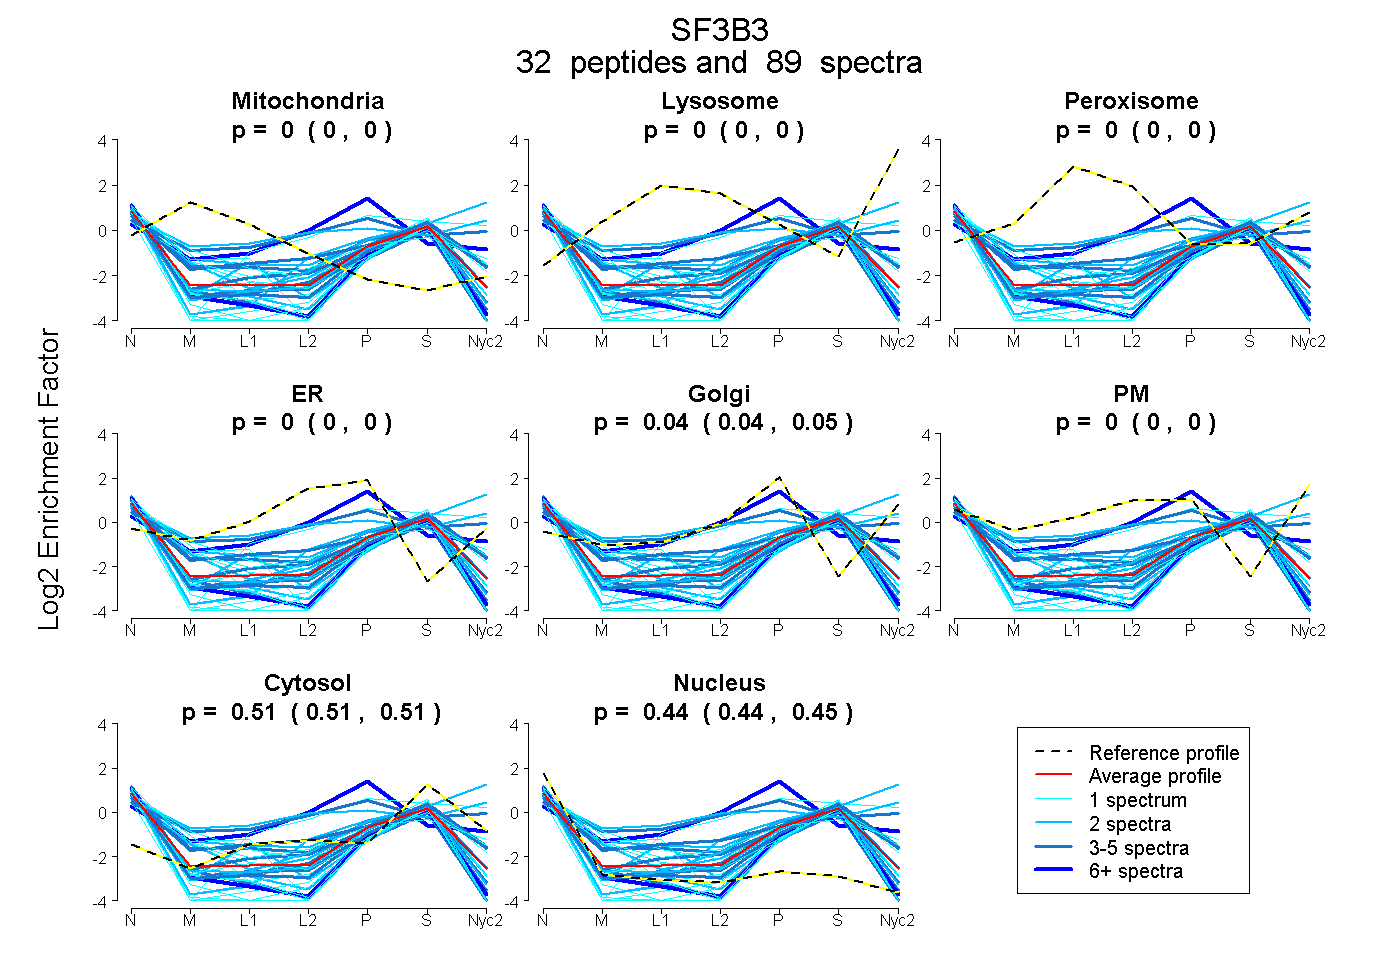
0.000 | 0.000
0.000 | 0.000
0.000 | 0.000
0.000 | 0.000
0.039 | 0.049
0.000 | 0.000
0.509 | 0.514
0.438 | 0.449
13peptides
spectra
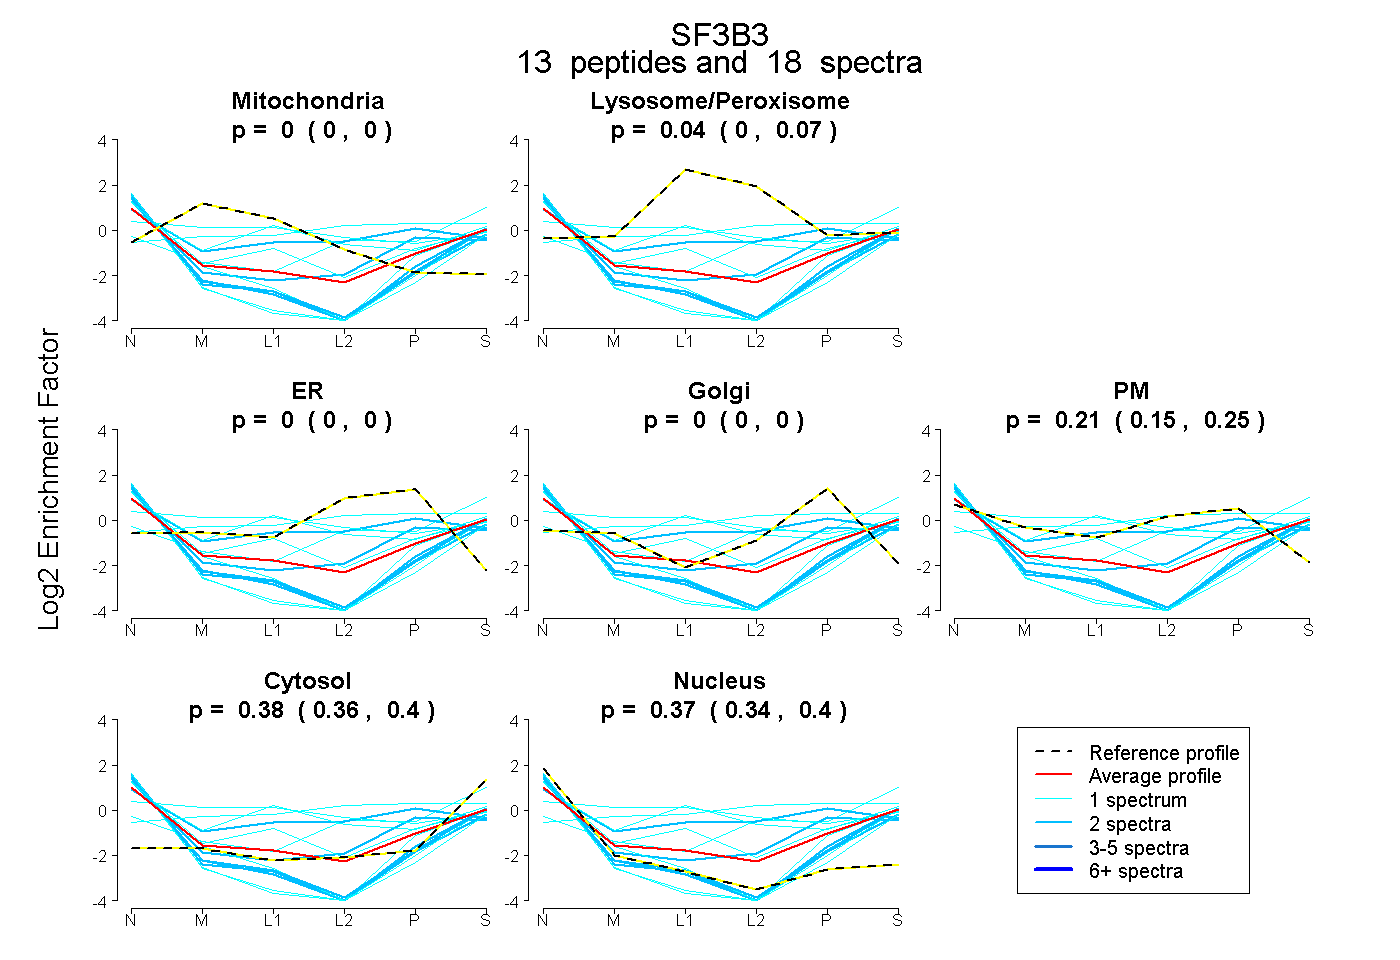
0.000 | 0.000
0.000 | 0.073
0.000 | 0.000
0.000 | 0.000
0.150 | 0.250
0.361 | 0.404
0.339 | 0.399
7peptides
spectra
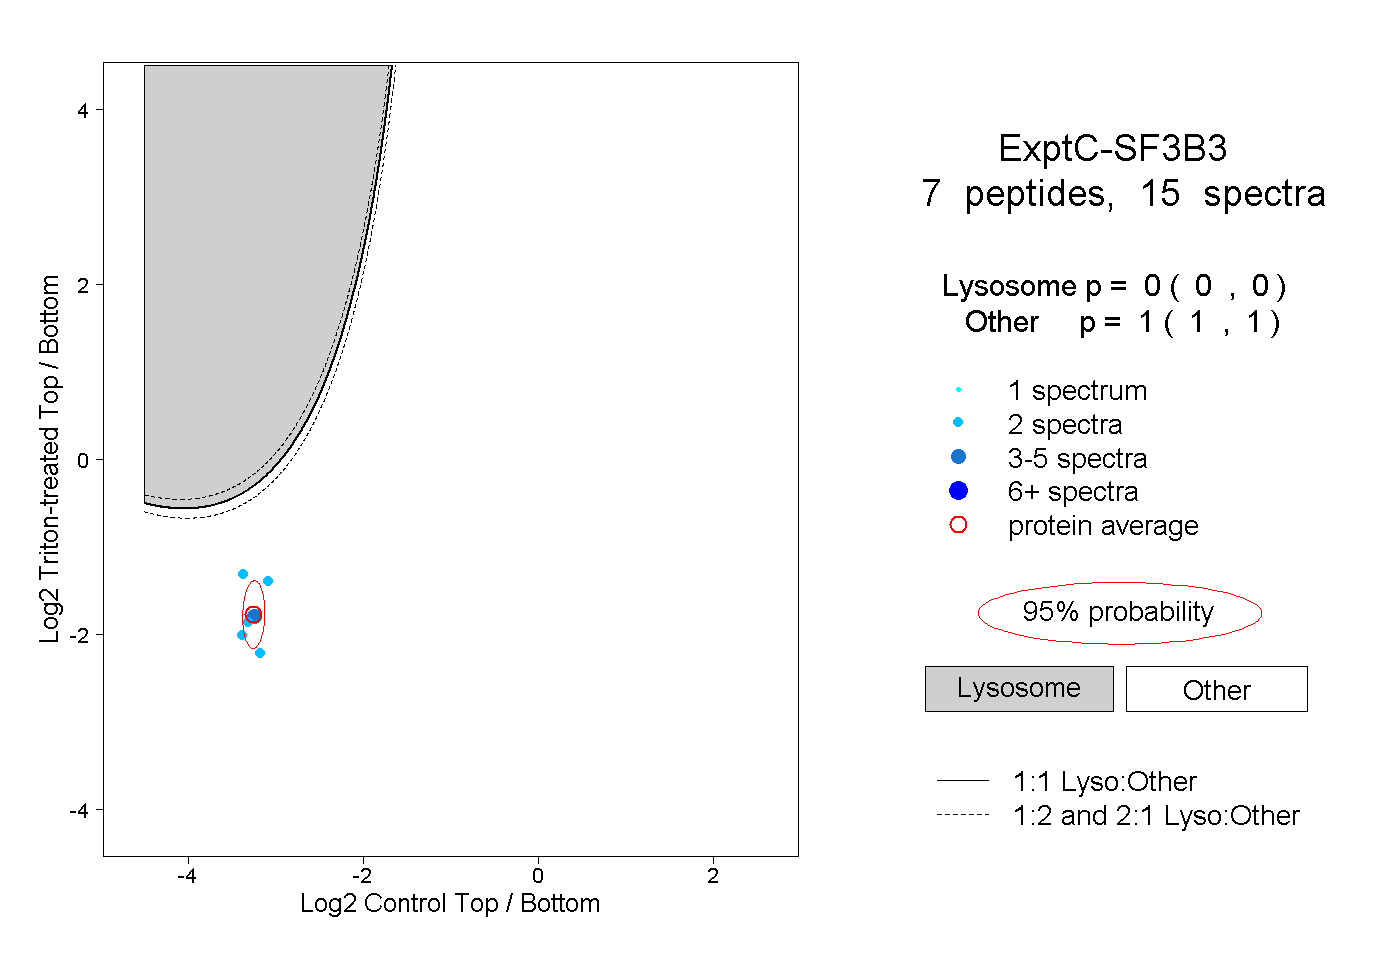
0.000 | 0.000
1.000 | 1.000
2peptides
spectra
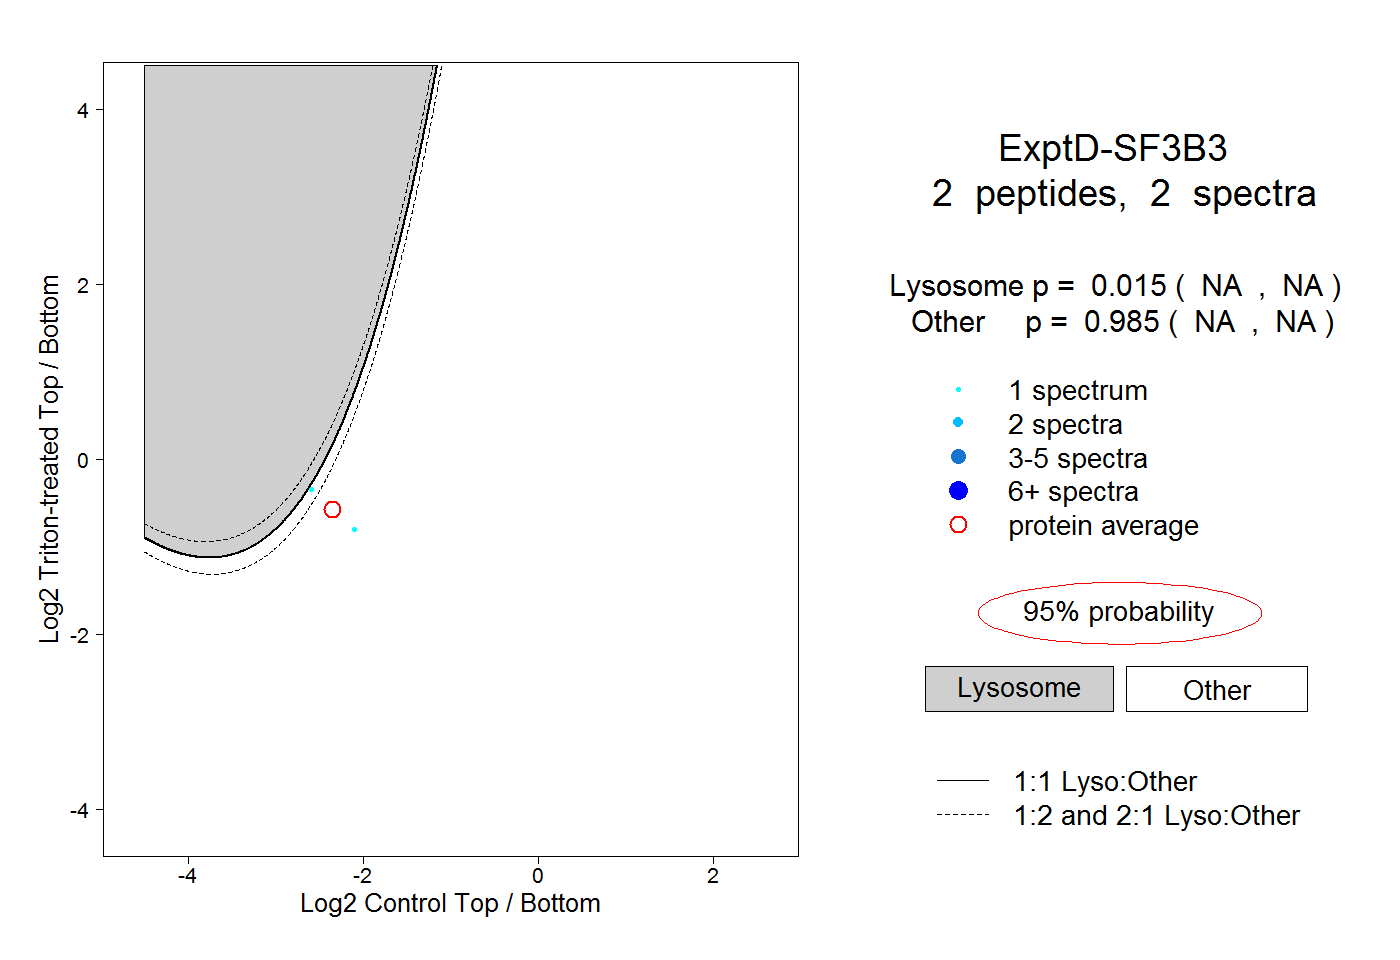
NA | NA
NA | NA