 26
26peptides
spectra
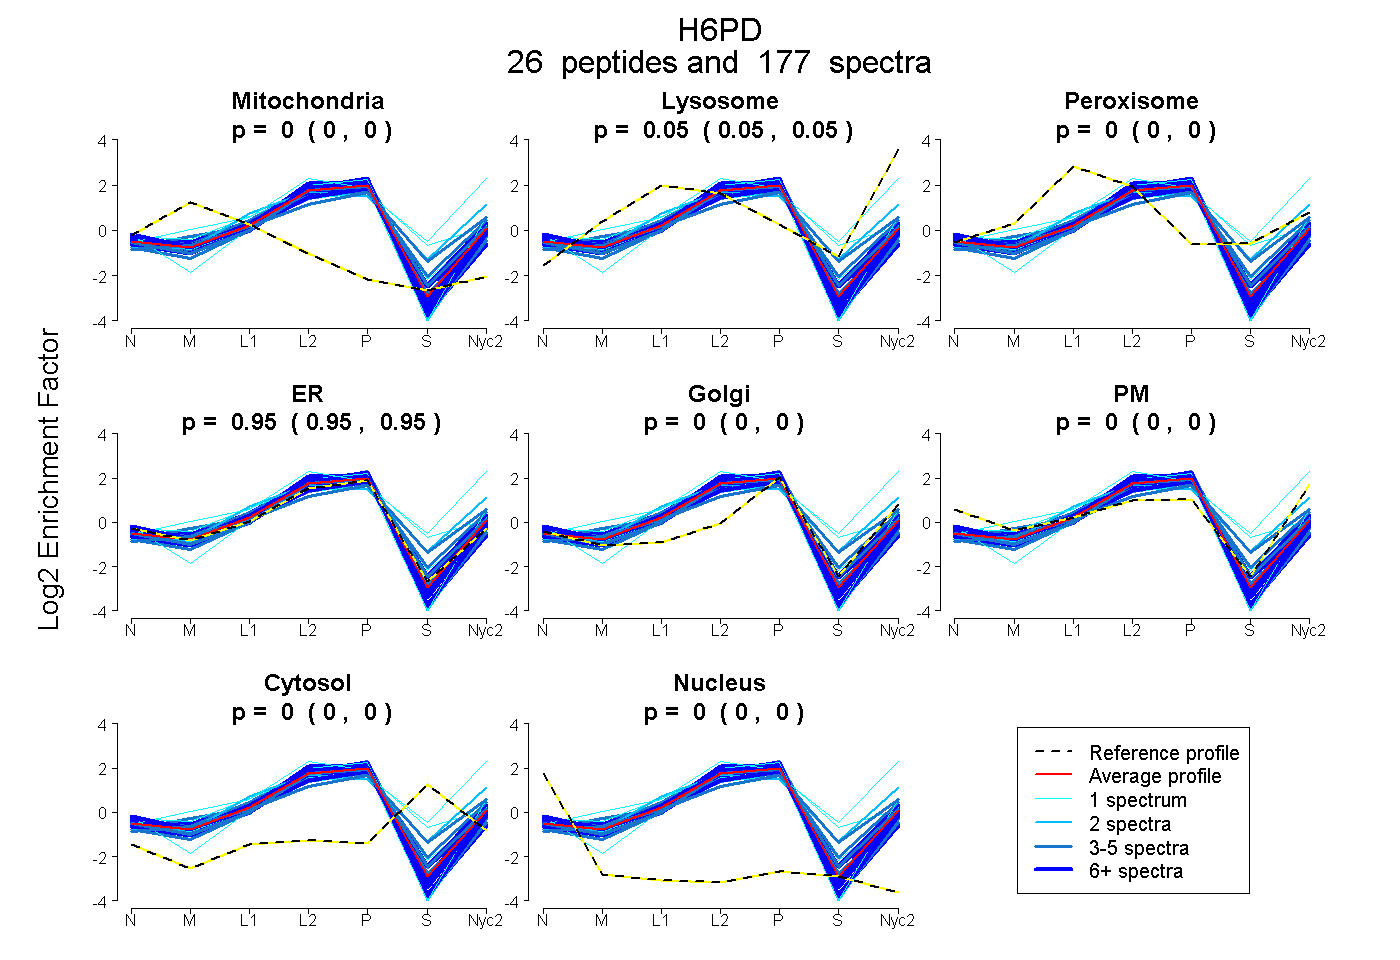
0.000 | 0.000
0.050 | 0.054
0.000 | 0.000
0.946 | 0.950
0.000 | 0.000
0.000 | 0.000
0.000 | 0.000
0.000 | 0.000
25peptides
spectra
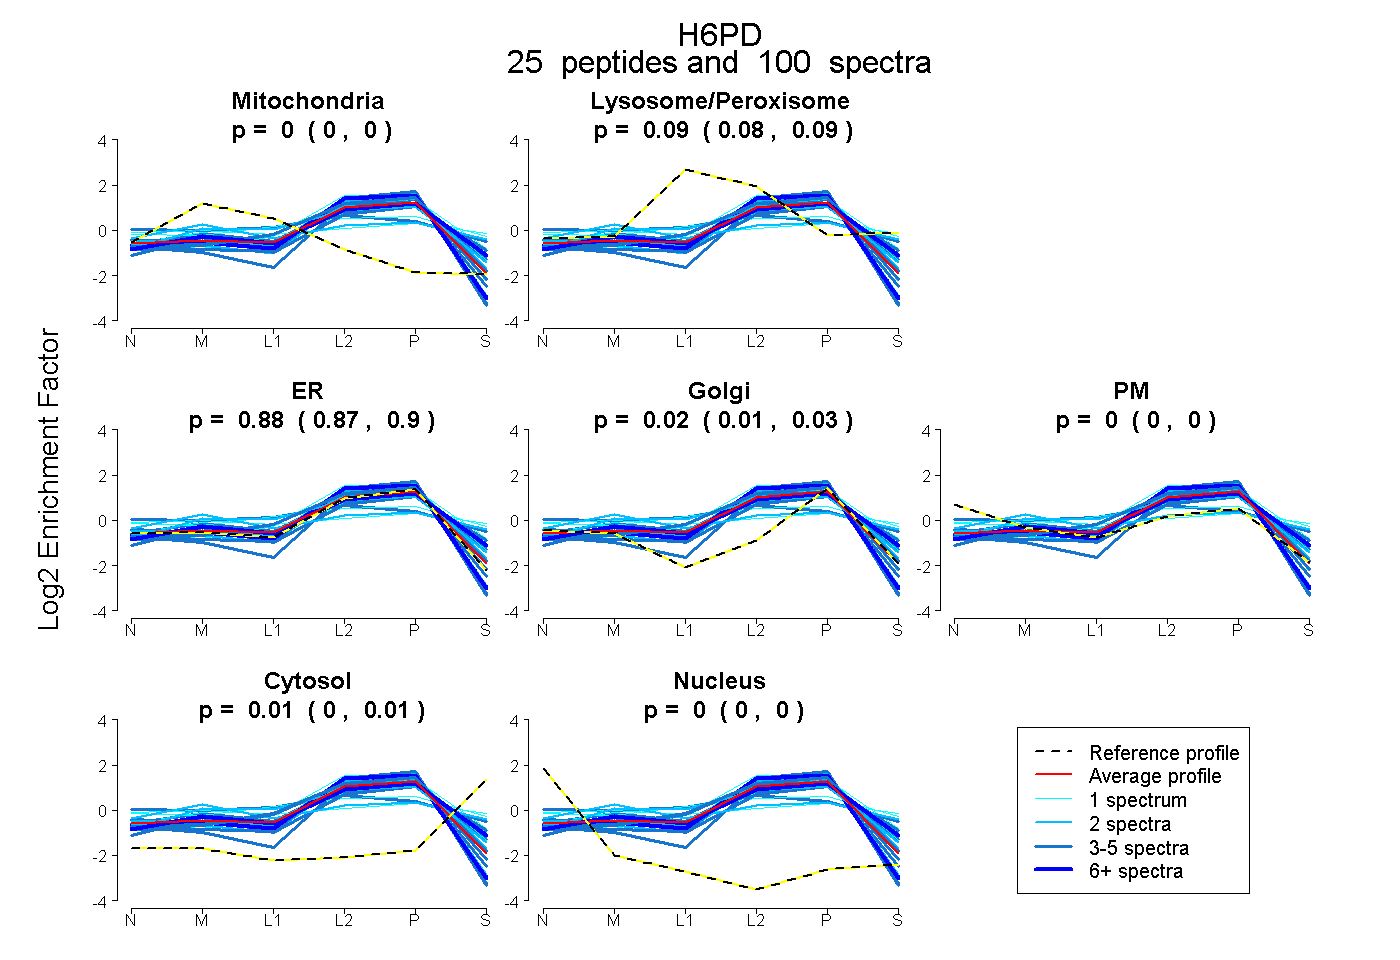
0.000 | 0.000
0.079 | 0.092
0.866 | 0.897
0.008 | 0.033
0.000 | 0.000
0.004 | 0.013
0.000 | 0.000
26peptides
spectra
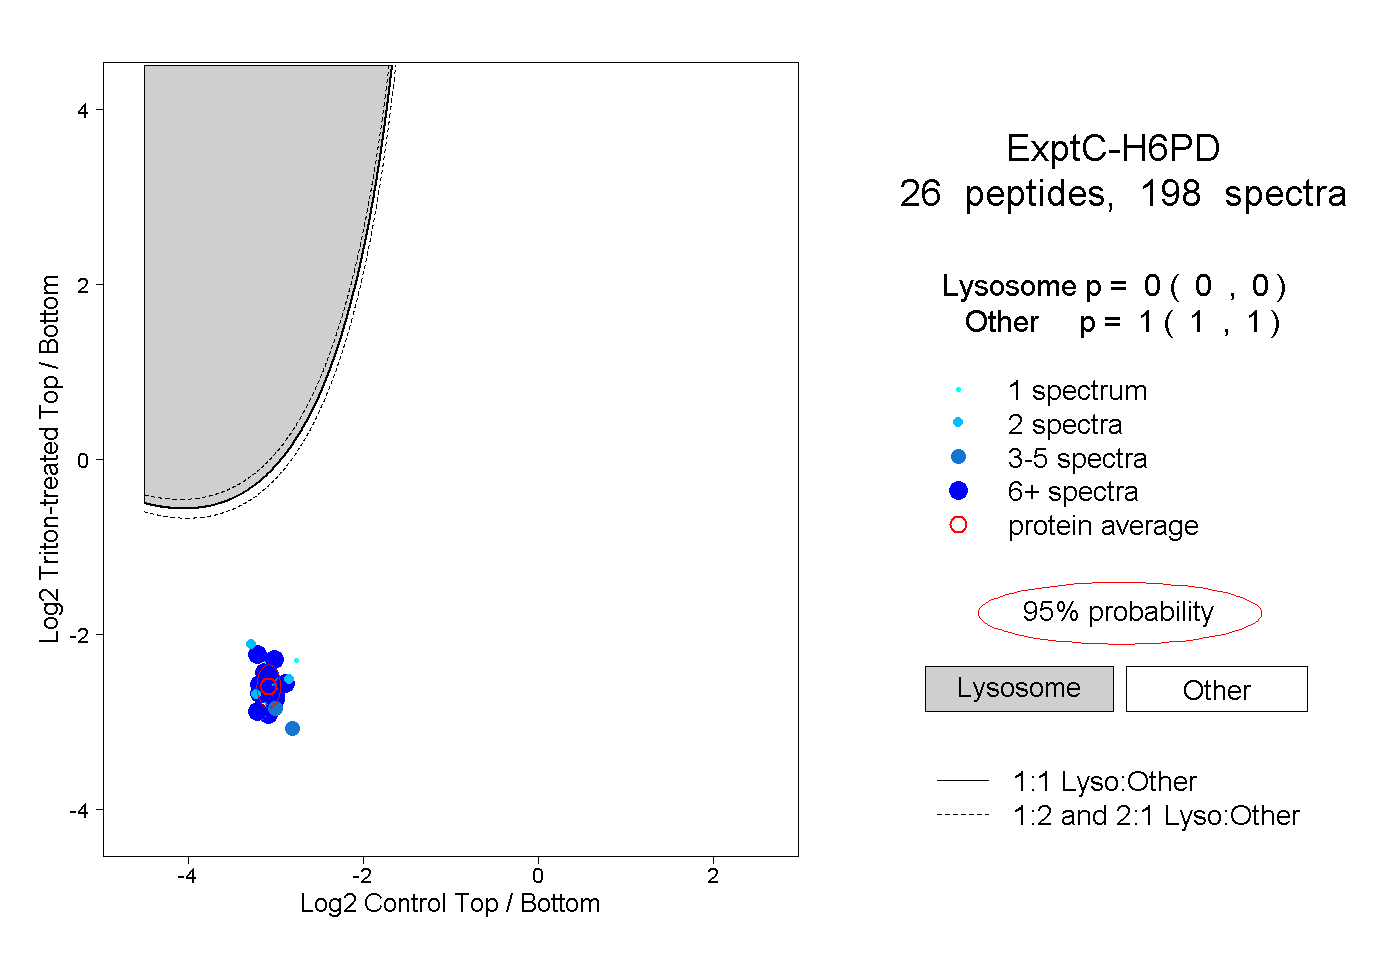
0.000 | 0.000
1.000 | 1.000
13peptides
spectra
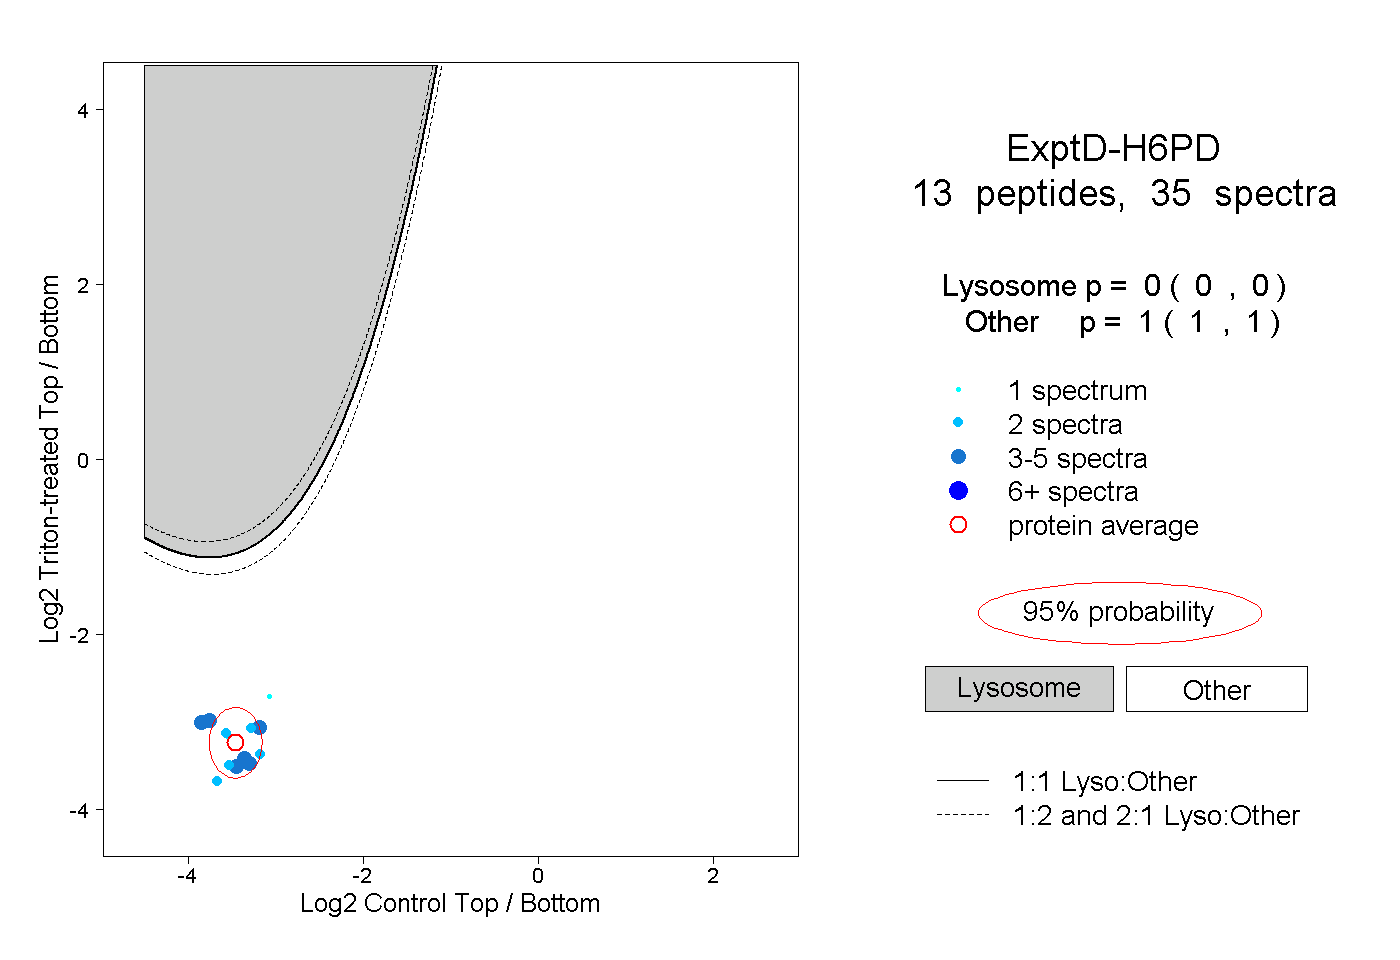
0.000 | 0.000
1.000 | 1.000