| 11 spectra, ASFYEEYGVIR |
|
0.000 |
|
|
|
|
|
|
|
1.000 |
| 16 spectra, AQFLQLSQYR |
|
0.000 |
|
|
|
|
|
|
|
1.000 |
| 12 spectra, MSLSLPLINR |
|
0.000 |
|
|
|
|
|
|
|
1.000 |
| 4 spectra, ALDGLWNR |
|
0.000 |
|
|
|
|
|
|
|
1.000 |
| 1 spectrum, DIETQVQQDGLWEAGR |
|
0.000 |
|
|
|
|
|
|
|
1.000 |
| 2 spectra, VPYYNIHPMPVHLHQR |
|
0.000 |
|
|
|
|
|
|
|
1.000 |
| 8 spectra, VELLLK |
|
0.000 |
|
|
|
|
|
|
|
1.000 |
| 5 spectra, SNAILGQYQAYSGQVR |
|
0.000 |
|
|
|
|
|
|
|
1.000 |
| 13 spectra, HWVPER |
|
0.000 |
|
|
|
|
|
|
|
1.000 |
| 1 spectrum, DLVSPR |
|
0.000 |
|
|
|
|
|
|
|
1.000 |
| 2 spectra, DLVPSR |
|
0.000 |
|
|
|
|
|
|
|
1.000 |
| 5 spectra, SPLITAWPEELISK |
|
0.000 |
|
|
|
|
|
|
|
1.000 |
| 2 spectra, WEGVPFILMSGK |
|
0.000 |
|
|
|
|
|
|
|
1.000 |
| 14 spectra, VDHYLGK |
|
0.000 |
|
|
|
|
|
|
|
1.000 |
| 16 spectra, LQAFQALR |
|
0.000 |
|
|
|
|
|
|
|
1.000 |
| 11 spectra, AYCTQGER |
|
0.000 |
|
|
|
|
|
|
|
1.000 |
| 7 spectra, TVEDYQTLNK |
|
0.000 |
|
|
|
|
|
|
|
1.000 |
| 8 spectra, NLFKPSLPAQSWK |
|
0.000 |
|
|
|
|
|
|
|
1.000 |
| 6 spectra, LANDIEAAAVQAVR |
|
0.000 |
|
|
|
|
|
|
|
1.000 |
| 5 spectra, VGHEPK |
|
0.000 |
|
|
|
|
|
|
|
1.000 |
| 10 spectra, VAVLVMGR |
|
0.000 |
|
|
|
|
|
|
|
1.000 |
| 2 spectra, ETVDAGGR |
|
0.000 |
|
|
|
|
|
|
|
1.000 |
| 2 spectra, VFYFSVPPFAYADIAR |
|
0.000 |
|
|
|
|
|
|
|
1.000 |
| 9 spectra, ALESLSCPK |
|
0.000 |
|
|
|
|
|
|
|
1.000 |
| 11 spectra, QAVAQILPFR |
|
0.000 |
|
|
|
|
|
|
|
1.000 |
| 15 spectra, EITTLVSR |
|
0.000 |
|
|
|
|
|
|
|
1.000 |
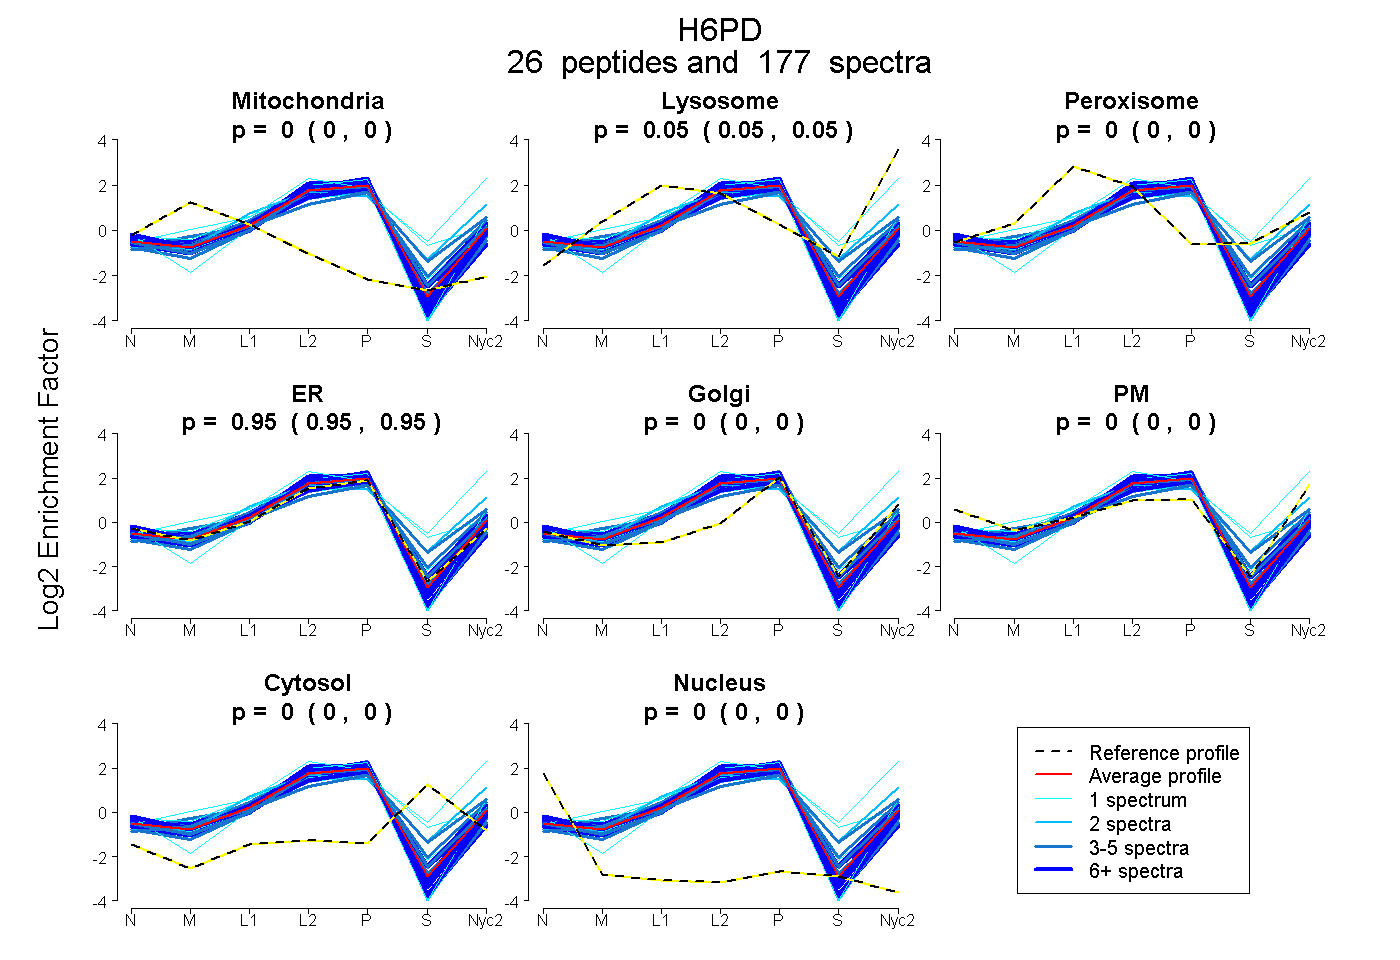
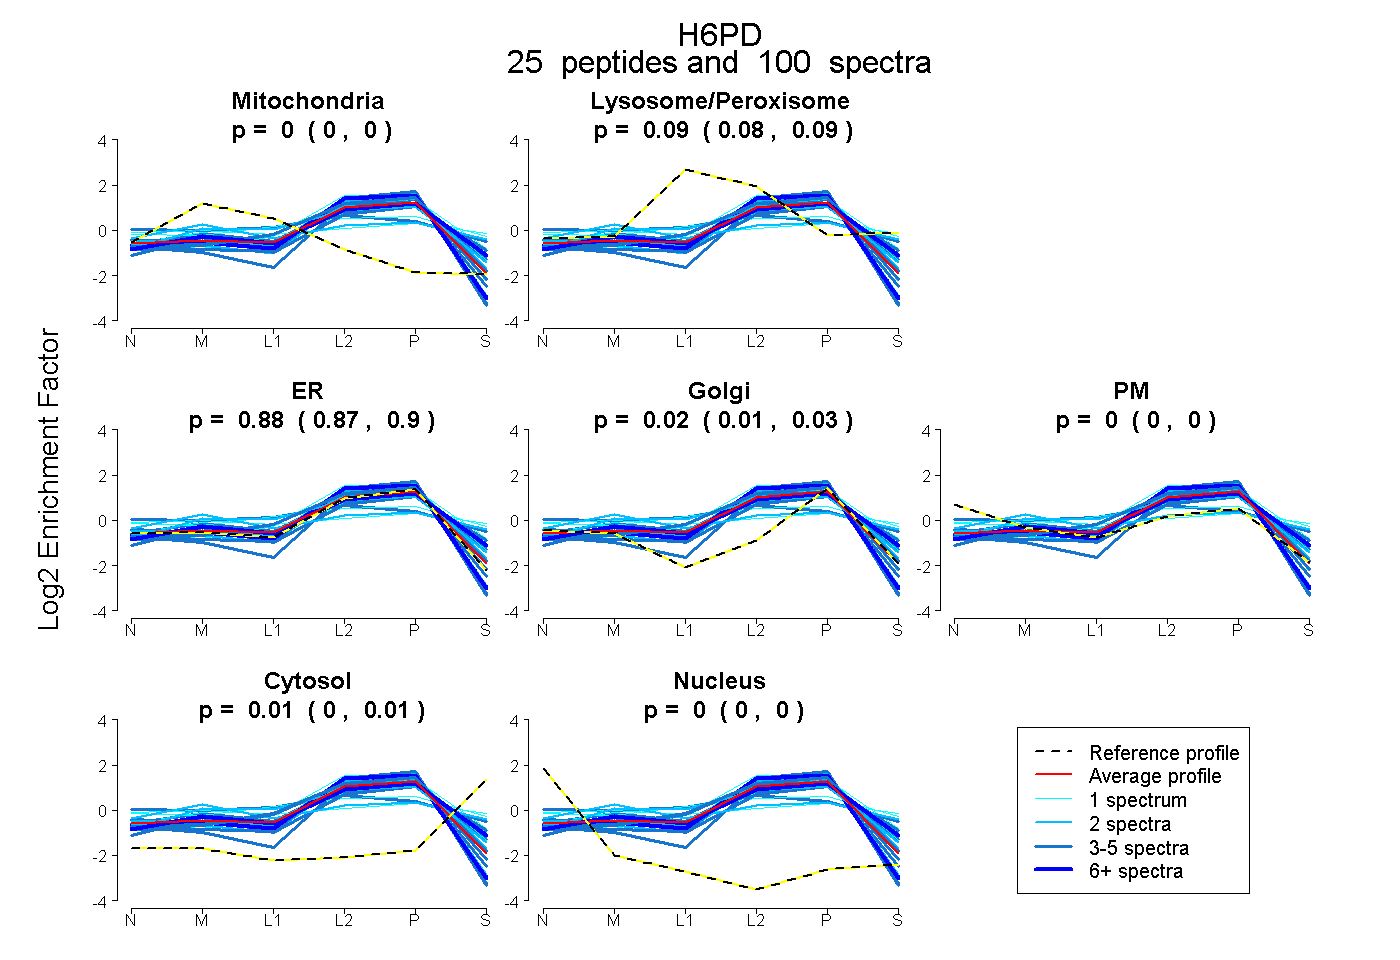
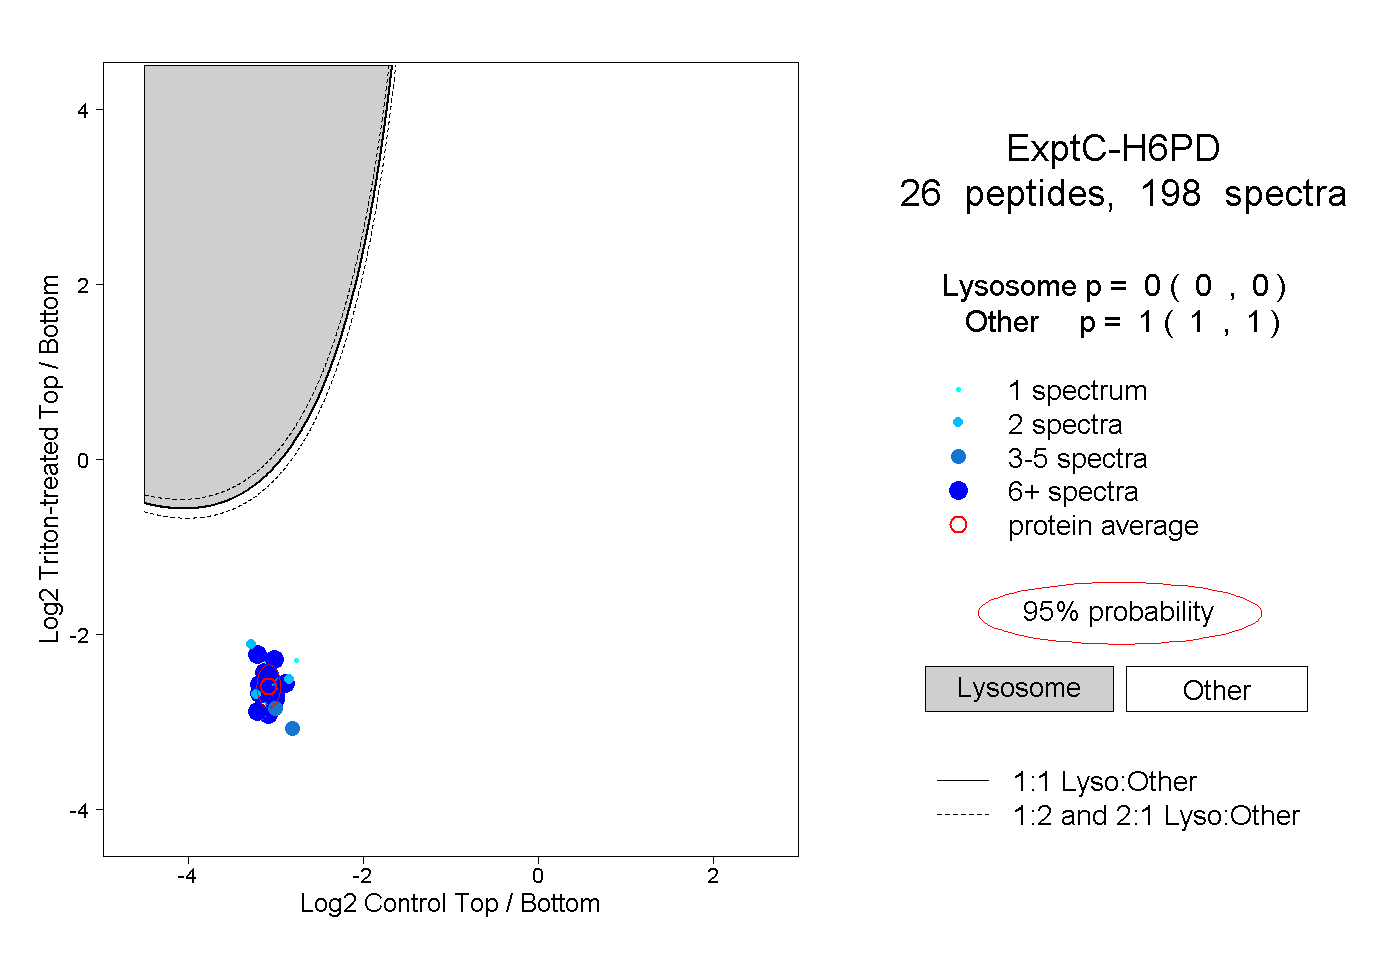
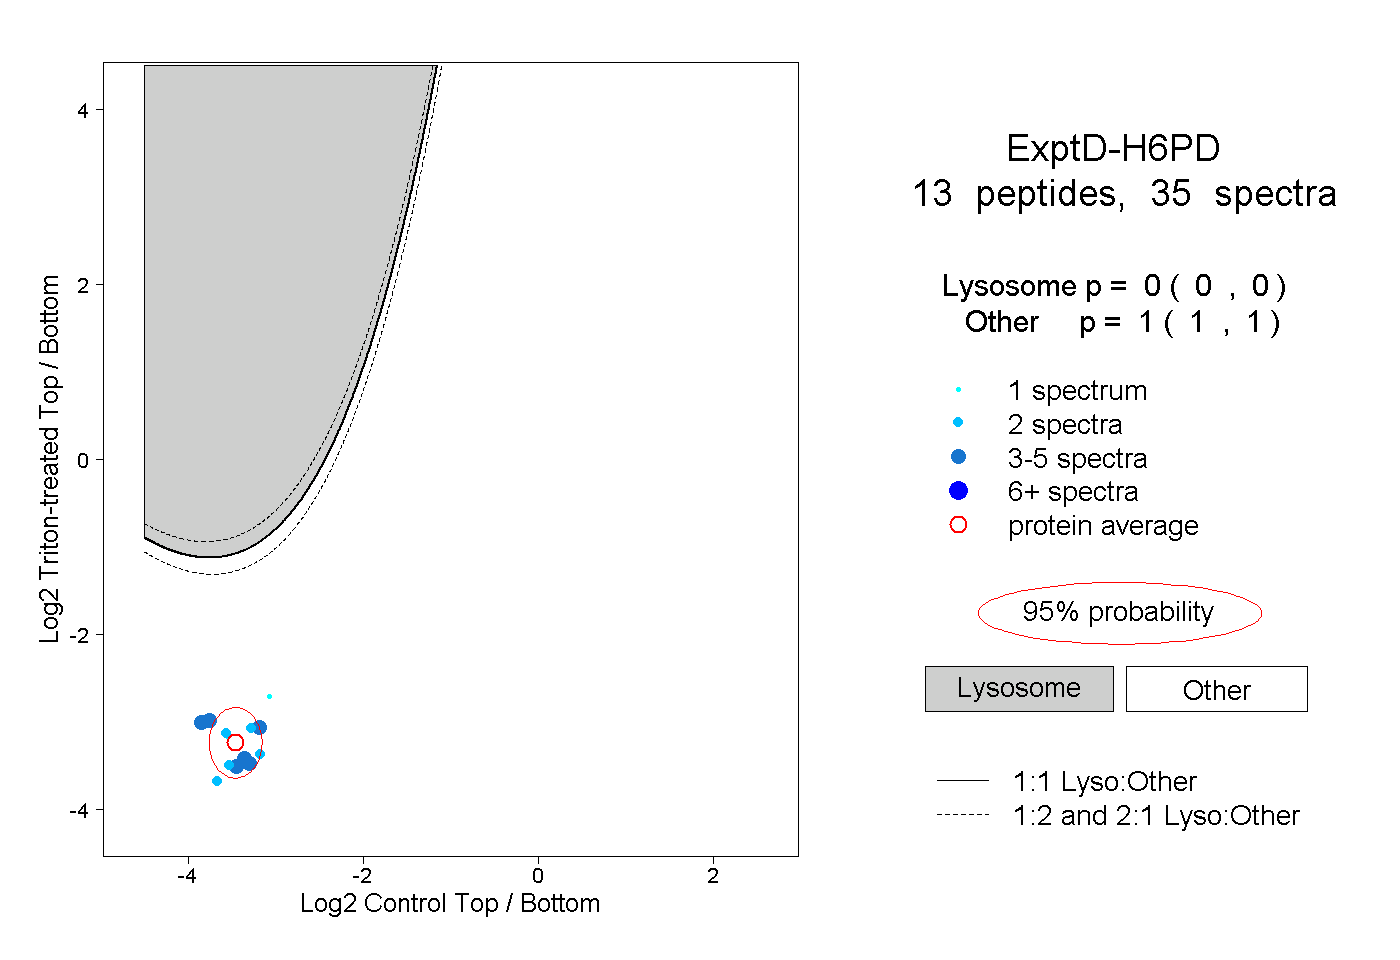
 26
26