 7
7peptides
spectra
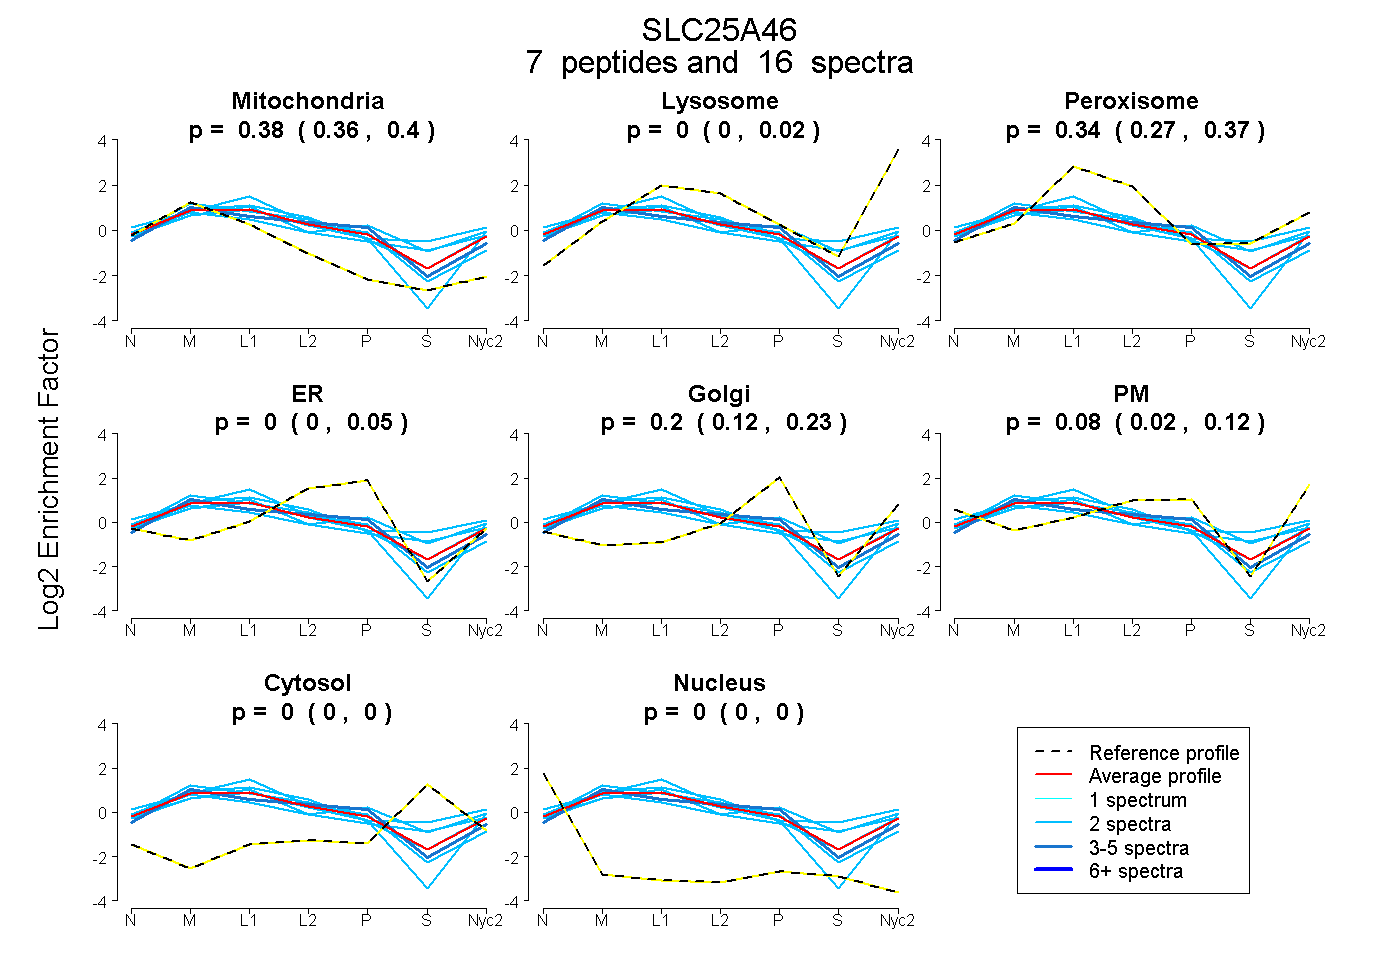
0.365 | 0.400
0.000 | 0.021
0.267 | 0.373
0.000 | 0.051
0.122 | 0.233
0.016 | 0.123
0.000 | 0.000
0.000 | 0.000
4peptides
spectra
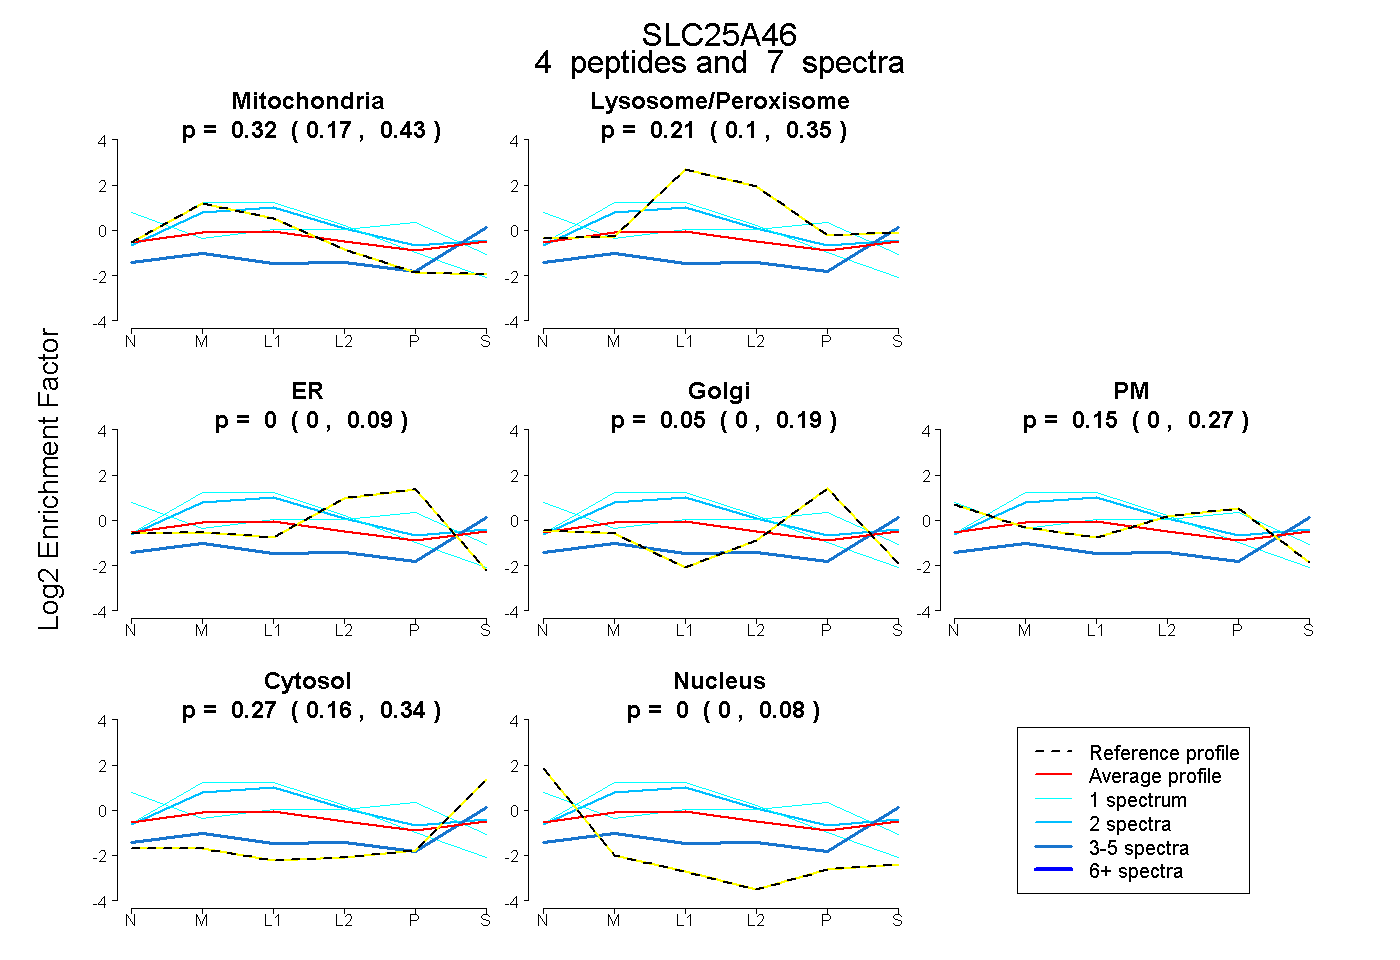
0.168 | 0.433
0.097 | 0.347
0.000 | 0.088
0.000 | 0.189
0.000 | 0.271
0.157 | 0.342
0.000 | 0.083
7peptides
spectra
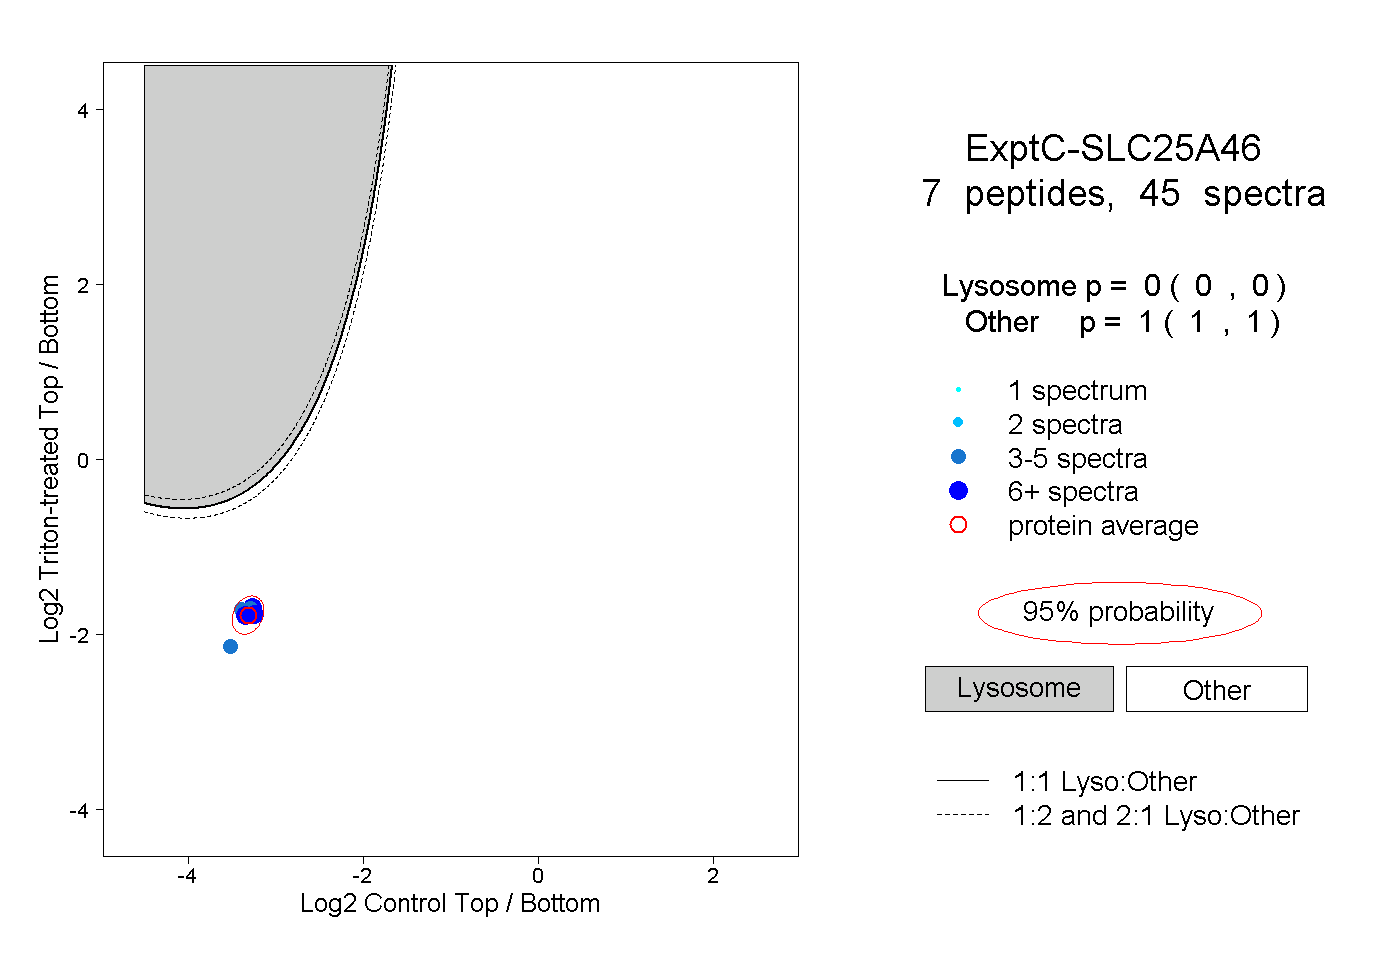
0.000 | 0.000
1.000 | 1.000
4peptides
spectra
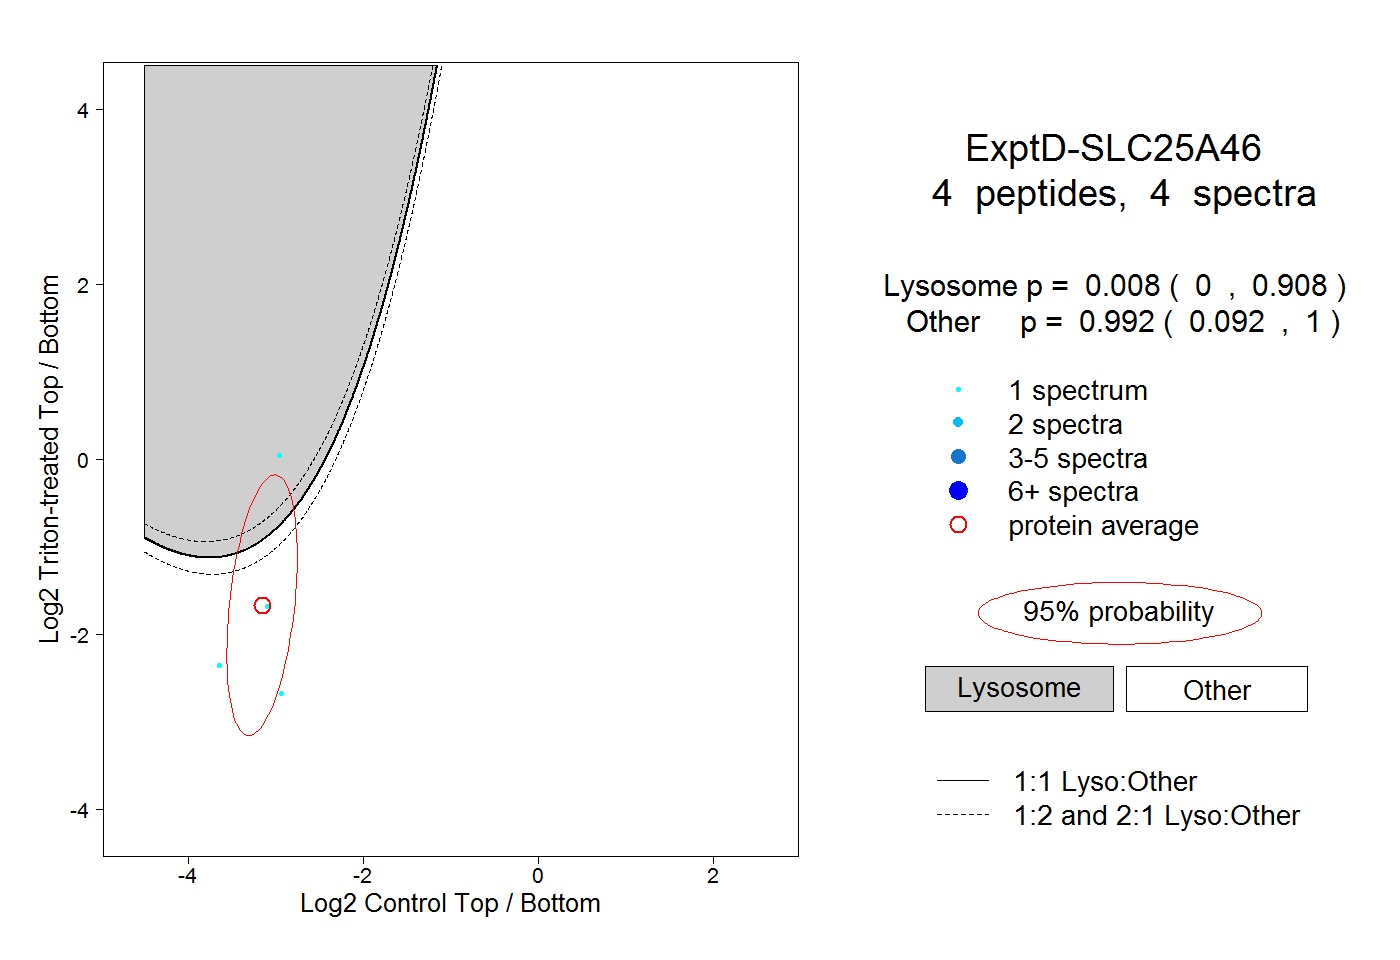
0.000 | 0.908
0.092 | 1.000