SLC25A46
[ENSRNOP00000023032]
Main page
| | | Plot |
Mito |
Lyso |
|
Perox |
ER |
Golgi |
PM |
Cytosol |
Nucleus |
|
| Expt A |
 7
7
peptides |
16
spectra |
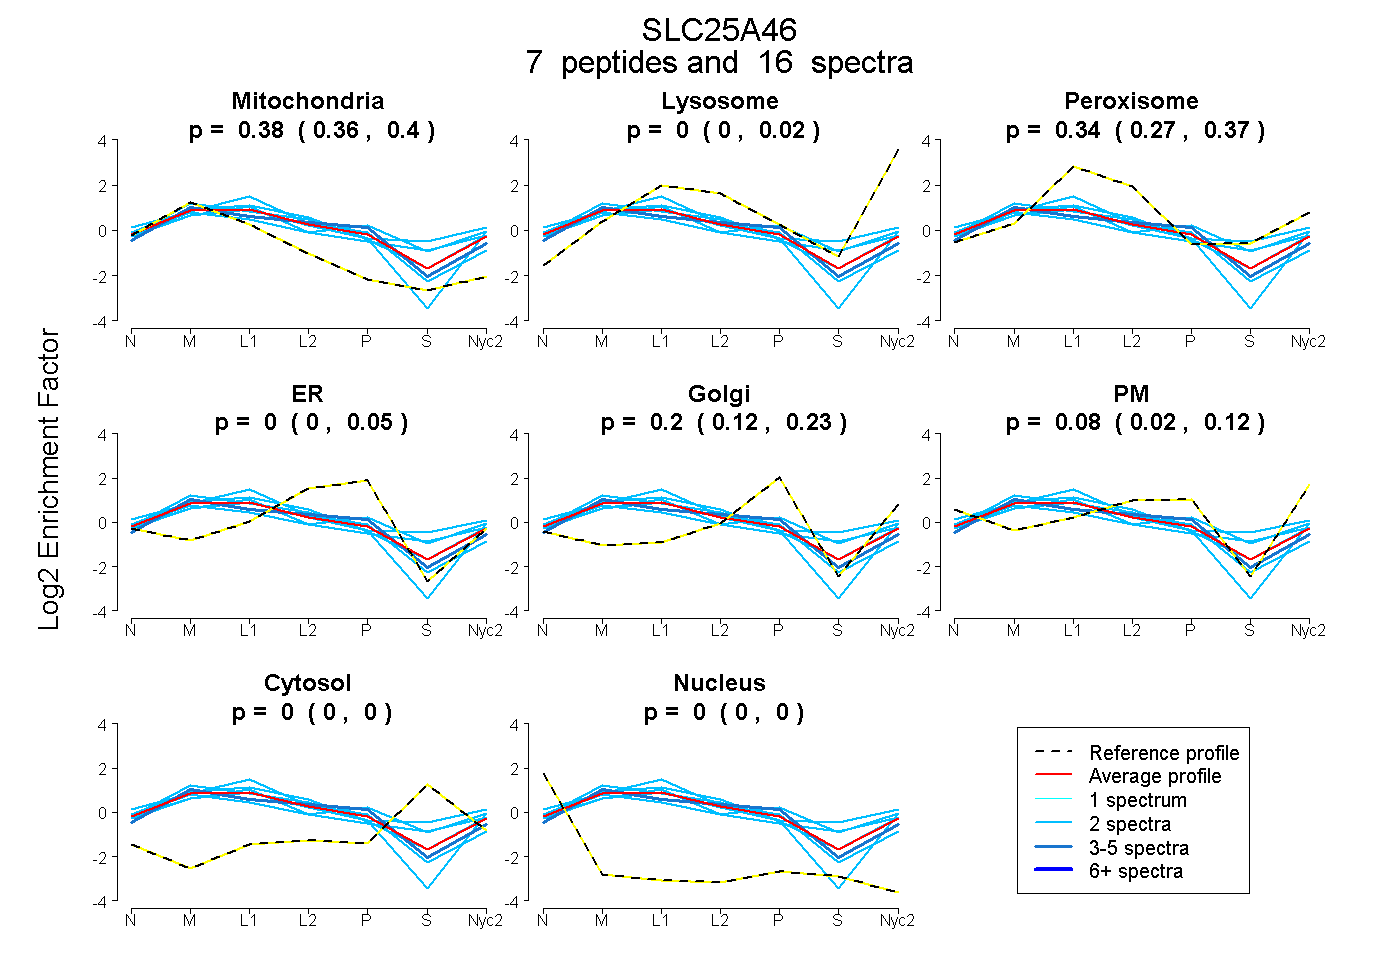 |
0.381
0.365 | 0.400 |
0.000
0.000 | 0.021 |
|
0.340
0.267 | 0.373 |
0.000
0.000 | 0.051 |
0.200
0.122 | 0.233 |
0.079
0.016 | 0.123 |
0.000
0.000 | 0.000 |
0.000
0.000 | 0.000 |
|
| | | Plot |
Mito |
|
Lyso or Perox |
|
ER |
Golgi |
PM |
Cytosol |
Nucleus |
|
| Expt B |
4
peptides |
7
spectra |
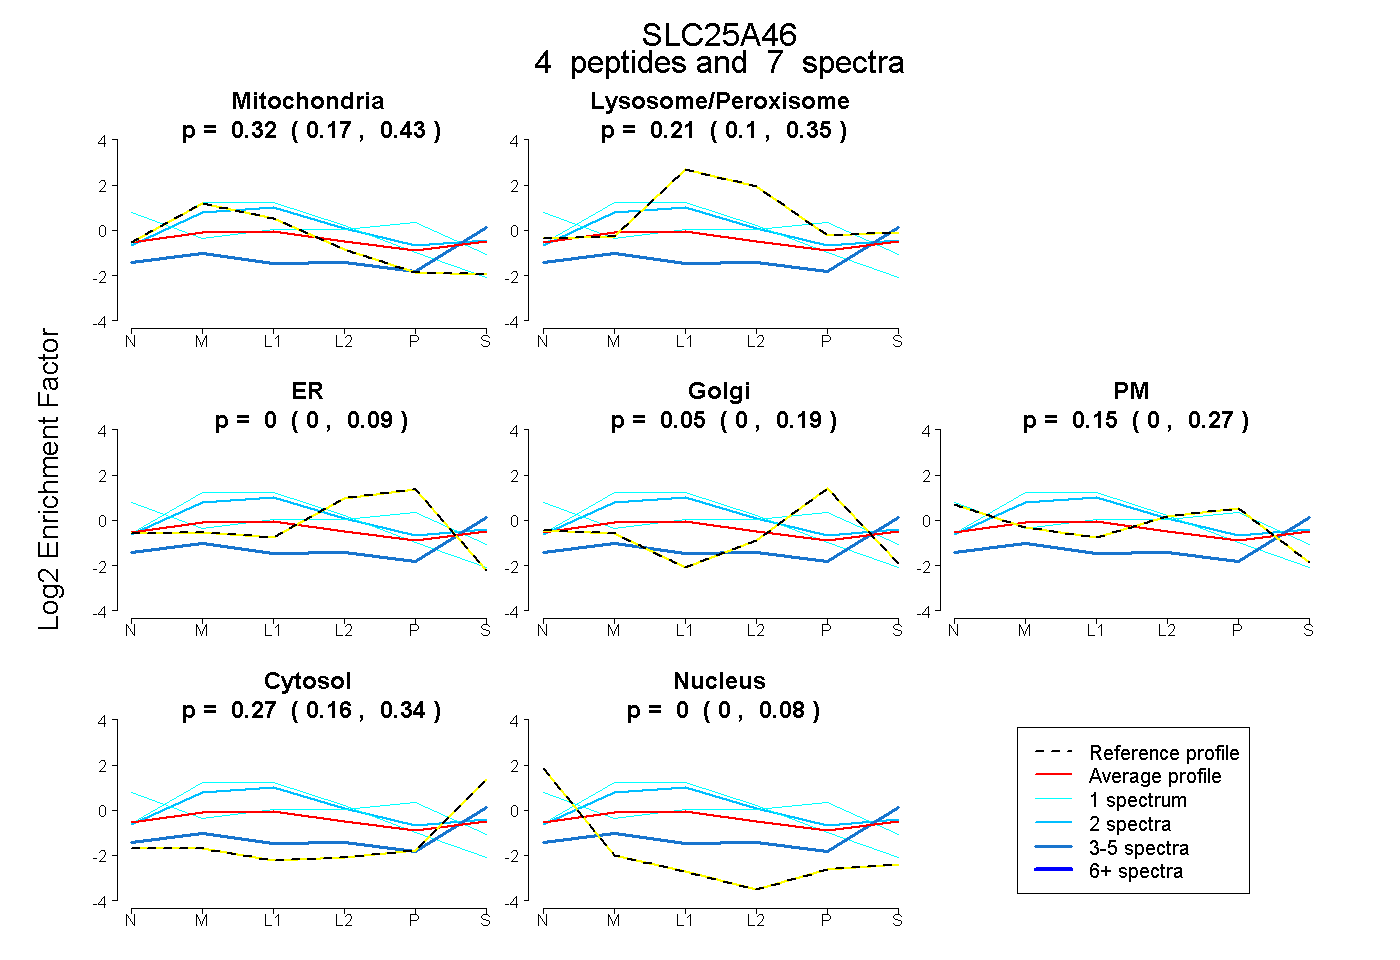 |
0.320
0.168 | 0.433 |
|
0.215
0.097 | 0.347 |
|
0.000
0.000 | 0.088 |
0.048
0.000 | 0.189 |
0.146
0.000 | 0.271 |
0.272
0.157 | 0.342 |
0.000
0.000 | 0.083 |
|
| 3 spectra, VIGLGVPHSK |
0.256 |
|
0.002 |
|
0.058 |
0.000 |
0.000 |
0.670 |
0.014 |
|
| 1 spectrum, QIGEHLLLK |
0.680 |
|
0.226 |
|
0.093 |
0.000 |
0.000 |
0.000 |
0.000 |
|
| 2 spectra, LHIQGTR |
0.429 |
|
0.415 |
|
0.000 |
0.057 |
0.000 |
0.100 |
0.000 |
|
| 1 spectrum, QCQVNYHAR |
0.000 |
|
0.239 |
|
0.000 |
0.000 |
0.675 |
0.028 |
0.058 |
|
| | | Plot |
|
Lyso |
|
|
|
|
|
|
|
Other |
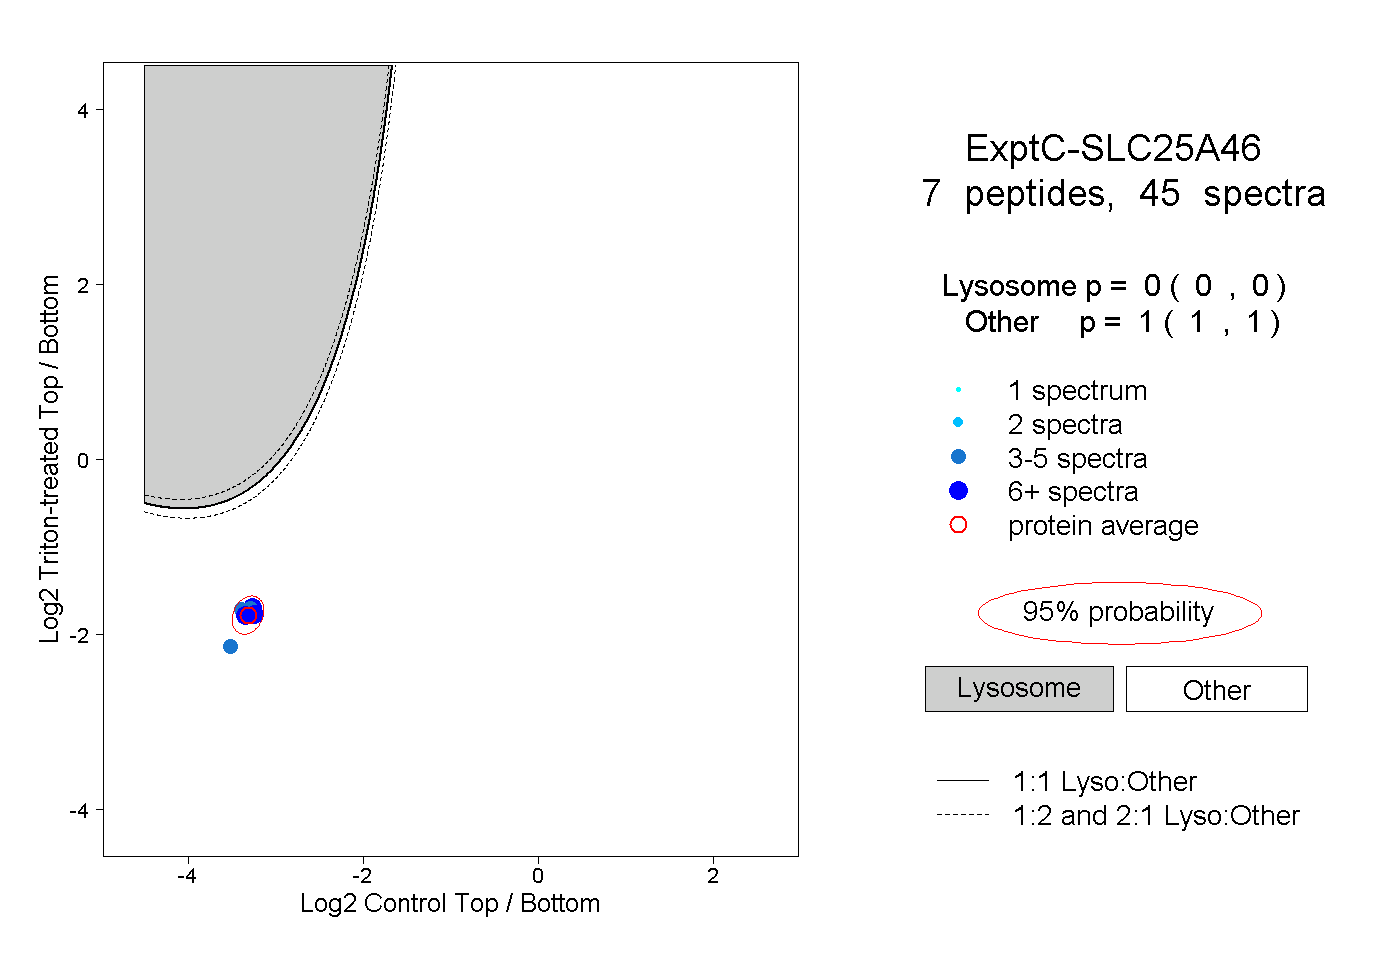
| Expt C |
7
peptides |
45
spectra |
 |
|
0.000
0.000 | 0.000 |
|
|
|
|
|
|
|
1.000
1.000 | 1.000 |
| | | Plot |
|
Lyso |
|
|
|
|
|
|
|
Other |
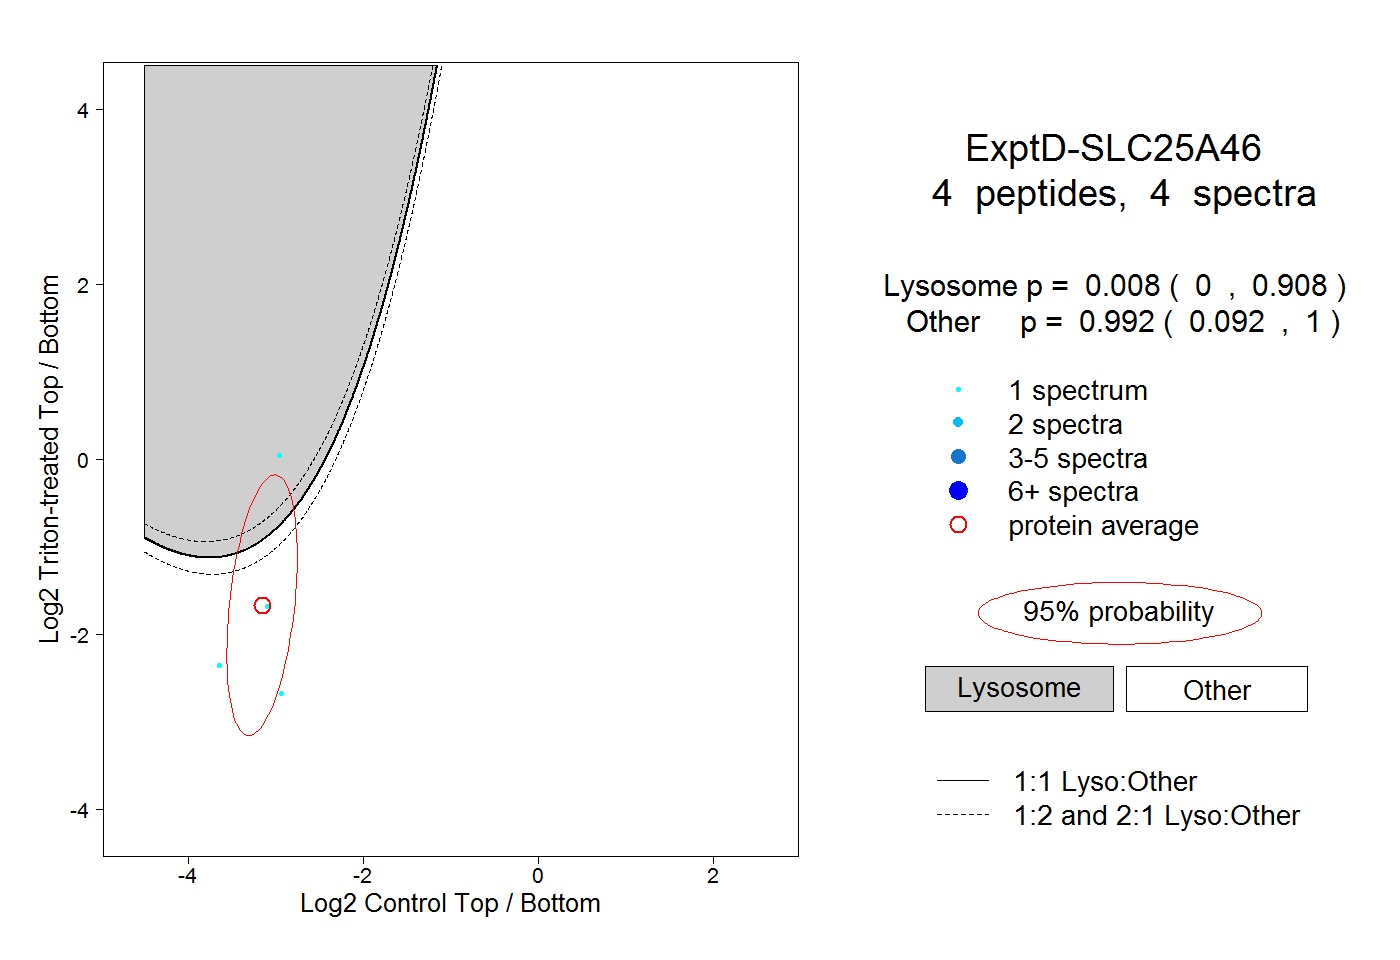
| Expt D |
4
peptides |
4
spectra |
 |
|
0.008
0.000 | 0.908 |
|
|
|
|
|
|
|
0.992
0.092 | 1.000 |