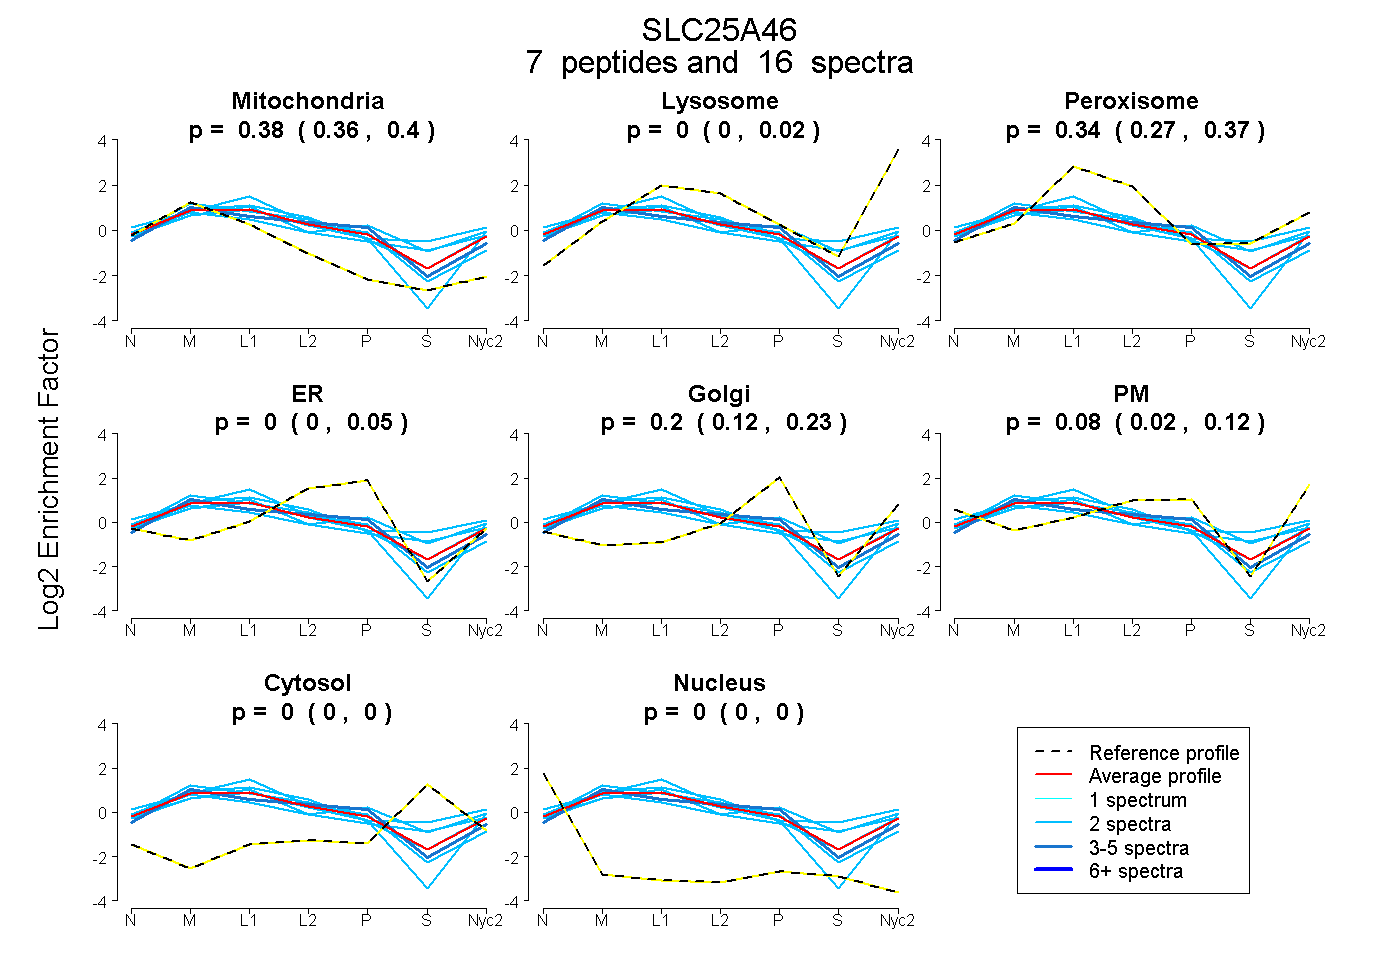
 7
7peptides
spectra
0.365 | 0.400
0.000 | 0.021
0.267 | 0.373
0.000 | 0.051
0.122 | 0.233
0.016 | 0.123
0.000 | 0.000
0.000 | 0.000
| Plot | Mito | Lyso | Perox | ER | Golgi | PM | Cytosol | Nucleus | |||||
| Expt A |
7 peptides |
16 spectra |
|
0.381 0.365 | 0.400 |
0.000 0.000 | 0.021 |
0.340 0.267 | 0.373 |
0.000 0.000 | 0.051 |
0.200 0.122 | 0.233 |
0.079 0.016 | 0.123 |
0.000 0.000 | 0.000 |
0.000 0.000 | 0.000 |
| 4 spectra, VIGLGVPHSK | 0.446 | 0.142 | 0.063 | 0.349 | 0.000 | 0.000 | 0.000 | 0.000 | ||
| 2 spectra, QIGEHLLLK | 0.375 | 0.000 | 0.363 | 0.065 | 0.000 | 0.197 | 0.000 | 0.000 | ||
| 2 spectra, NLHWGEK | 0.432 | 0.000 | 0.279 | 0.270 | 0.000 | 0.020 | 0.000 | 0.000 | ||
| 2 spectra, LHIQGTR | 0.489 | 0.136 | 0.000 | 0.117 | 0.000 | 0.257 | 0.000 | 0.000 | ||
| 2 spectra, DCVNTIK | 0.240 | 0.062 | 0.411 | 0.000 | 0.099 | 0.038 | 0.149 | 0.000 | ||
| 2 spectra, QCQVNYHAR | 0.257 | 0.000 | 0.410 | 0.000 | 0.285 | 0.000 | 0.048 | 0.000 | ||
| 2 spectra, QEEGVFGFYK | 0.369 | 0.046 | 0.242 | 0.000 | 0.059 | 0.141 | 0.143 | 0.000 |
| Plot | Mito | Lyso or Perox | ER | Golgi | PM | Cytosol | Nucleus | ||||||
| Expt B |
4 peptides |
7 spectra |
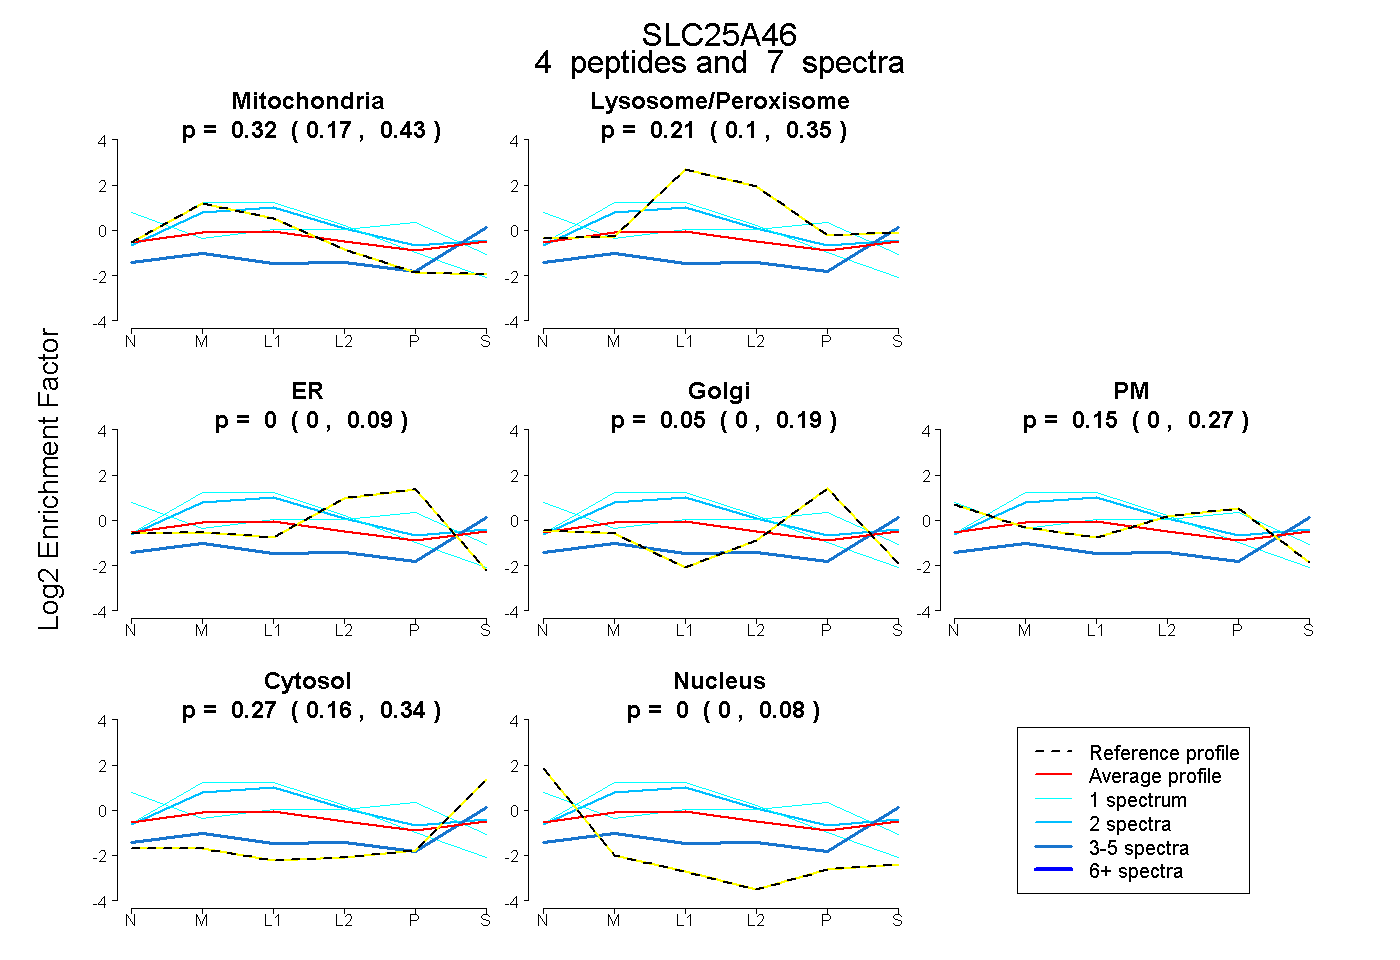 |
0.320 0.168 | 0.433 |
0.215 0.097 | 0.347 |
0.000 0.000 | 0.088 |
0.048 0.000 | 0.189 |
0.146 0.000 | 0.271 |
0.272 0.157 | 0.342 |
0.000 0.000 | 0.083 |
|||
| Plot | Lyso | Other | |||||||||||
| Expt C |
7 peptides |
45 spectra |
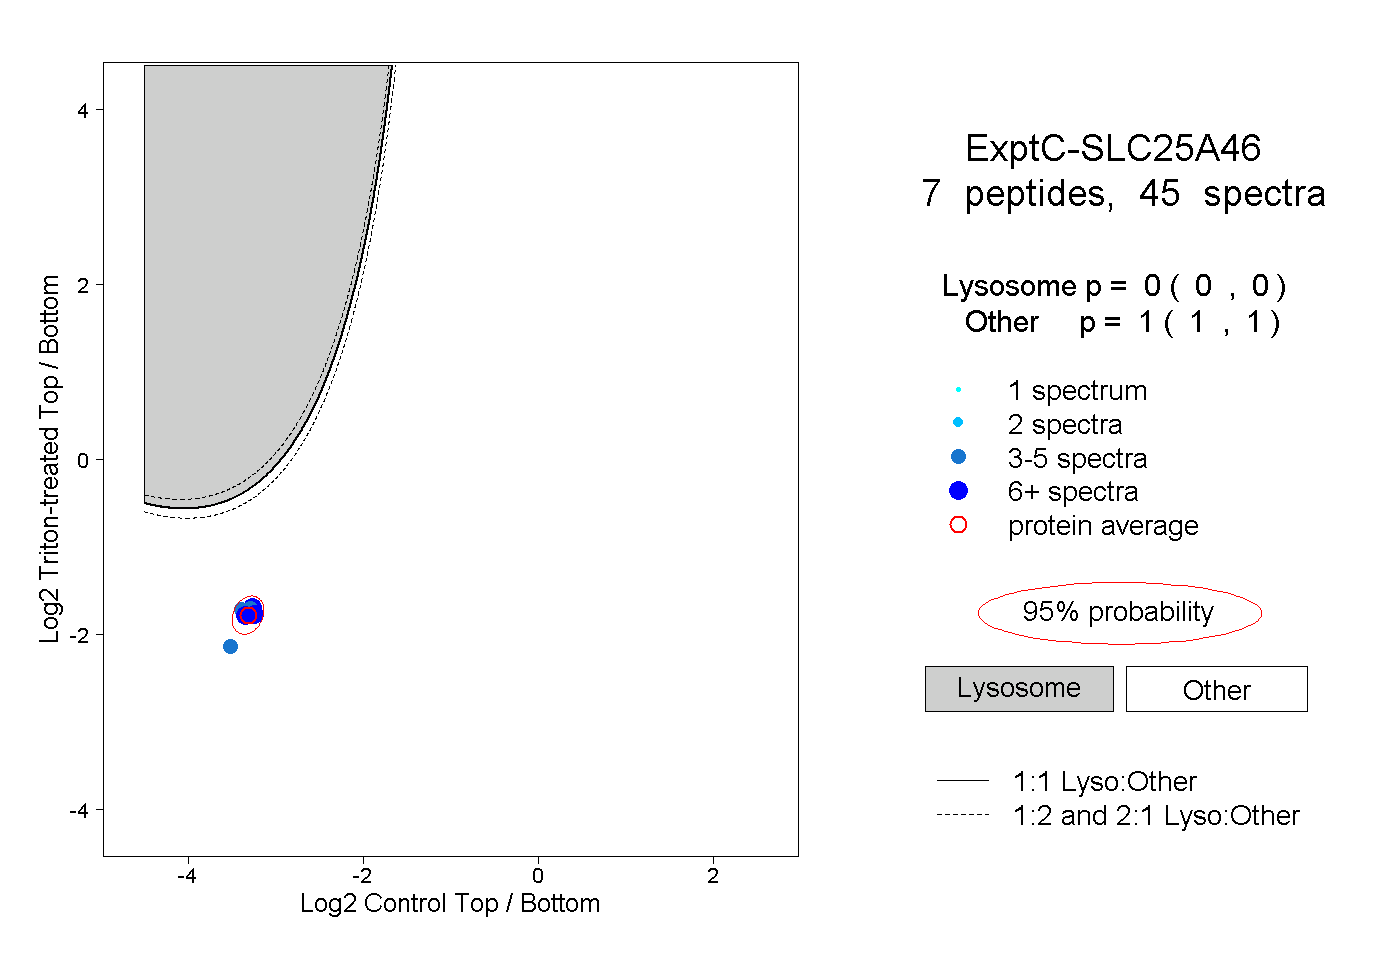 |
0.000 0.000 | 0.000 |
1.000 1.000 | 1.000 |
||||||||
| Plot | Lyso | Other | |||||||||||
| Expt D |
4 peptides |
4 spectra |
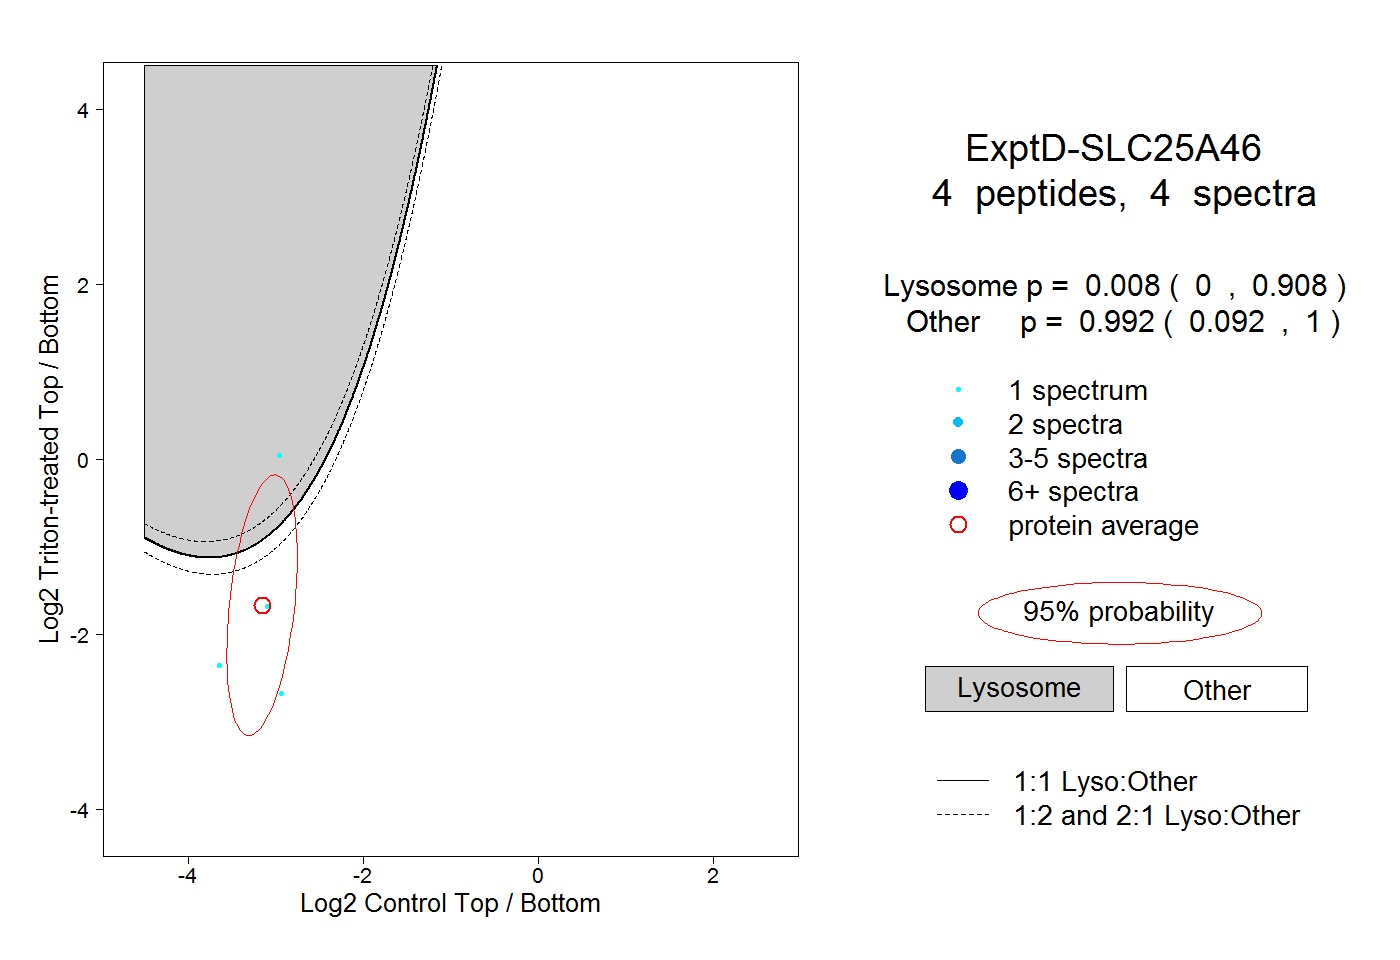 |
0.008 0.000 | 0.908 |
0.992 0.092 | 1.000 |