 7
7peptides
spectra
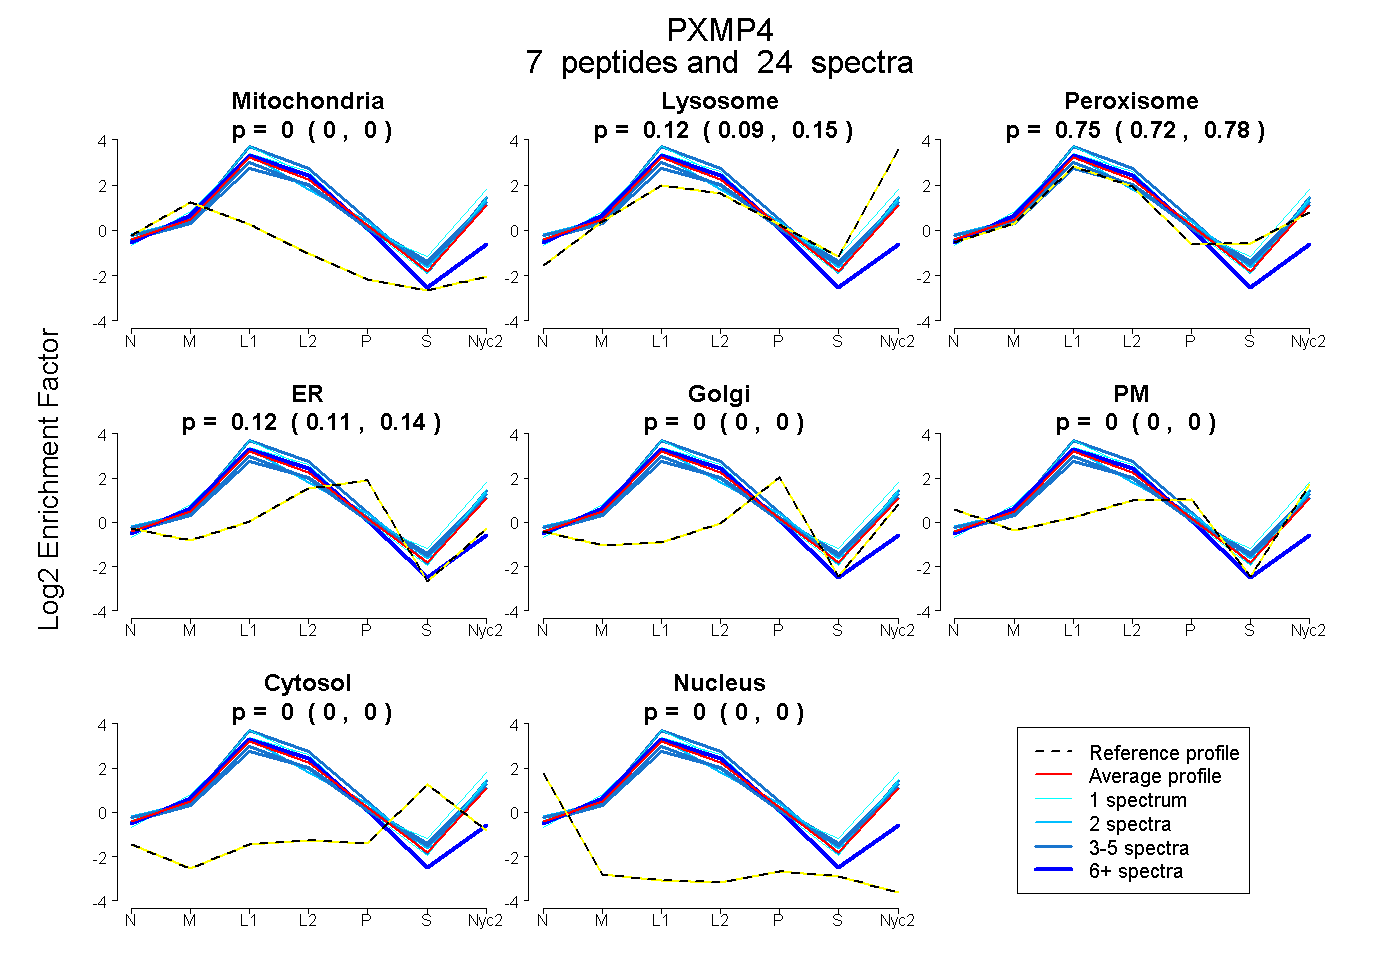
0.000 | 0.000
0.088 | 0.155
0.720 | 0.781
0.106 | 0.136
0.000 | 0.000
0.000 | 0.000
0.000 | 0.000
0.000 | 0.000
6peptides
spectra
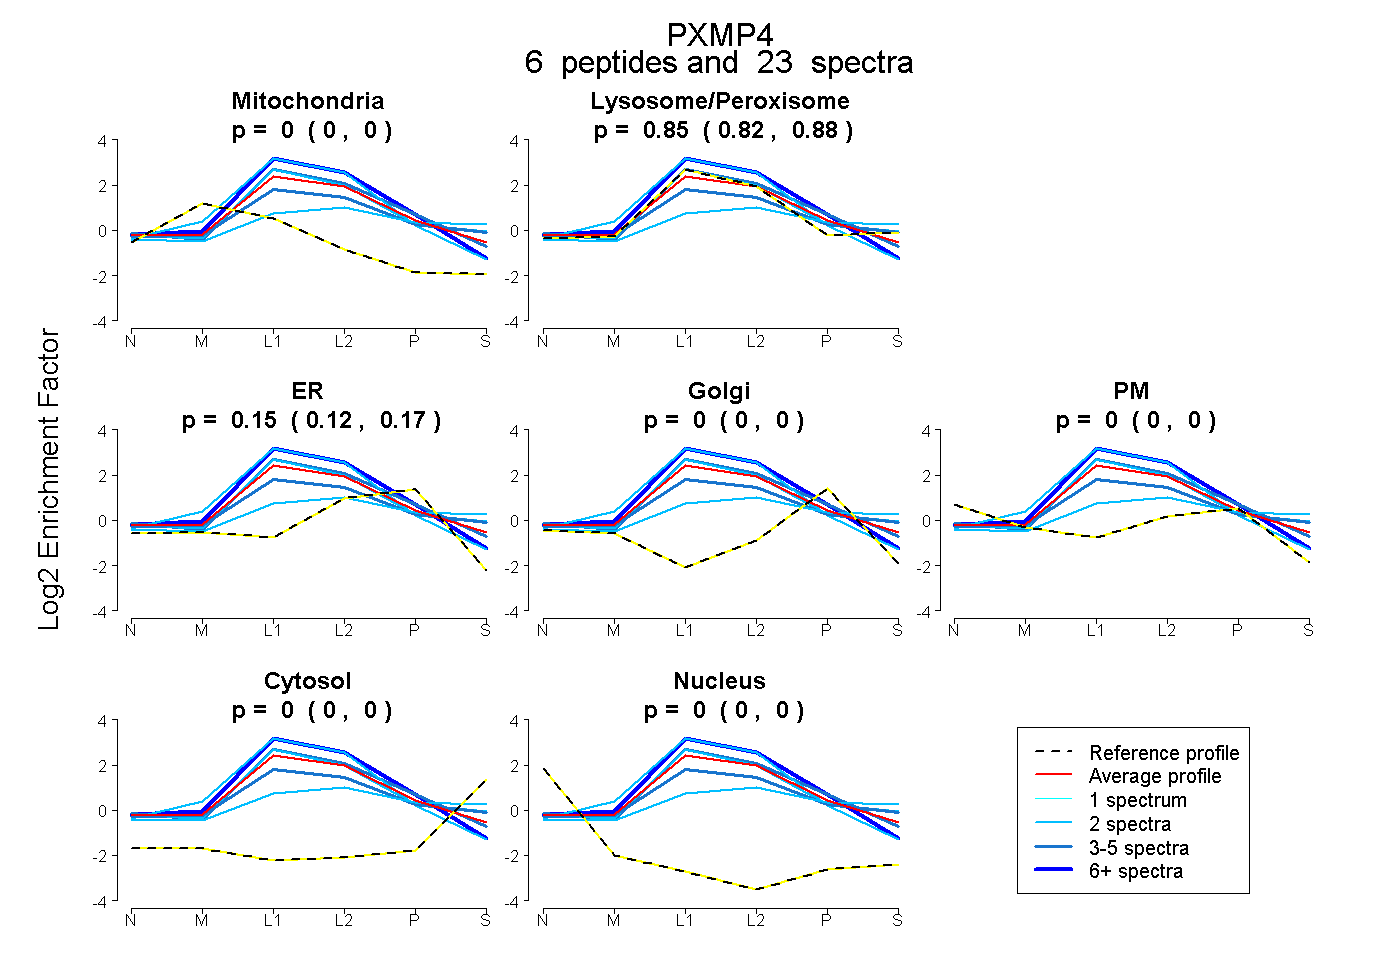
0.000 | 0.000
0.822 | 0.877
0.118 | 0.173
0.000 | 0.000
0.000 | 0.000
0.000 | 0.000
0.000 | 0.000
12peptides
spectra
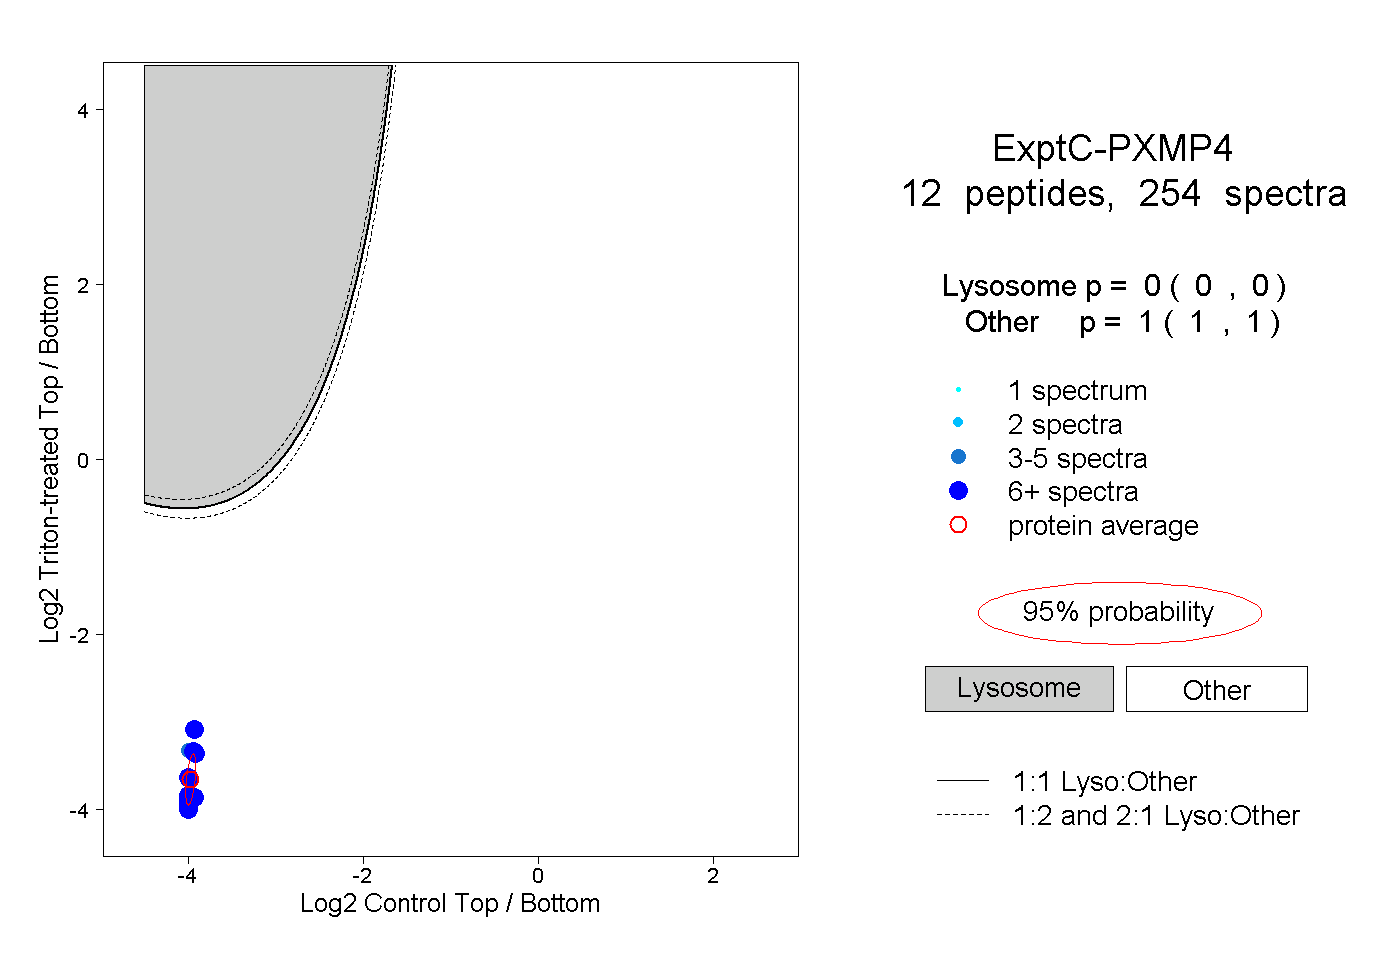
0.000 | 0.000
1.000 | 1.000
6peptides
spectra
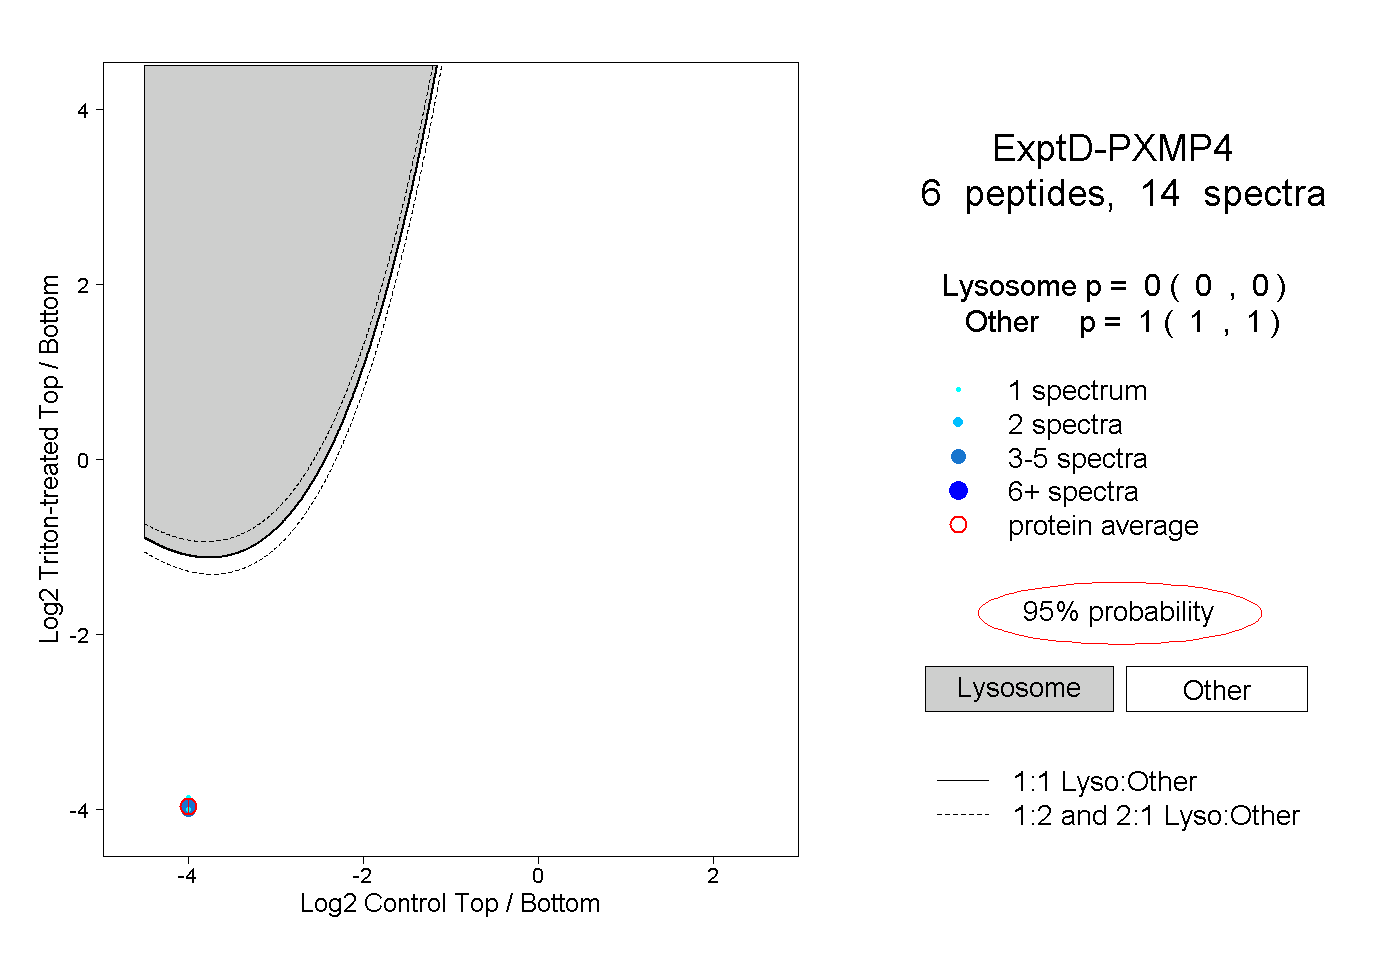
0.000 | 0.000
1.000 | 1.000