PXMP4
[ENSRNOP00000022914]
Main page
| | | Plot |
Mito |
Lyso |
|
Perox |
ER |
Golgi |
PM |
Cytosol |
Nucleus |
|
| Expt A |
 7
7
peptides |
24
spectra |
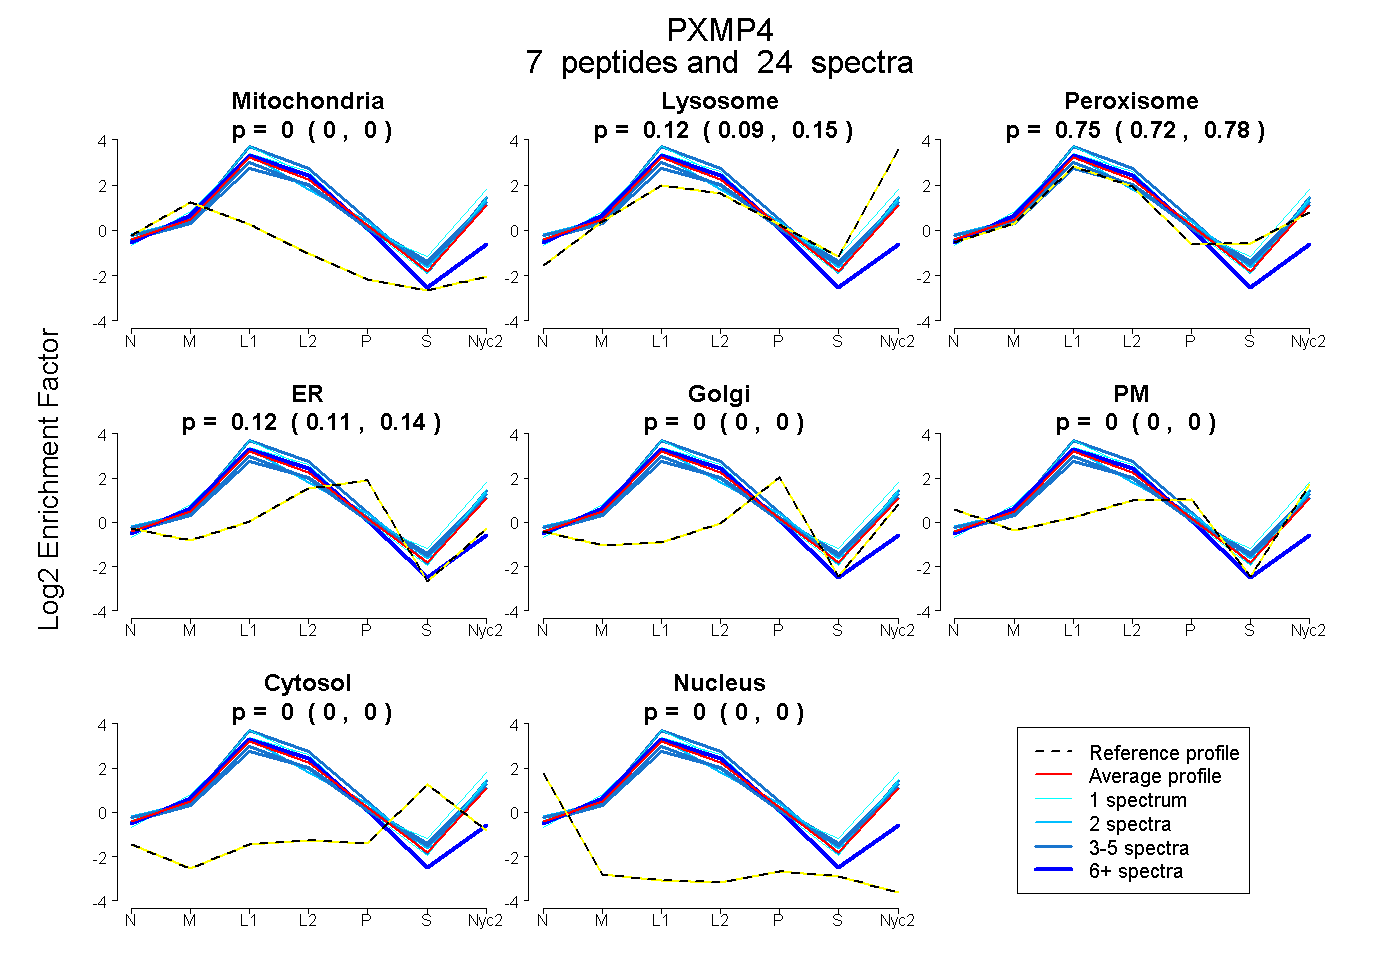 |
0.000
0.000 | 0.000 |
0.124
0.088 | 0.155 |
|
0.754
0.720 | 0.781 |
0.122
0.106 | 0.136 |
0.000
0.000 | 0.000 |
0.000
0.000 | 0.000 |
0.000
0.000 | 0.000 |
0.000
0.000 | 0.000 |
|
| | | Plot |
Mito |
|
Lyso or Perox |
|
ER |
Golgi |
PM |
Cytosol |
Nucleus |
|
| Expt B |
6
peptides |
23
spectra |
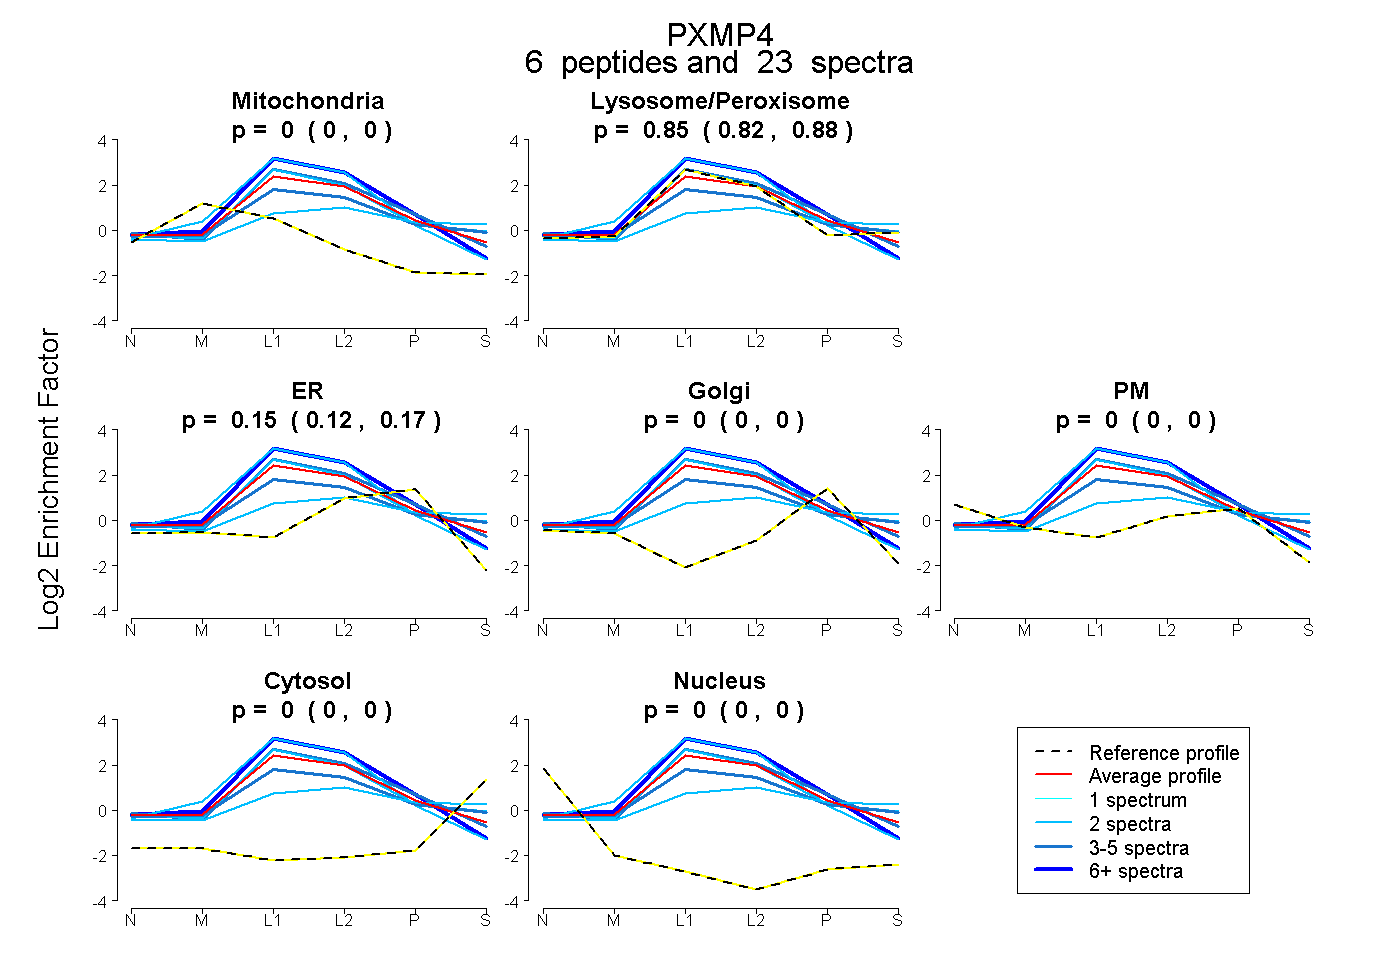 |
0.000
0.000 | 0.000 |
|
0.851
0.822 | 0.877 |
|
0.149
0.118 | 0.173 |
0.000
0.000 | 0.000 |
0.000
0.000 | 0.000 |
0.000
0.000 | 0.000 |
0.000
0.000 | 0.000 |
|
| | | Plot |
|
Lyso |
|
|
|
|
|
|
|
Other |
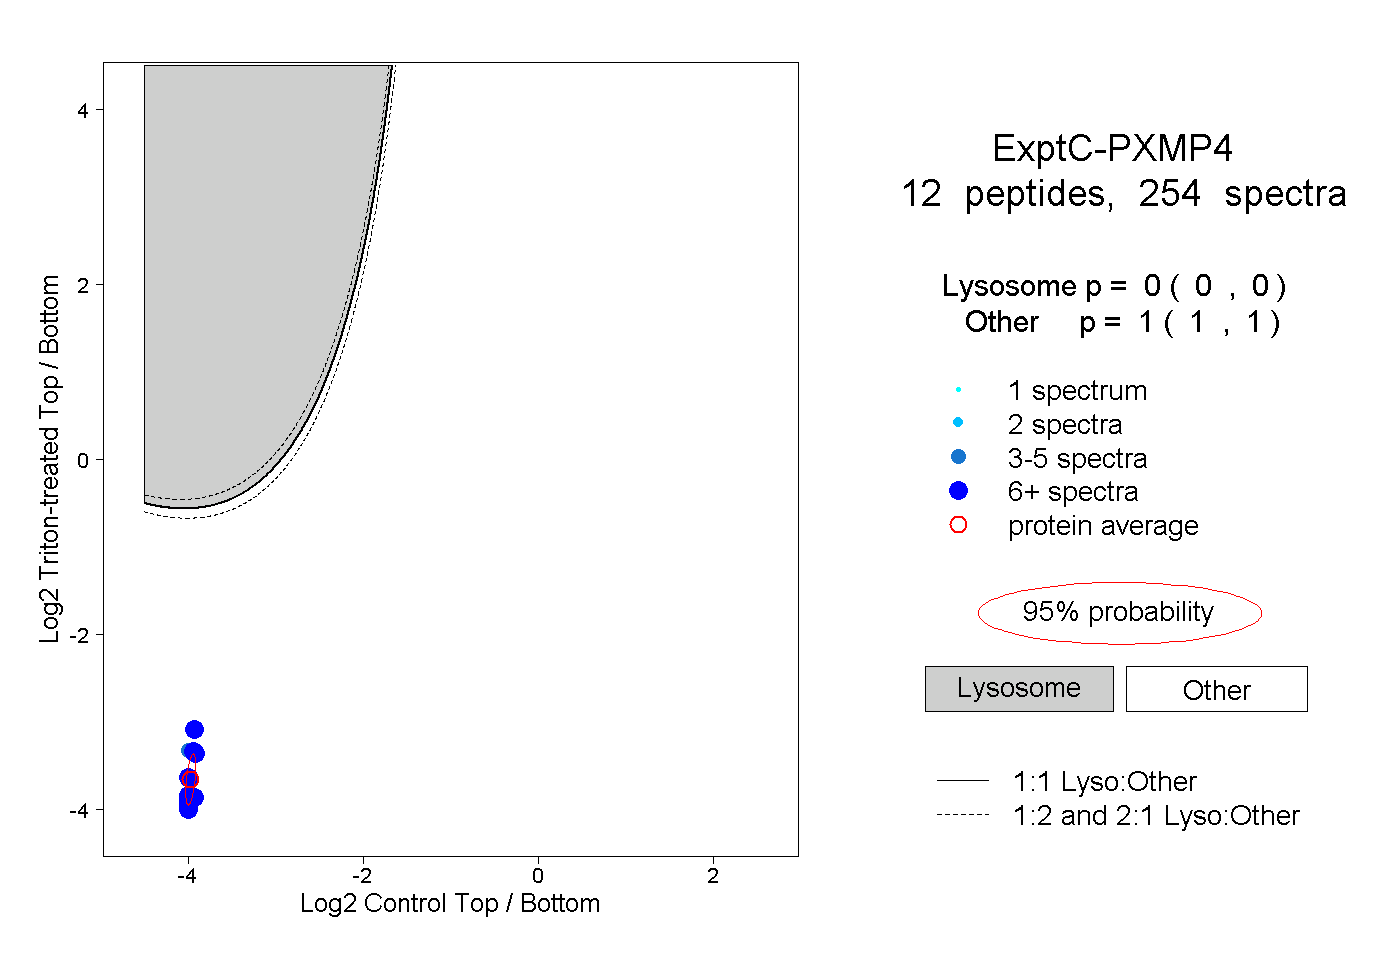
| Expt C |
12
peptides |
254
spectra |
 |
|
0.000
0.000 | 0.000 |
|
|
|
|
|
|
|
1.000
1.000 | 1.000 |
| 25 spectra, GYIPALK |
|
0.000 |
|
|
|
|
|
|
|
1.000 |
| 18 spectra, IQALLK |
|
0.000 |
|
|
|
|
|
|
|
1.000 |
| 41 spectra, ALLQAVNK |
|
0.000 |
|
|
|
|
|
|
|
1.000 |
| 12 spectra, NGAVYGVK |
|
0.000 |
|
|
|
|
|
|
|
1.000 |
| 1 spectrum, GSSLQEK |
|
0.000 |
|
|
|
|
|
|
|
1.000 |
| 21 spectra, VLFALCR |
|
0.000 |
|
|
|
|
|
|
|
1.000 |
| 16 spectra, YHAALAVIK |
|
0.000 |
|
|
|
|
|
|
|
1.000 |
| 47 spectra, SGSLQEK |
|
0.000 |
|
|
|
|
|
|
|
1.000 |
| 7 spectra, APHALVMTFLFR |
|
0.000 |
|
|
|
|
|
|
|
1.000 |
| 5 spectra, ATYTHSR |
|
0.000 |
|
|
|
|
|
|
|
1.000 |
| 7 spectra, NLACFVFTYK |
|
0.000 |
|
|
|
|
|
|
|
1.000 |
| 54 spectra, AAPPQLR |
|
0.000 |
|
|
|
|
|
|
|
1.000 |
| | | Plot |
|
Lyso |
|
|
|
|
|
|
|
Other |
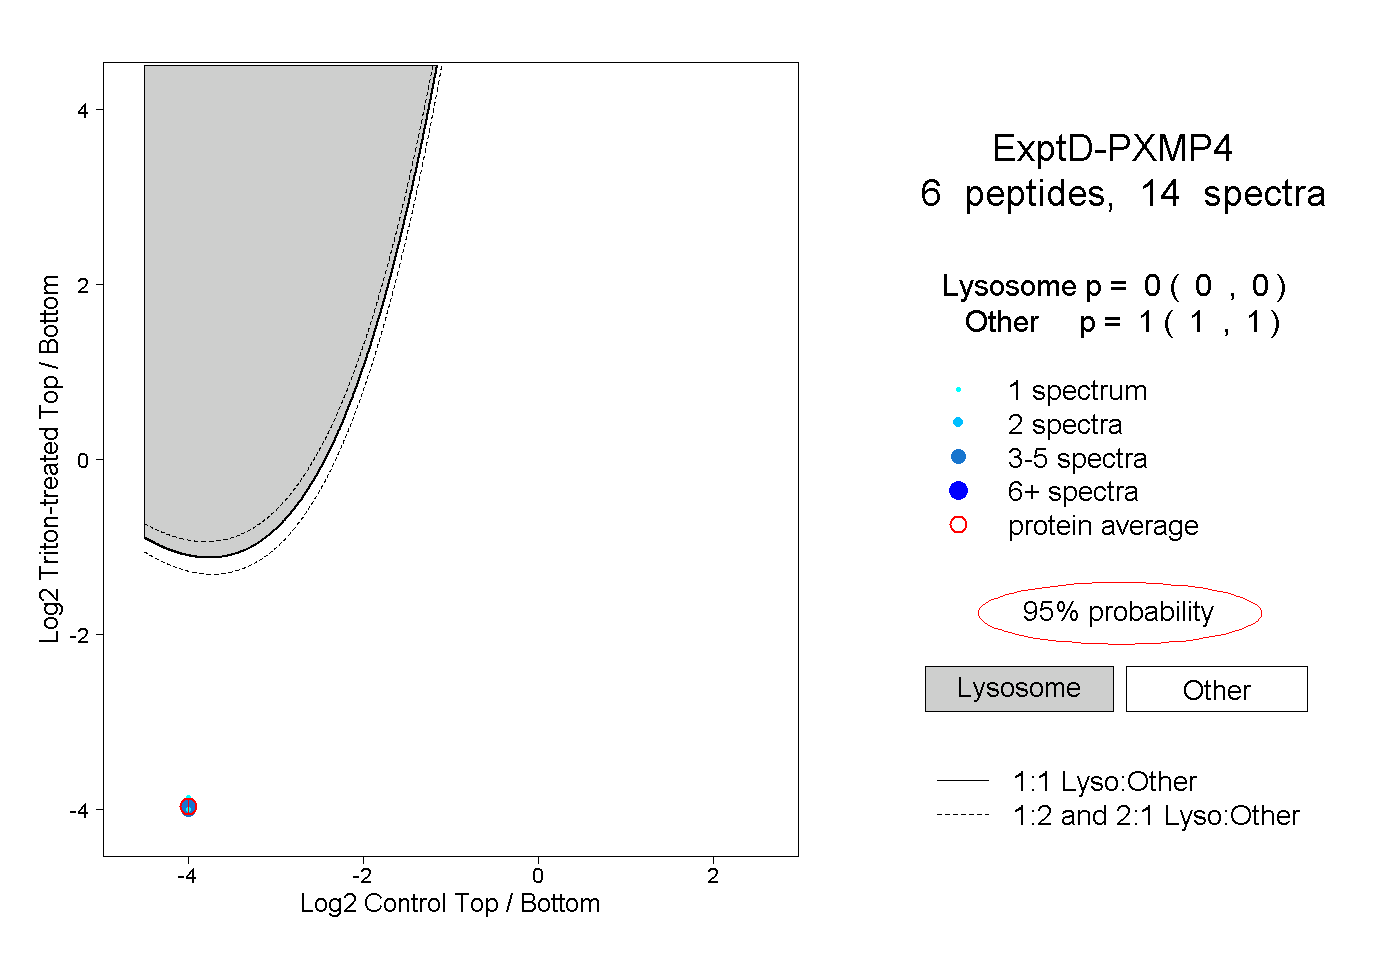
| Expt D |
6
peptides |
14
spectra |
 |
|
0.000
0.000 | 0.000 |
|
|
|
|
|
|
|
1.000
1.000 | 1.000 |