 10
10peptides
spectra
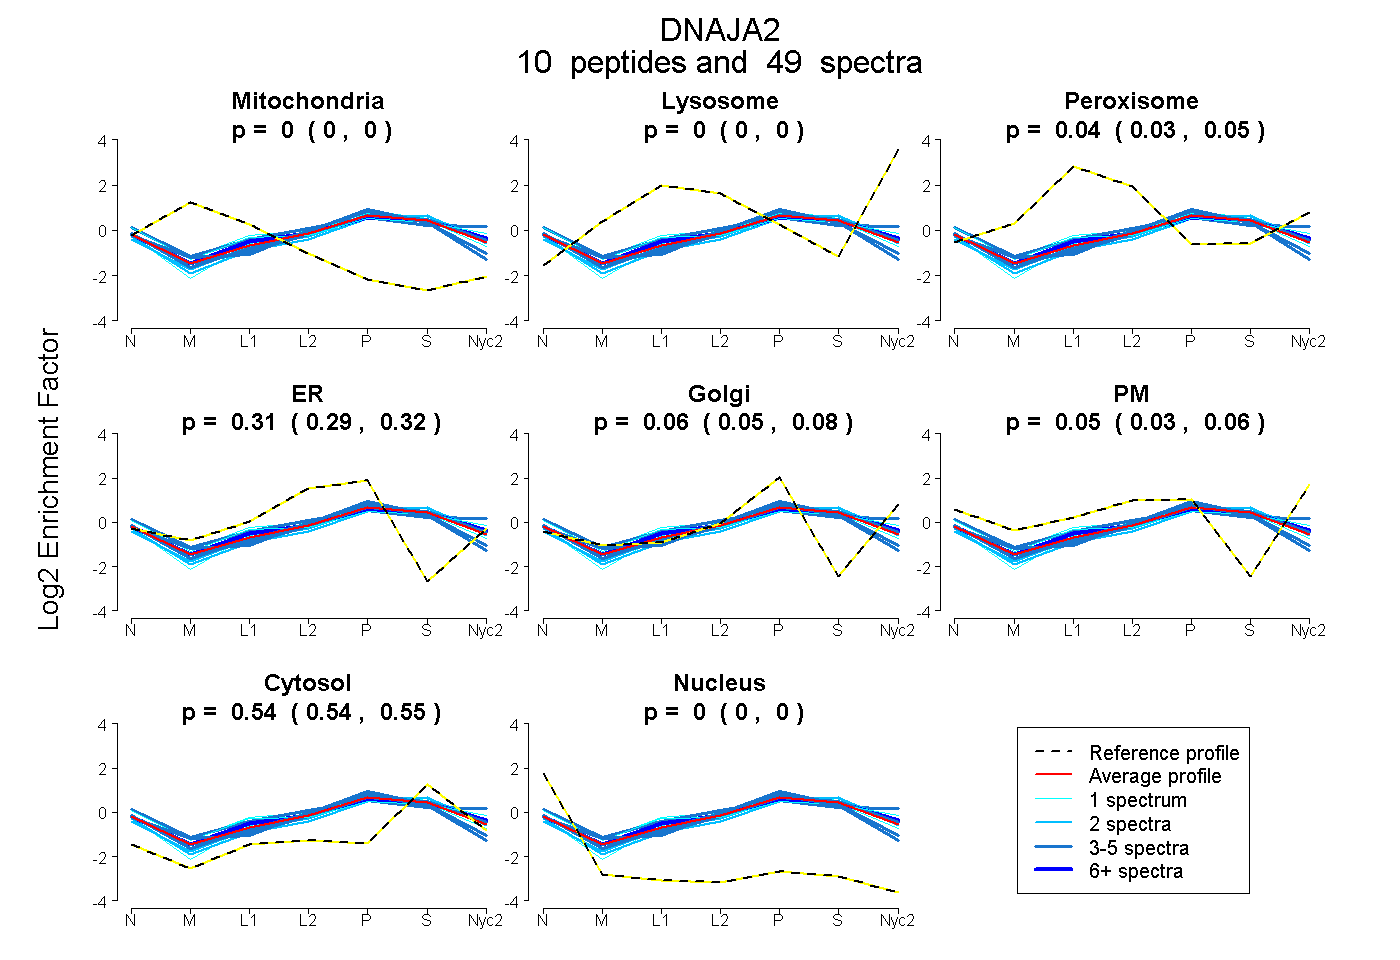
0.000 | 0.000
0.000 | 0.000
0.032 | 0.048
0.289 | 0.321
0.046 | 0.075
0.035 | 0.061
0.538 | 0.547
0.000 | 0.000
5peptides
spectra
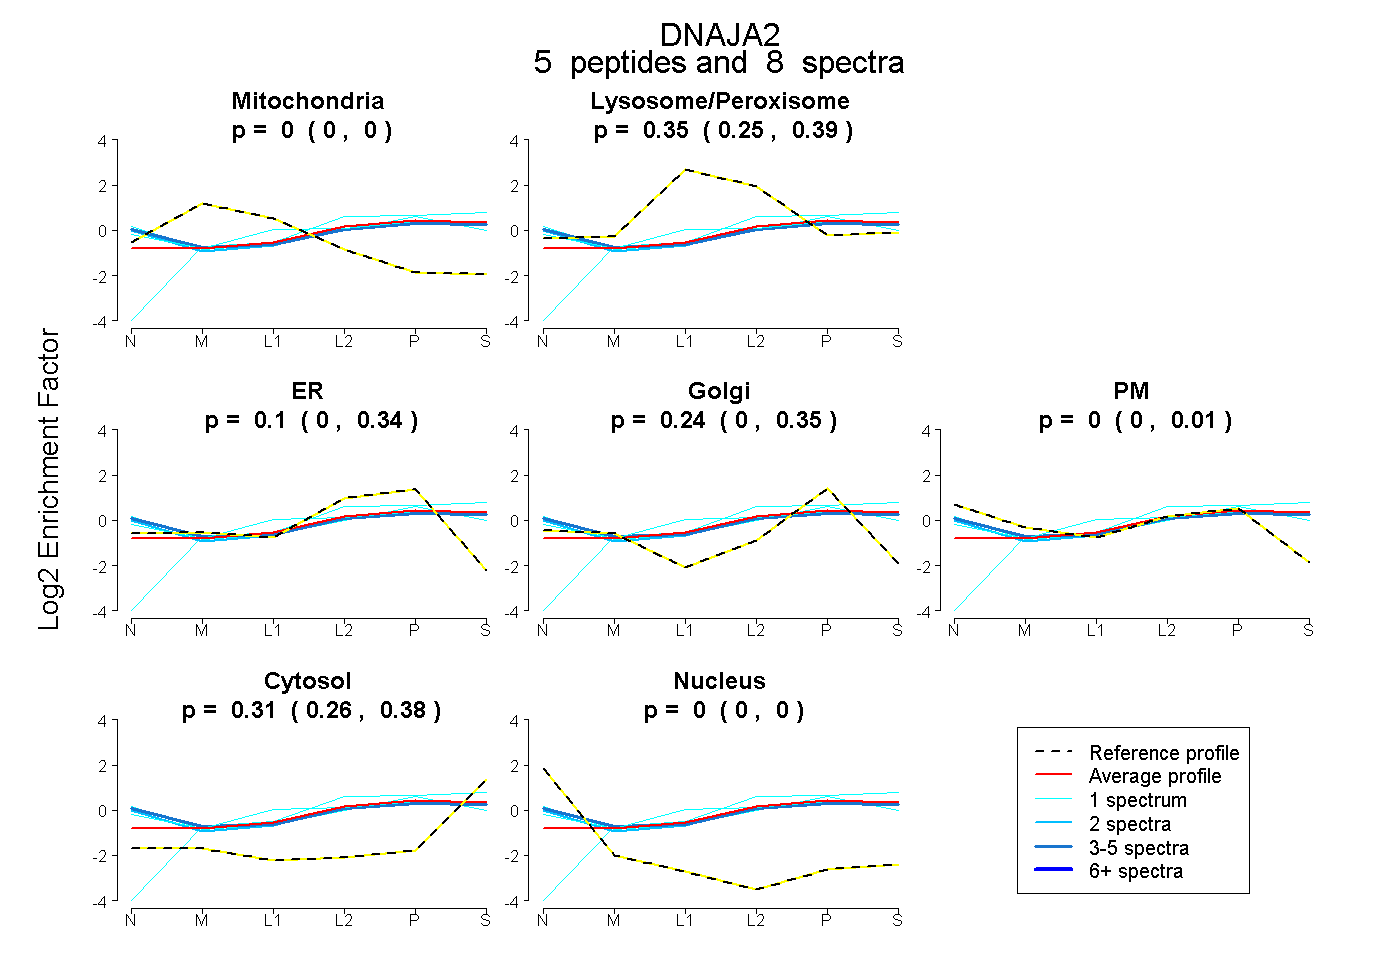
0.000 | 0.000
0.253 | 0.391
0.000 | 0.339
0.000 | 0.347
0.000 | 0.005
0.257 | 0.385
0.000 | 0.000
10peptides
spectra
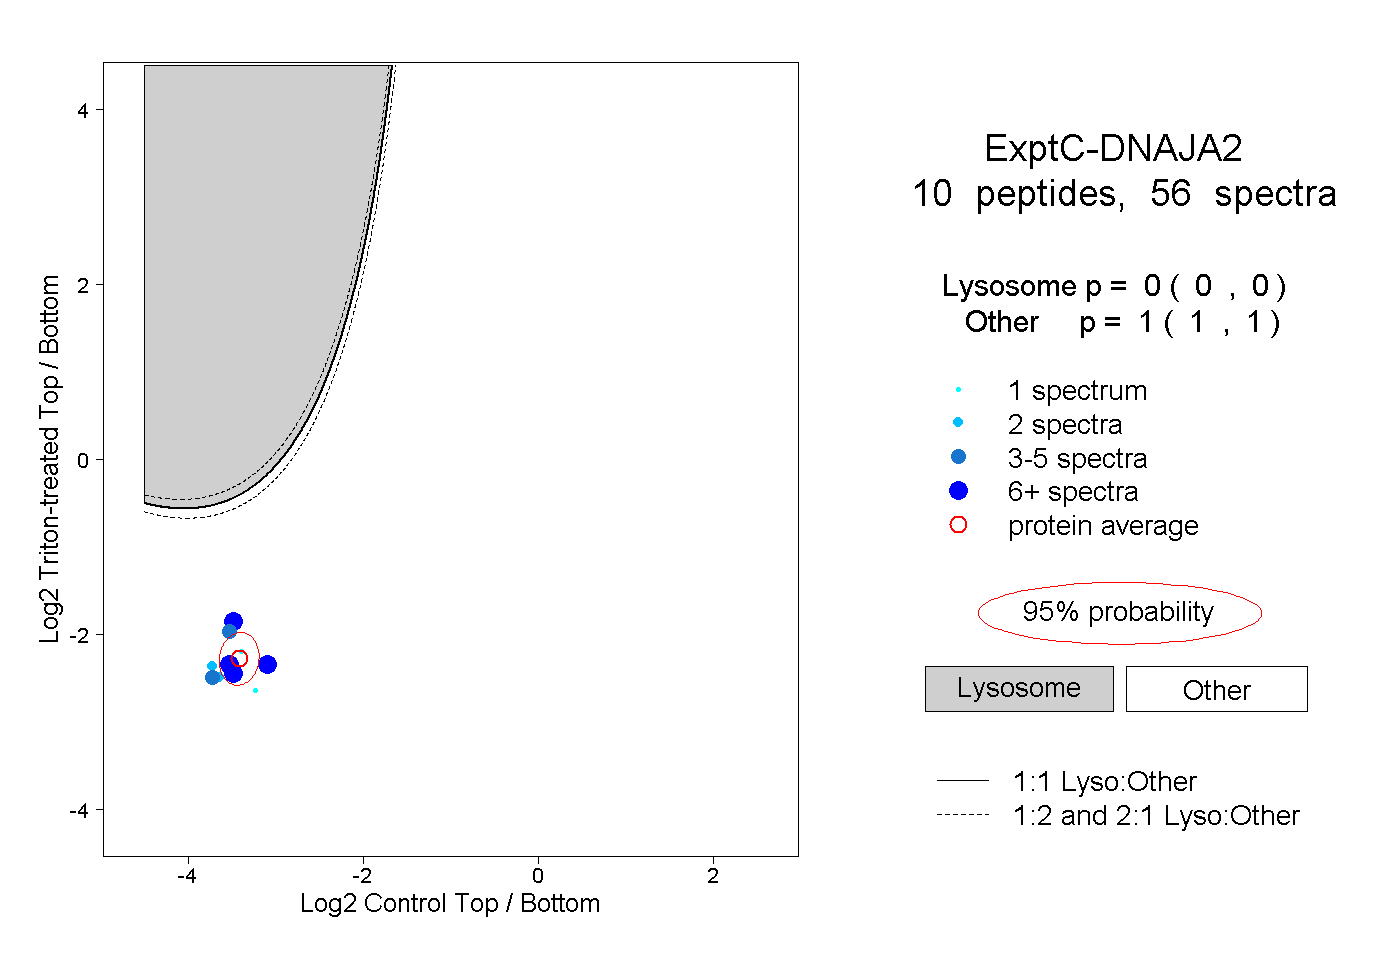
0.000 | 0.000
1.000 | 1.000
3peptides
spectra
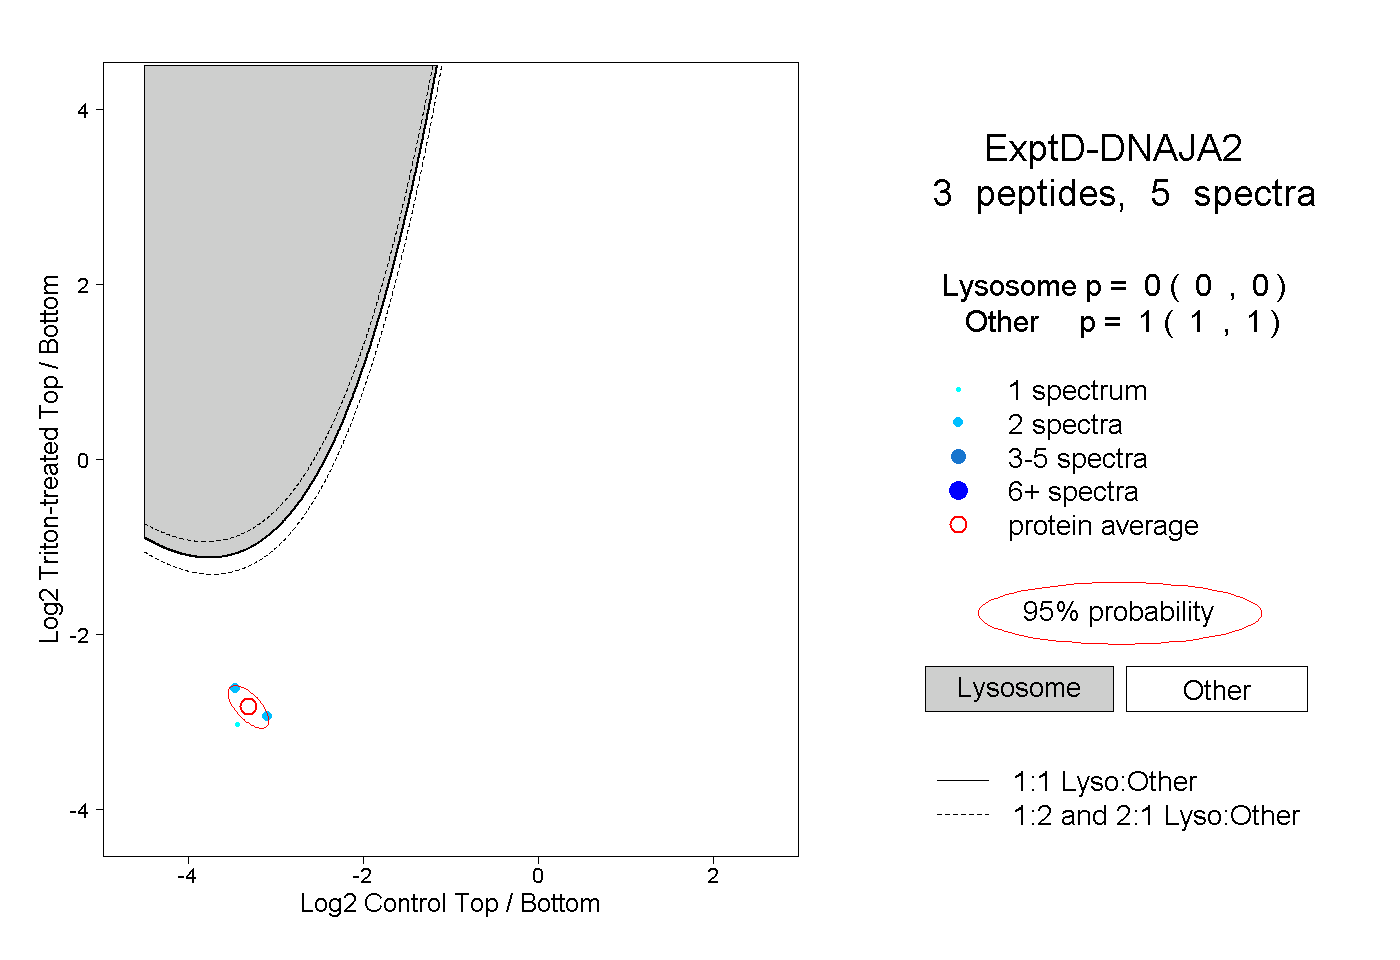
0.000 | 0.000
1.000 | 1.000