DNAJA2
[ENSRNOP00000022573]
Main page
| | | Plot |
Mito |
Lyso |
|
Perox |
ER |
Golgi |
PM |
Cytosol |
Nucleus |
|
| Expt A |
 10
10
peptides |
49
spectra |
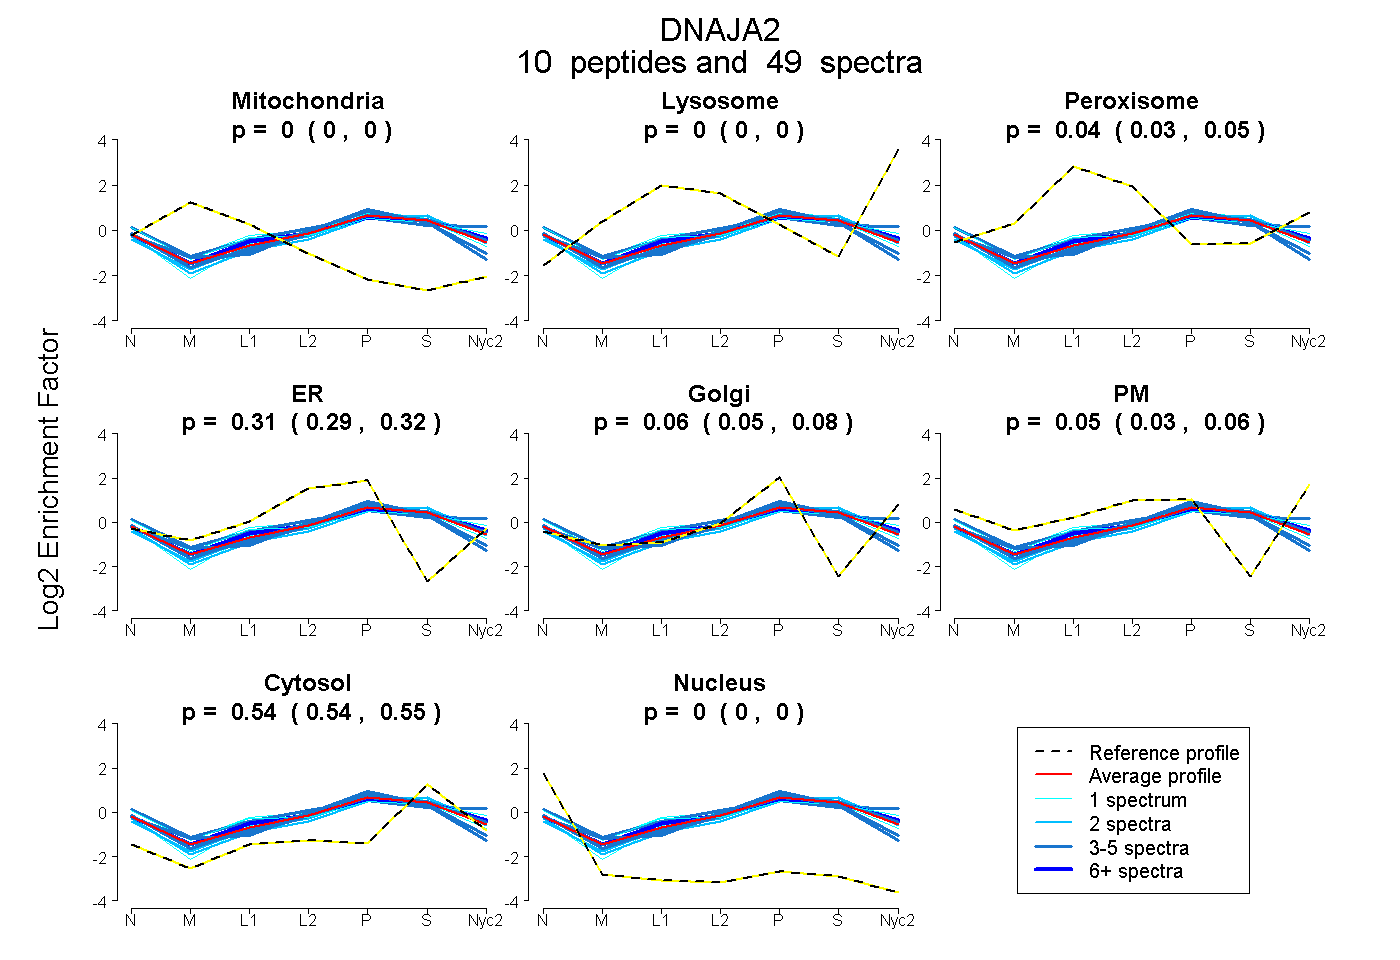 |
0.000
0.000 | 0.000 |
0.000
0.000 | 0.000 |
|
0.041
0.032 | 0.048 |
0.306
0.289 | 0.321 |
0.062
0.046 | 0.075 |
0.049
0.035 | 0.061 |
0.543
0.538 | 0.547 |
0.000
0.000 | 0.000 |
|
| | | Plot |
Mito |
|
Lyso or Perox |
|
ER |
Golgi |
PM |
Cytosol |
Nucleus |
|
| Expt B |
5
peptides |
8
spectra |
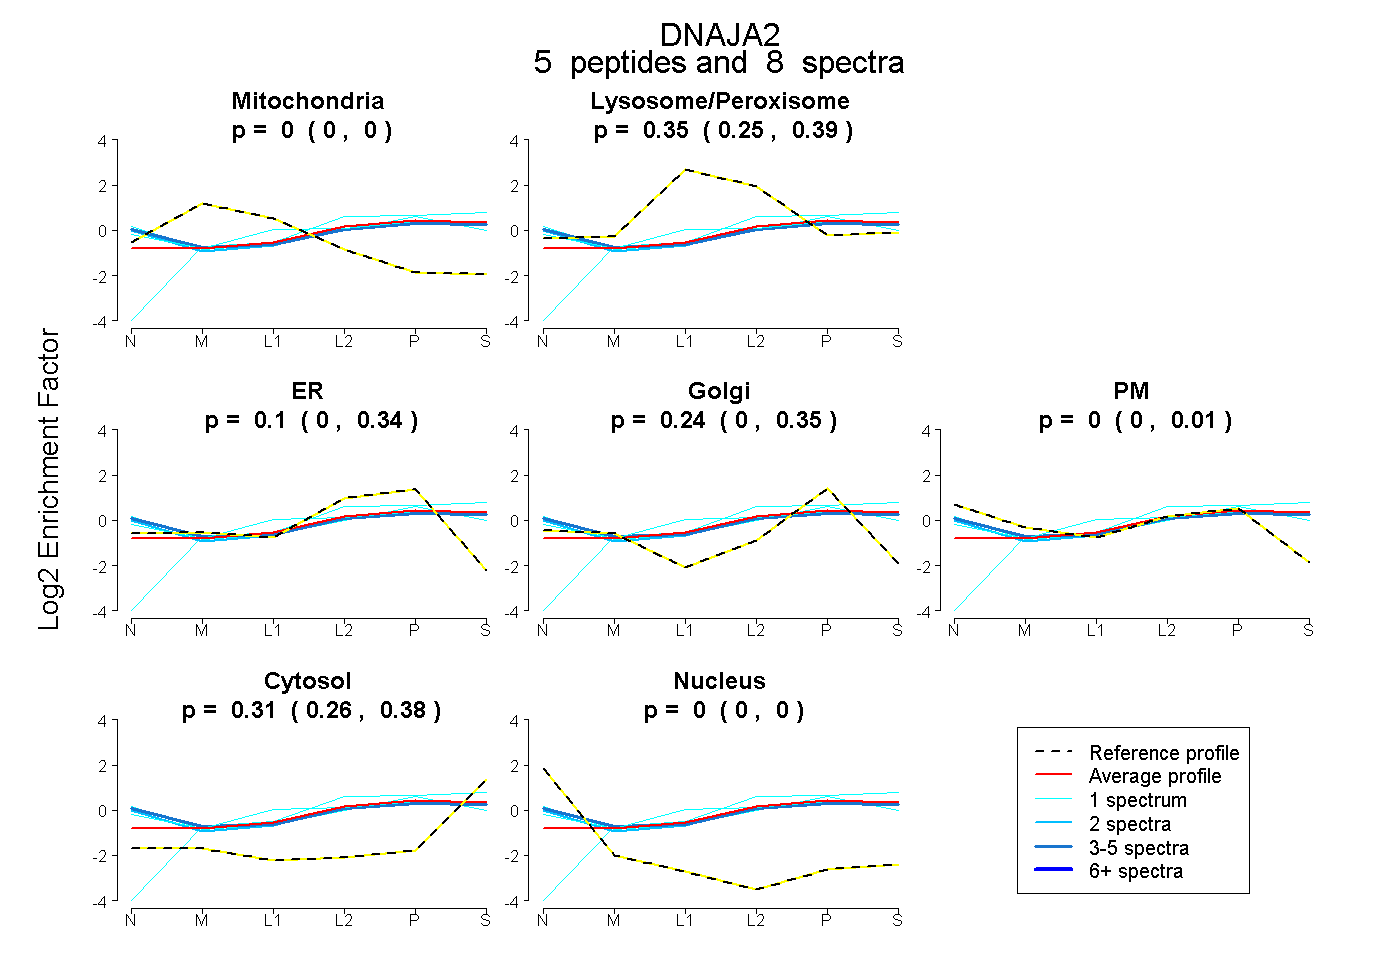 |
0.000
0.000 | 0.000 |
|
0.350
0.253 | 0.391 |
|
0.098
0.000 | 0.339 |
0.243
0.000 | 0.347 |
0.000
0.000 | 0.005 |
0.309
0.257 | 0.385 |
0.000
0.000 | 0.000 |
|
| 2 spectra, IIEVHVDK |
0.000 |
|
0.299 |
|
0.000 |
0.150 |
0.250 |
0.302 |
0.000 |
|
| 1 spectrum, GEGMPQYR |
0.000 |
|
0.260 |
|
0.000 |
0.240 |
0.287 |
0.213 |
0.000 |
|
| 1 spectrum, YGEQGLR |
0.000 |
|
0.455 |
|
0.000 |
0.274 |
0.021 |
0.250 |
0.000 |
|
| 3 spectra, VIEPGCVR |
0.000 |
|
0.264 |
|
0.000 |
0.108 |
0.338 |
0.290 |
0.000 |
|
| 1 spectrum, EHEVFQR |
0.000 |
|
0.261 |
|
0.286 |
0.000 |
0.000 |
0.453 |
0.000 |
|
| | | Plot |
|
Lyso |
|
|
|
|
|
|
|
Other |
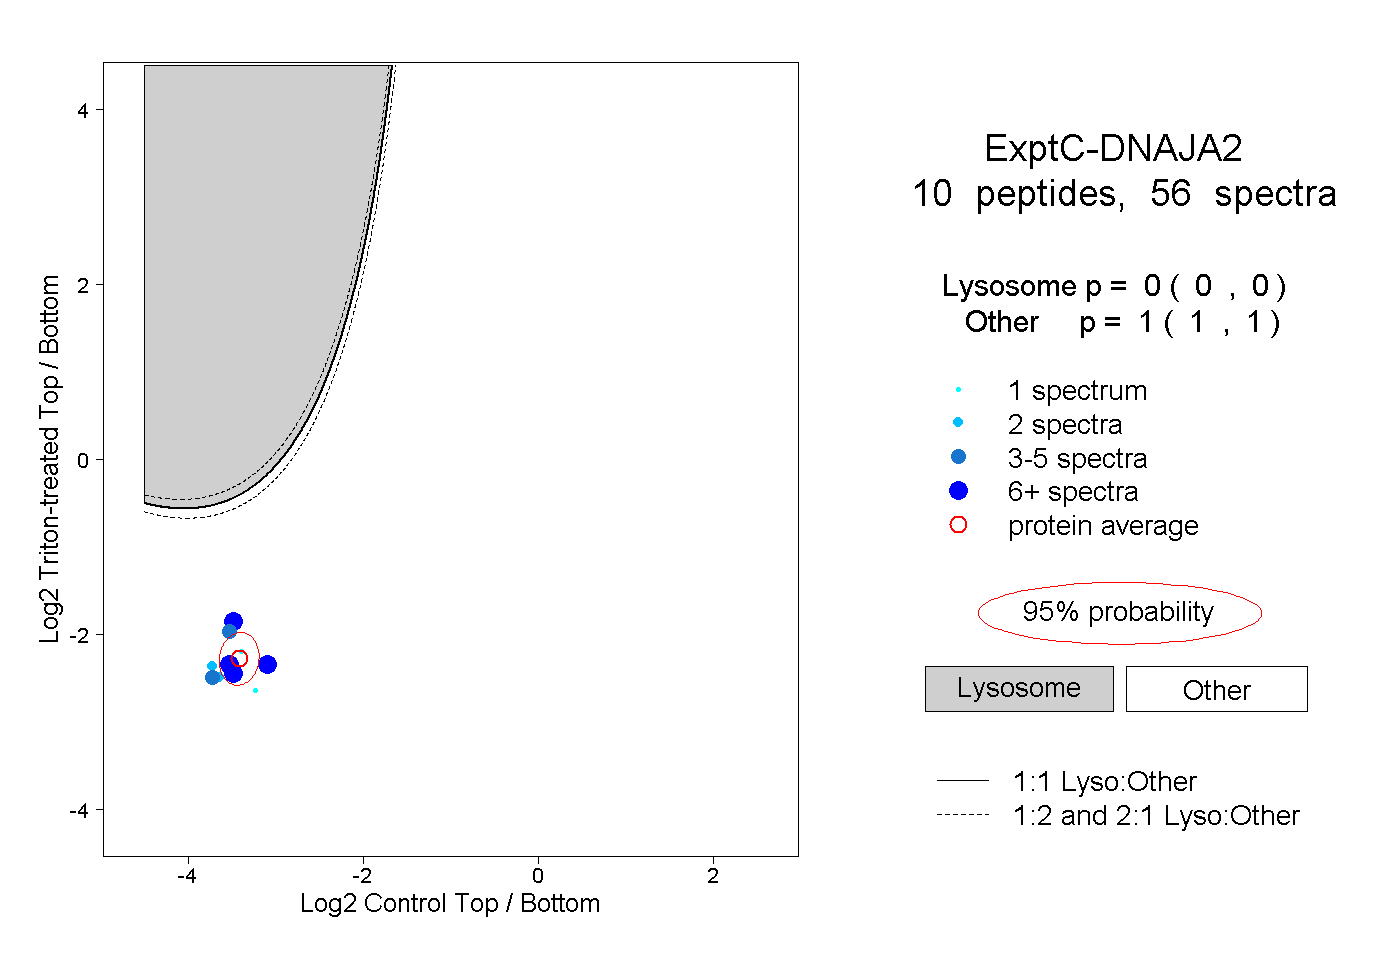
| Expt C |
10
peptides |
56
spectra |
 |
|
0.000
0.000 | 0.000 |
|
|
|
|
|
|
|
1.000
1.000 | 1.000 |
| | | Plot |
|
Lyso |
|
|
|
|
|
|
|
Other |
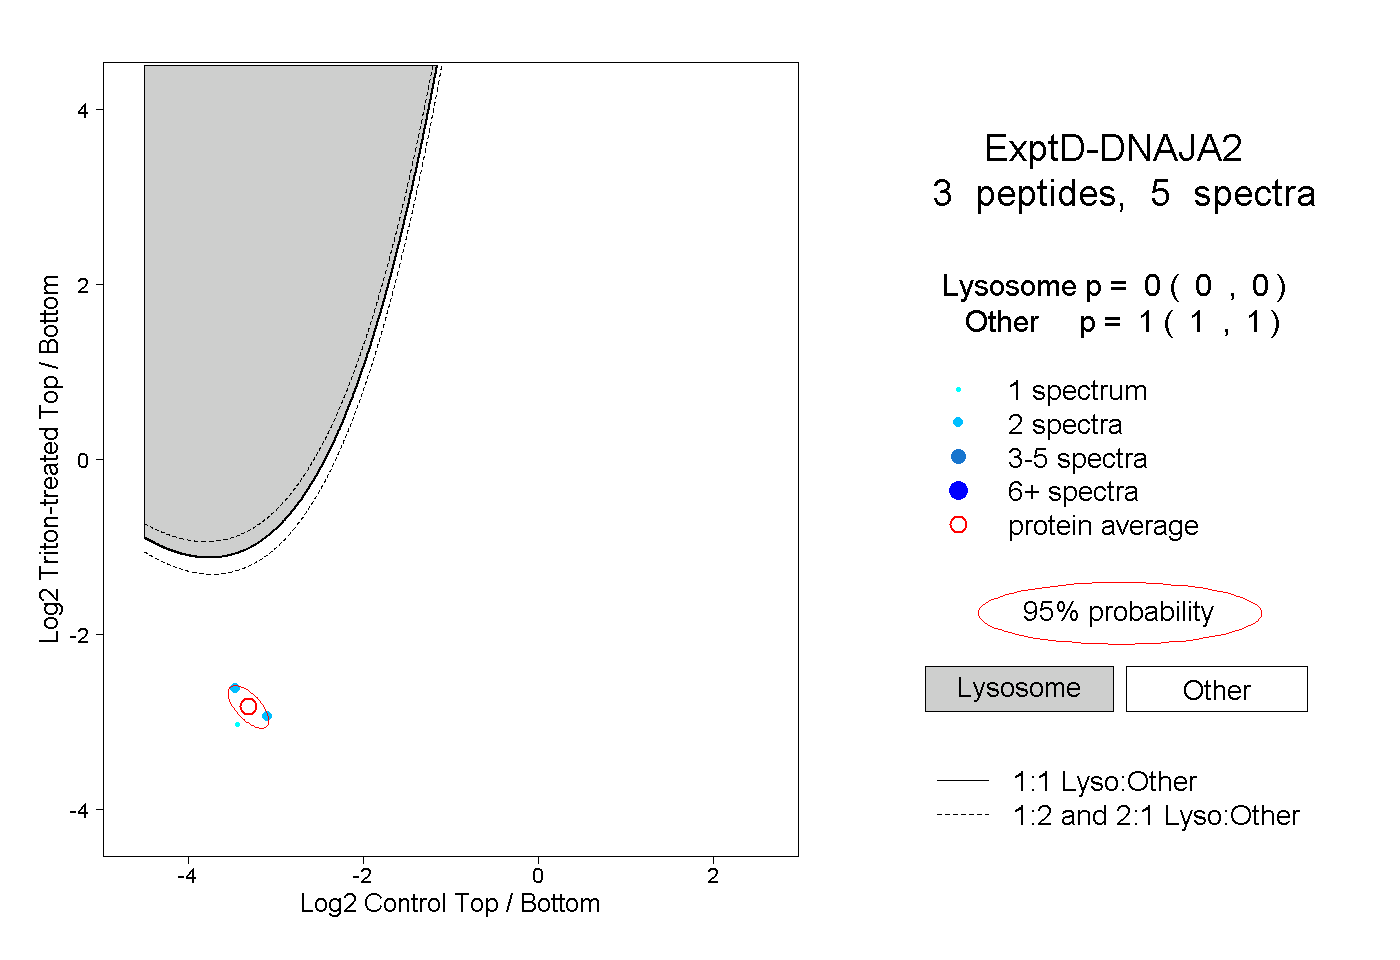
| Expt D |
3
peptides |
5
spectra |
 |
|
0.000
0.000 | 0.000 |
|
|
|
|
|
|
|
1.000
1.000 | 1.000 |