 22
22peptides
spectra
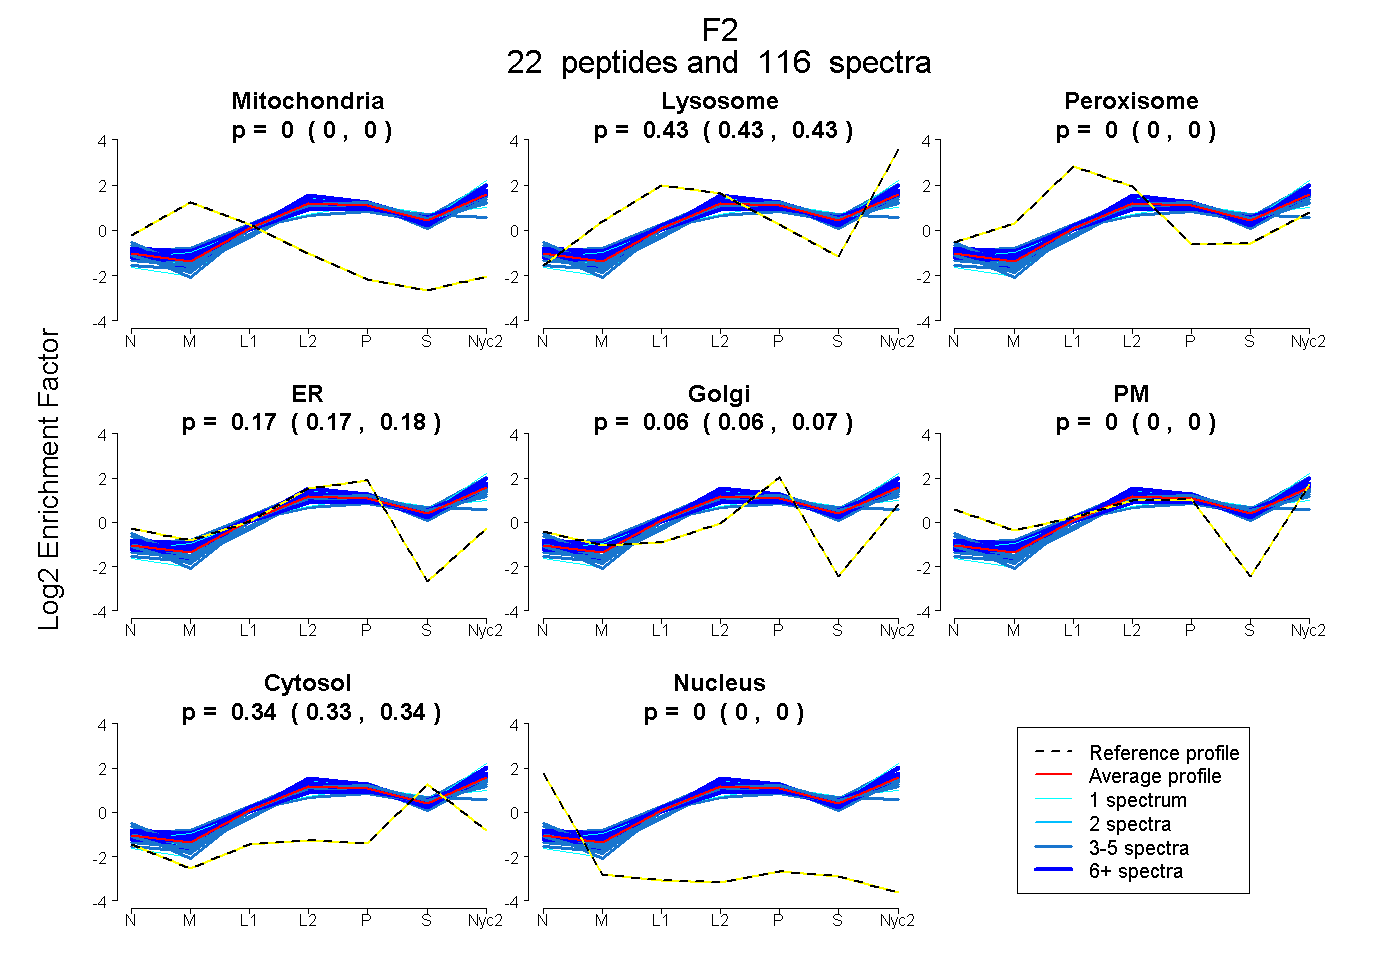
0.000 | 0.000
0.429 | 0.433
0.000 | 0.000
0.166 | 0.176
0.056 | 0.066
0.000 | 0.000
0.334 | 0.337
0.000 | 0.000
9peptides
spectra
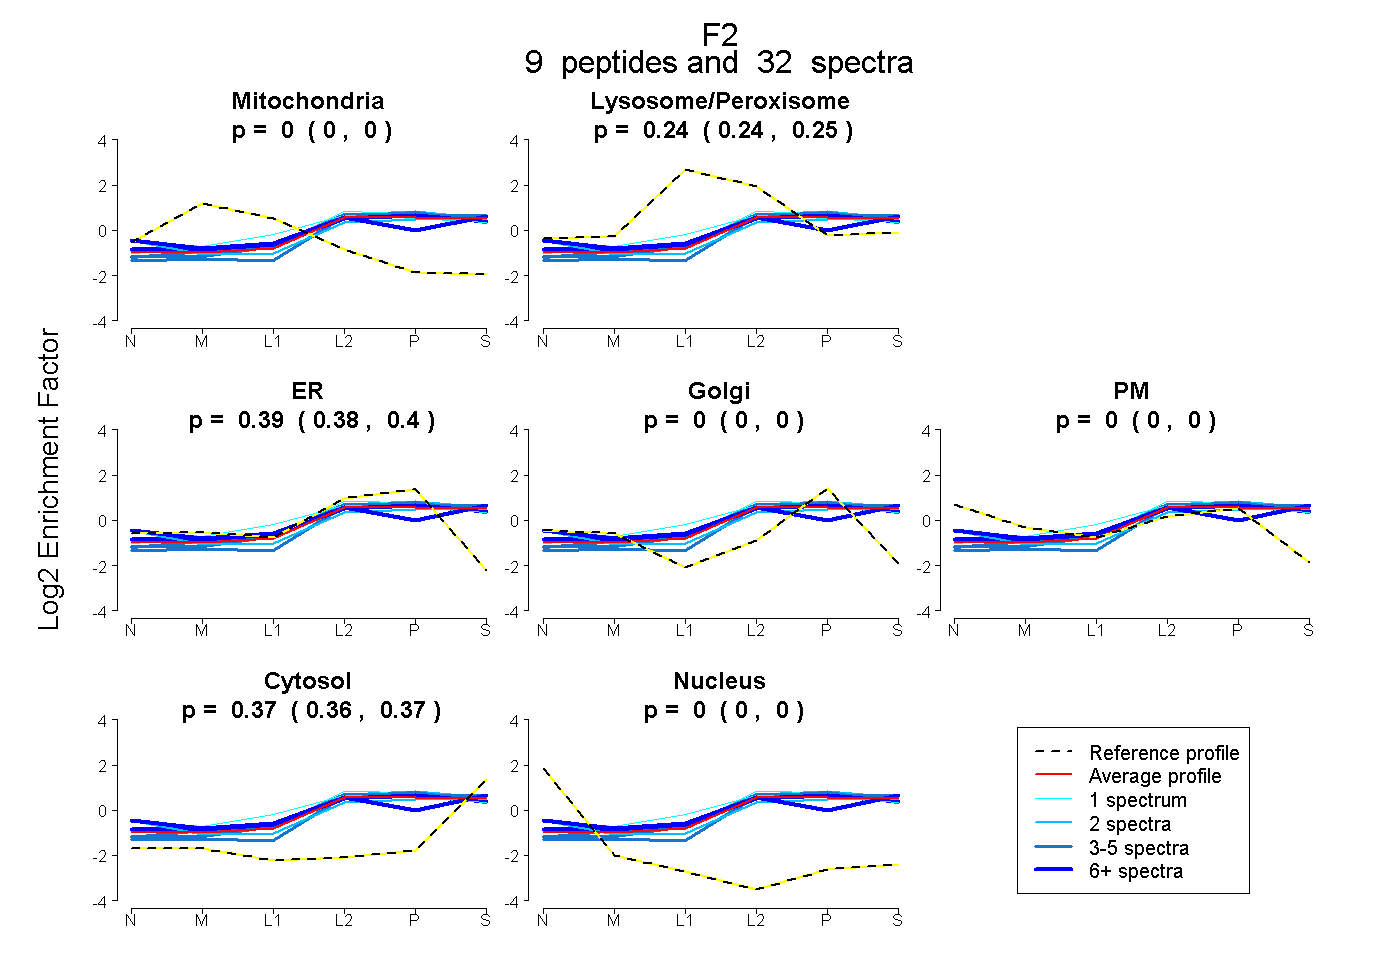
0.000 | 0.000
0.236 | 0.249
0.384 | 0.397
0.000 | 0.000
0.000 | 0.000
0.361 | 0.369
0.000 | 0.000
22peptides
spectra
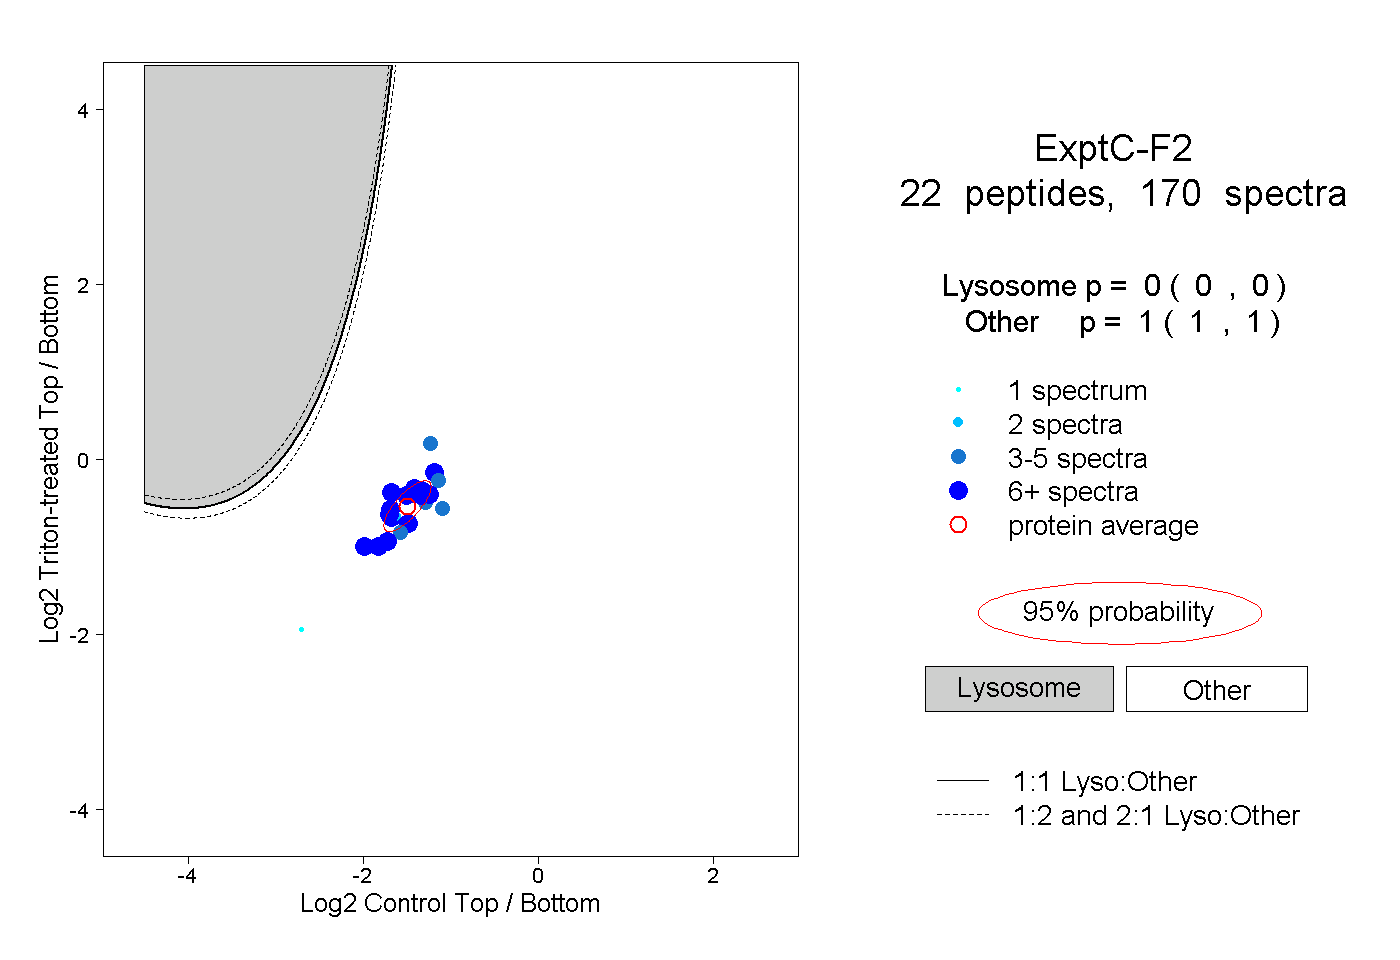
0.000 | 0.000
1.000 | 1.000
12peptides
spectra
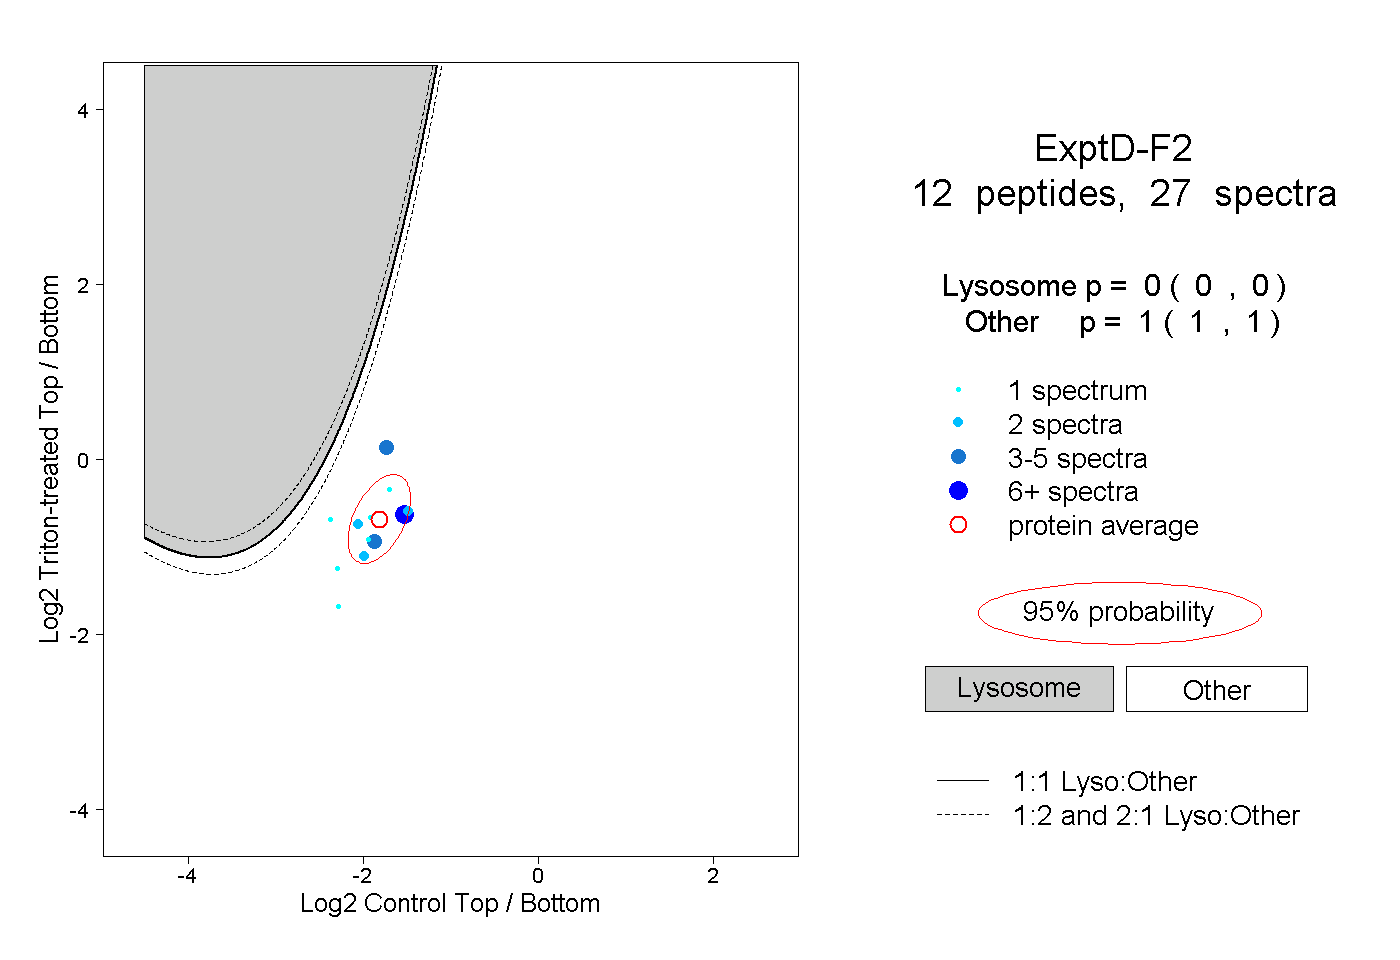
0.000 | 0.000
1.000 | 1.000